

AntonioSolano
Calumet Specialty Products (NASDAQ:CLMT) launched on August 5th. Oh my, what a sight. With management’s announced results, stunned investors observed the spectacle with a record EBITDA of $175 million. Clearly, unprecedented crack spreads drove a significant piece of the results leaving investors with a question, a serious question, was the launch a one off or is more coming? While we slowly walked from the glorious event, pondering answers to those two questions seemed essential. It certainly was to the analysts who attended the call. So let’s ponder together future possibilities, because in our view the launch continues.
Stunning Results
As stated above, the company reported an EBITDA of $175 million for the quarter. The closest to this EBITDA number was $110 million (excluding LCM/LIFO) in the 4th quarter of 2018. A slide from the latest quarterly presentation follows.
Calumet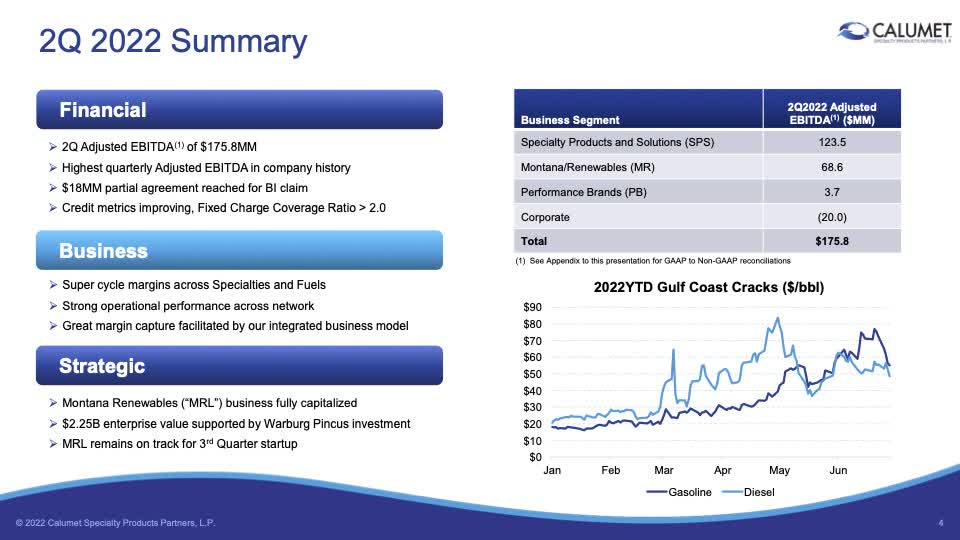
The individual businesses reported: SPS $123 million, MRL $69 million and PB $4. Corporate expenses were $20 million. As shown in the lower right hand portion of the slide, Gulf Coast crack spreads expanded to extra ordinary levels peaking near $70-$80 in May. Although Performance Brands still lags in performance, the rest of the company is operating on steroids.
In our last article, we included an estimate of individual parts that, when added together, equaled $145 million that was still $30 million low. (Note: we presented a lowered final estimate of $100-$115 million without the courage to believe fully the addition.) $10 million in that estimate was for asphalt. With the information provided that estimate is likely extremely low per the next slide.
Calumet Presentation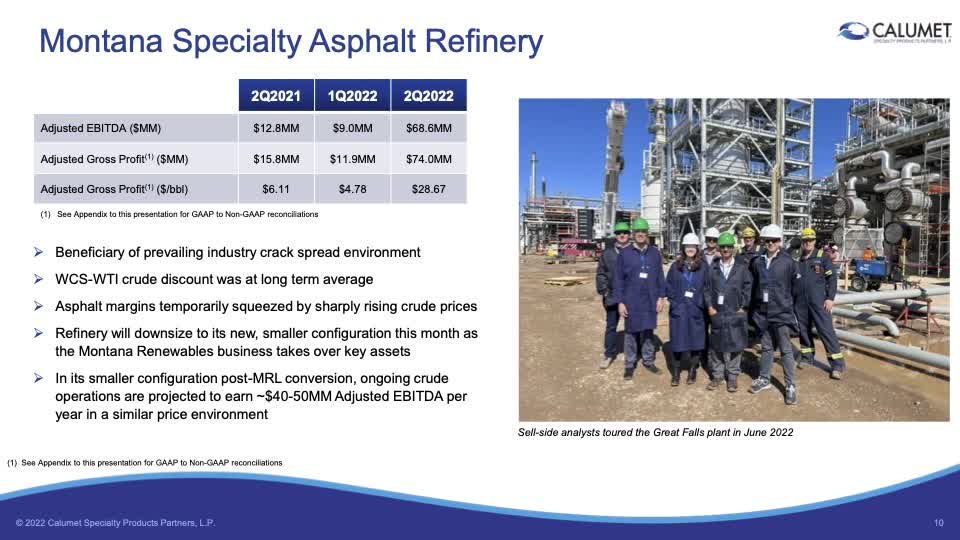
The 10-Q for the June quarter show that asphalt sales from Montana equaled $100 million. Using the Montana Gross Profit results for the 2nd quarter, asphalt sales netted closer to $30 million. Our $145 million estimate would equal $165 million or within +-10%.
A Review of the Quarter’s Key Spreads
Most important to investors is this a one-off unprecedented quarter or is it a new trend? To answer this, we begin by reviewing a couple of key factors from the June quarter. Our past model evaluates results based on crack spreads and production. Calumet provided on its slide a graph of the Gulf Coast crack spreads. We summarized approximate slide results in the next table.
| Slide Cracks | Diesel | Gasoline | 2-1-1 |
| April | $55 | $30 | $42 |
| May | $60 | $45 | $52 |
| June | $60 | $55 | $57 |
We also calculate our own spreads based on EIA data.
| EIA Cracks-2nd Quarter | 2-1-1 |
| April | $40 |
| May | $50 |
| June | $60 |
The two approaches match within reasonable precision.
Using our model shown in a past article, “we noted that every $10 increase in GC 2-1-1 spreads adds approximately $30 million of EBITDA per quarter. Also, changes in crack spreads exclude the seasonal markets for asphalt.”
3rd Quarter Estimate
The next table includes crack spreads for July and August to date.
| EIA Cracks-3rd Quarter | 2-1-1 |
| July | $45 |
| August-to-date | $35 |
| September | * $40 |
* Crack spread estimate for September assumes a strengthening in crude oil pricing with the continued drop in crude oil inventory.
Based on crack spread adjustments quarter over quarter of $10-$15, a reduction of $30-$40 million is likely. This number includes crack spread reductions at Great Falls. In addition, Great Falls didn’t operate during August or for 1/3 of the time that results in another reduction of approximately 30% in EBITDA or $20 million ($68 million * 0.30).
Great Falls Renewable will operate for one month (September) at 5000 barrels per day of waste feeds for its renewable diesel business. At $1.75 per gallon margin, the EBITDA could be $10 million (Numbers from the June 17th Cowen slides). (This corrects an error from our previous article which stated two months generating $20 million for the quarter.)
The 3rd quarter estimate might equal $175 – $40 – $20 or $115 million.
Although we aren’t yet ready to estimate the 4th quarter, two major impacts will affect it, loss of most of the asphalt revenue and the gain from a full quarter of MRL and Renewables operation. 4th quarter results could come in between the 2nd and 3rd quarter figures.
Financial Impact
The June quarter results plus our estimate for September makes or will make a huge positive impact against the balance sheet. From the June quarterly presentation, the company paid $42 million in interest expense. The total capital expenses for PB and Specialty equaled $20 million. The total cash expenses for June equal approximately $60 leaving $115 million for extra cash. The 3rd quarter balance equals $115 million – $60 million or $55 million. Extra cash from the two quarters might equal $170 million. The next slide shows the capital structure with $200 million coming due in 2024.
Calumet 2nd Quarter Presentation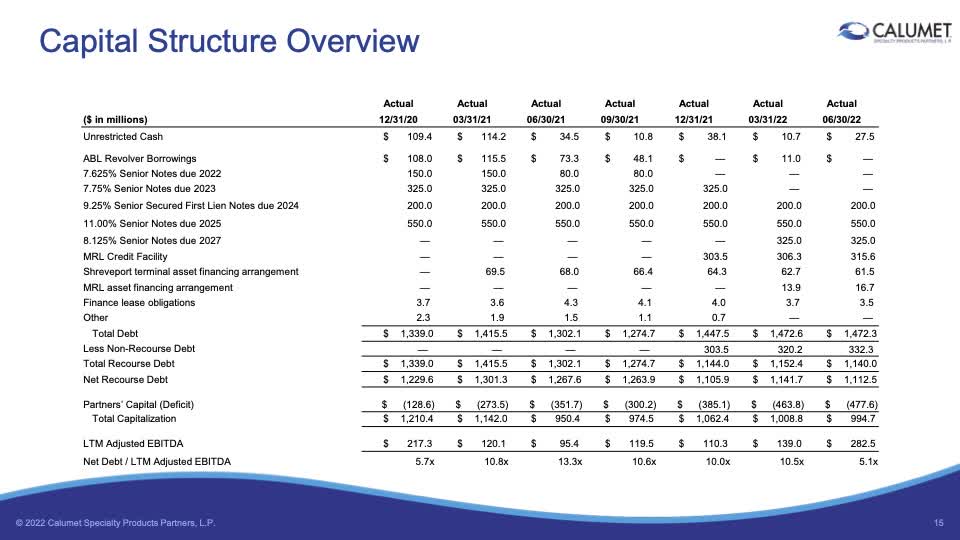
From the above slide presented at the last conference, Calumet just earned equal cash to pay off the $200 million bonds due in 2024. The balance sheet would then show debt at approximately $950 million.
The Chart
Next, we include a longer-term weekly chart of Calumet developed using TradeStation.
TradeStation Securities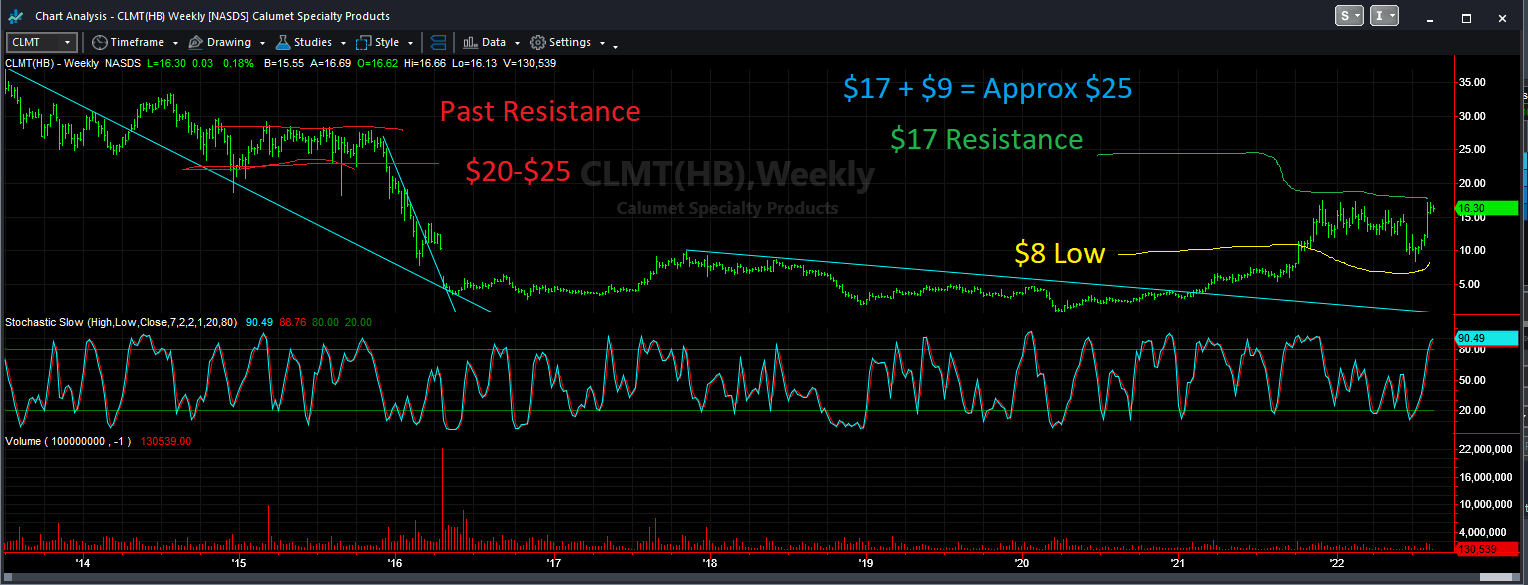
This chart shows a couple of important issues. From the far right, the resistance point shown at $17-$18 remains in place. With the low created in the past few weeks at $9, a break of $17 places the old strong resistance value at $25 in play. The stock reaction to the positive news is starting to create a picture of future possibilities. The chart can also be taken one step further. Though not shown, Calumet reached a high years ago near $50. $25 – $1 + $25 = $50 equals that old years ago high. Though it is way too early to discuss this possibility, it’s interesting to note what the charts are telling investors.
Risks & Investment
From an investment stand point, most important is the recent insider buying. Management buying adds to the bullish story. This is in a real demonstration putting their money where their mouth is at prices near short-term highs. We believe that this example speaks loudly about owning, adding or 1st time buying of Calumet.
Yes, risks exist. The stock price is near recent highs and could break down to lower prices from these recent highs. World economies could falter experiencing a recession. For Calumet, with its MRL resources, the slowing of other businesses would be supported by this newer resources being in short supply. For us, Calumet has never appeared so cheap. Buying or adding to ones position just might be a lucrative investment.
Be the first to comment