

Clara Bastian/iStock via Getty Images
Investment Thesis
Did you know that more than 20% of the companies in the S&P 600 SmallCap Index lost money over the last twelve months? Investing in these types of companies stunts returns over the long run, which is precisely what the Pacer US Small Cap Cash Cows ETF (BATS:CALF) seeks to avoid. CALF owns 100 small-cap stocks weighted by their free cash flow yields, effectively ensuring a highly profitable, deep-value portfolio worth considering.
CALF’s quarterly reconstitutions always make it an exciting ETF to review, and in my view, the latest changes were for the best. CALF eliminated some of the Retail and Biotechnology companies I expressed concern about in July and replaced them with inflation-friendly Oil & Gas E&P stocks. To be sure, CALF is still a risky play, and it’s still not where it needs to be. However, it’s now better balanced and could bounce back strongly if we’re close to market lows. I look forward to taking you through the latest changes and fundamentals next.
CALF Strategy and Composition
CALF tracks the Pacer US Small Cap Cash Cows Index, selecting 100 companies from the S&P SmallCap 600 Index with high trailing twelve-month free cash flow yields. Free cash flow dollars weight the index rather than free cash flow yield, giving the index a size tilt to larger companies, but constituents’ weights are capped at 2% to improve diversification. The graphic below describes the entire selection process.
Pacer ETFs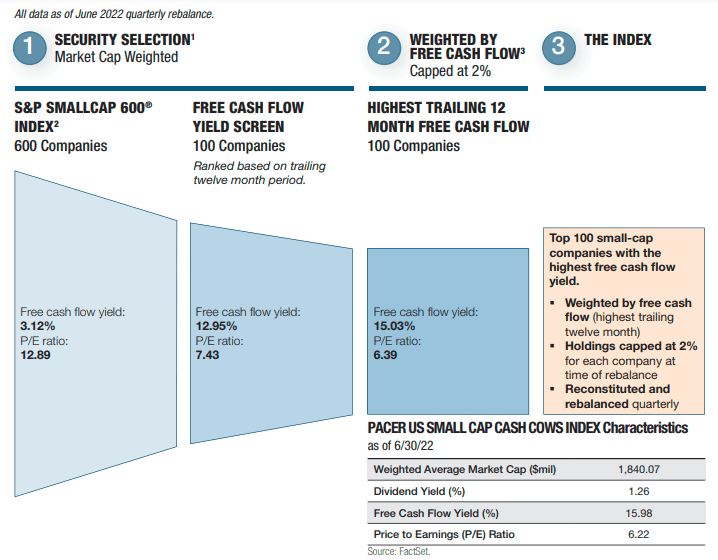
This graphic shows how this strategy takes the free cash flow yield of the S&P SmallCap 600 Index from 3.12% to 15.03%, simultaneously slashing its P/E ratio in half as of June 2022. Notably, the Index reconstitutes quarterly to better respond to market conditions.
Pacer only updates CALF’s sector exposures charts quarterly, so, unfortunately, they’re outdated. The best source for updates is Morningstar, which shows CALF overweight the Consumer Discretionary sector by about 16%. It’s typical, but remember that CALF had 36% exposure to this sector in June. CALF also has better inflation protection through 10.54% exposure to Energy and 8.10% to Materials, up from 4.28% and 6.42% previously.
Morningstar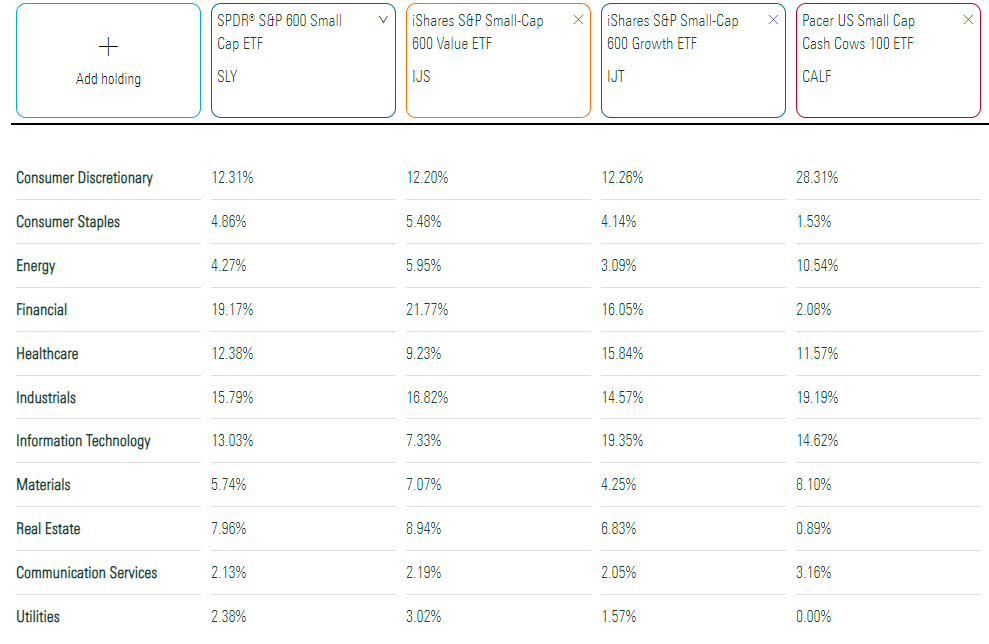
At the industry level, the key additions were:
- Oil & Gas Exploration & Production (3.29%)
- Oil & Gas Refining & Marketing (2.08%)
- Paper Products (1.84%)
- Building Products (1.81%)
- Semiconductor Equipment (1.29%)
- Trading Companies & Distributors (1.26%)
And the key deletions were:
- Biotechnology (3.12%)
- Specialty Stores (2.22%)
- Apparel Retail (2.13%)
- Industrial Machinery (1.37%)
- Diversified Chemicals (1.17%)
- Pharmaceuticals (1.09%)
- Homebuilding (1.05%)
CALF’s top ten holdings are below, totaling 20.48%. Notice how most have hit that 2% threshold, including Atlas Air Worldwide Holdings (AAWW). The air freight operator was recently bought out by an investor group led by Apollo (APO), with shareholders set to receive a 57% premium. AAWW was held by CALF pre-reconstitution, making it one of the fund’s top performers.
Pacer ETFs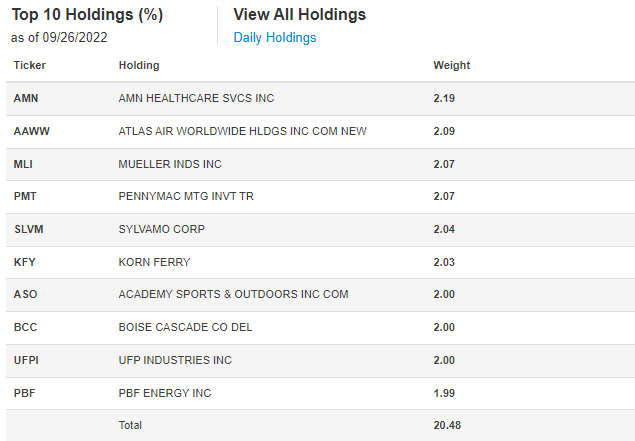
CALF’s Performance
CALF only launched in June 2017, gaining an annualized 5.37% vs. 5.63% and 4.78% for the iShares Core S&P Small-Cap ETF (IJR) and the iShares S&P Small-Cap 600 Value ETF (IJS). Notably, CALF has outperformed IJR by nearly 26% since the pandemic recovery began in April 2020.
Portfolio Visualizer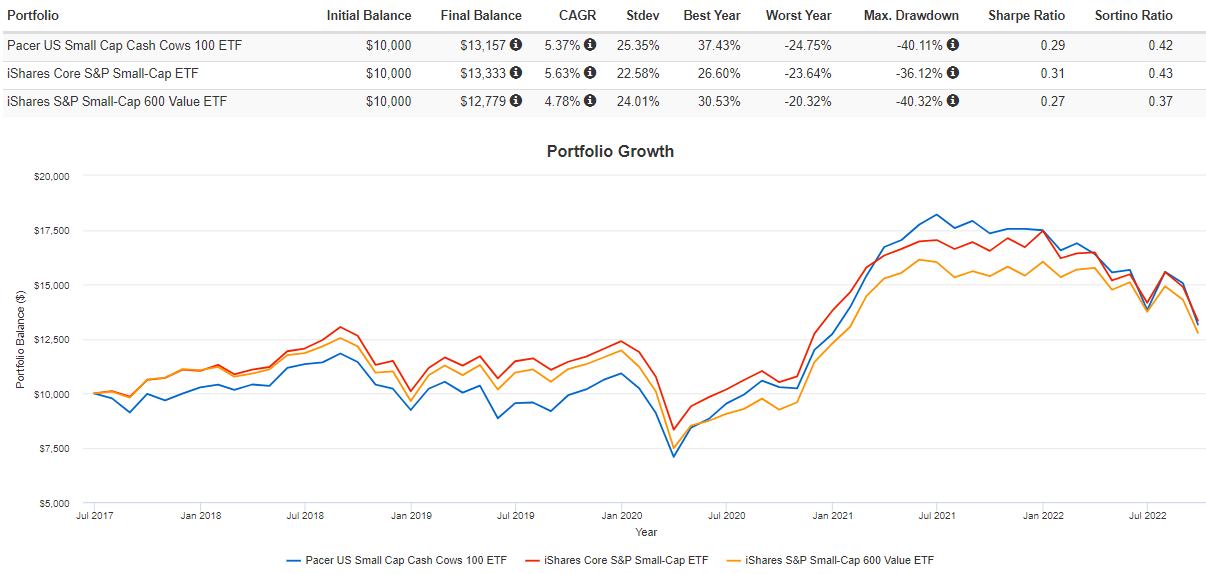
However, CALF has the 12th-worst YTD returns out of 72 small-cap dividend, value, and blend ETFs. Vanguard’s VBR and VB, which select from a wider stock universe, have done a bit better, while the Avantis U.S. Small Cap Value Fund (AVUV) has outperformed by 7.44%.
Seeking Alpha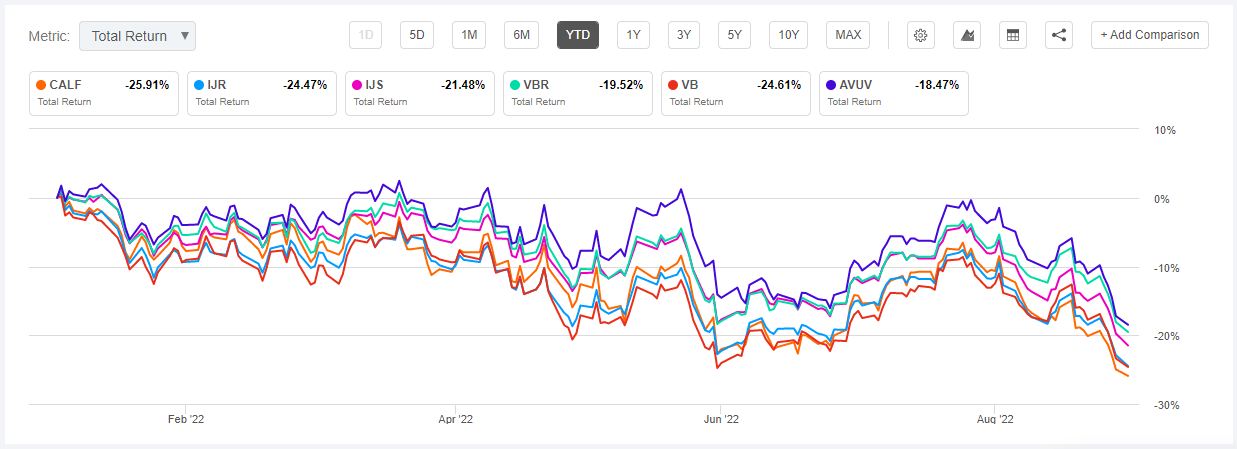
Fundamental Analysis of CALF
The following table highlights fundamental metrics for CALF’s top 25 industries, which total 76.81% of the portfolio. CALF’s five-year beta is now 1.38, and nearly every industry trades at less than 10x forward earnings. Also, except for the commodity-linked holdings, most are down substantially this year. Automotive Retail is off 18%. Health Care Services and Apparel Retail are down over 30%, and Semiconductors are off by 43%. Clearly, CALF is primarily a deep-value play.
The Sunday Investor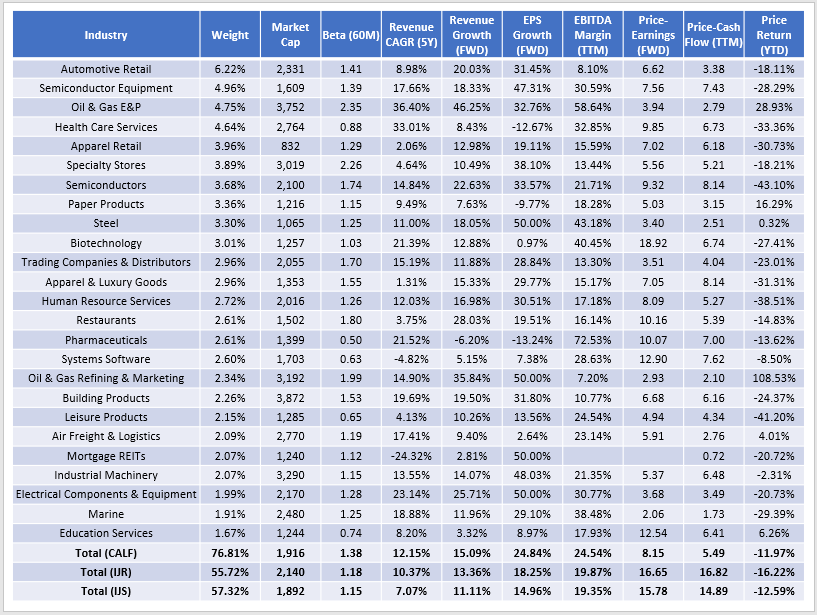
Analysts still expect CALF’s holdings to grow sales 2-4% faster than IJR and IJS and earnings by 4-8%. Like in July, CALF’s 24.54% EBITDA margin is about 4-5% better. There are only a few small-cap ETFs with margins this strong. AVUV is one of them, and investors looking for similar profitability with more downside protection can turn to the WisdomTree SmallCap Dividend ETF (DES). Still, these fundamentals are some of the best you’ll find in the category, which shouldn’t surprise readers since the Index is designed based on profitability and valuation.
Instead, I think readers should focus more on CALF’s volatility. As shown in the performance section earlier, buying CALF at the wrong time is very easy. In up markets, CALF should do great, but in down markets, those gains can be erased. The 1.38 five-year beta is higher than most small-cap growth ETFs, so don’t make of connecting value and safety. Deep-value investing requires a lot of patience, which doesn’t align with CALF’s quarterly reconstitution strategy.
Investment Recommendation
CALF continues to have strong fundamentals, as expected. It’s a high-potential ETF but a very volatile one. However, the last reconstitution resulted in positive changes, and CALF is now a better-balanced fund with more inflation protection. It removed a few of the more speculative Retail stocks and replaced them with Energy holdings, which now represent 10% of the portfolio. Plus, the focus on free cash flow makes sense for small-cap companies. 20% of companies in the SmallCap 600 Index lost money last year, and that number grows if you select from broader Indexes like Vanguard’s CRSP Indexes or the Russell 2000.
While my opinion on CALF has improved, it’s still heavily dependent on the Consumer Discretionary sector, which makes up 28% of the ETF. U.S. retail sales trends are downward, and there’s a lot of uncertainty about the impact of higher interest rates on the economy. My preference would be for CALF to be even better balanced by sacrificing some impressive “on paper” metrics like high free cash flow yield and low P/E. A few more common sense screens focused on diversification and volatility would make the fund more attractive to me. However, that’s unlikely to change, so for those reasons, I remain neutral on CALF and look forward to providing an update following the subsequent quarterly reconstitution.
Be the first to comment