

POUND STERLING ANALYSIS & TALKING POINTS
- Fed officials in focus today – will the hawkish rhetoric continue?
- Lingering UK strike action does not bode well for UK economy.
- Daily cable chart exhibits caution as traders await fundamental cues.
Recommended by Warren Venketas
Get Your Free GBP Forecast
GBP/USD FUNDAMENTAL BACKDROP
In what has been a consistent theme throughout FX markets of recent, U.S. economic data and Fed guidance has been at the forefront of currency movements. The pound is no different and has found some relief after a significant USD rally last week. Yesterday saw Fed Chair Jerome Powell reiterated his message from last week’s rate decision whereby he cited disinflation once more; however, he did elude to the need for more interest rates hikes should the labor market remain robust. When asked about the potential for a move back to a 50bps increment in the next meeting, he cleverly declined to respond so as to not stoke too much market volatility. The Fed’s Kashkari echoed these hawkish sentiments in his speech yesterday noting that a tight labor market will not allow for an easy path towards reducing inflationary pressures.
Trade Smarter – Sign up for the DailyFX Newsletter
Receive timely and compelling market commentary from the DailyFX team
Subscribe to Newsletter
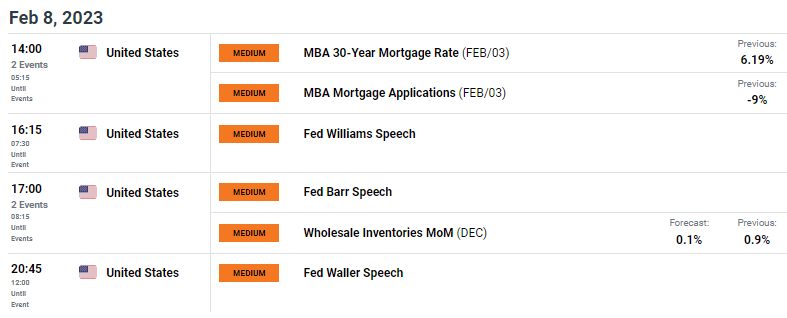
Later today, several other Fed officials are scheduled to speak (see economic calendar below) and should they follow the same path as their counterparts, GBP/USD may be in for further downside.
Source: DailyFX Economic Calendar
From a UK perspective, strike action remains a concern for the government and on March 15, there are plans for civil servants to implement another strike. Chancellor of the Exchequer Jeremy Hunt will deliver his fiscal plan on the same day and will be under additional pressure to possibly reassess pay settlement queries. Overall, this is bearish for the pound as the strike action disrupts the UK economy and questions the UK leadership. slew
TECHNICAL ANALYSIS
Introduction to Technical Analysis
Moving Averages
Recommended by Warren Venketas
GBP/USD DAILY CHART
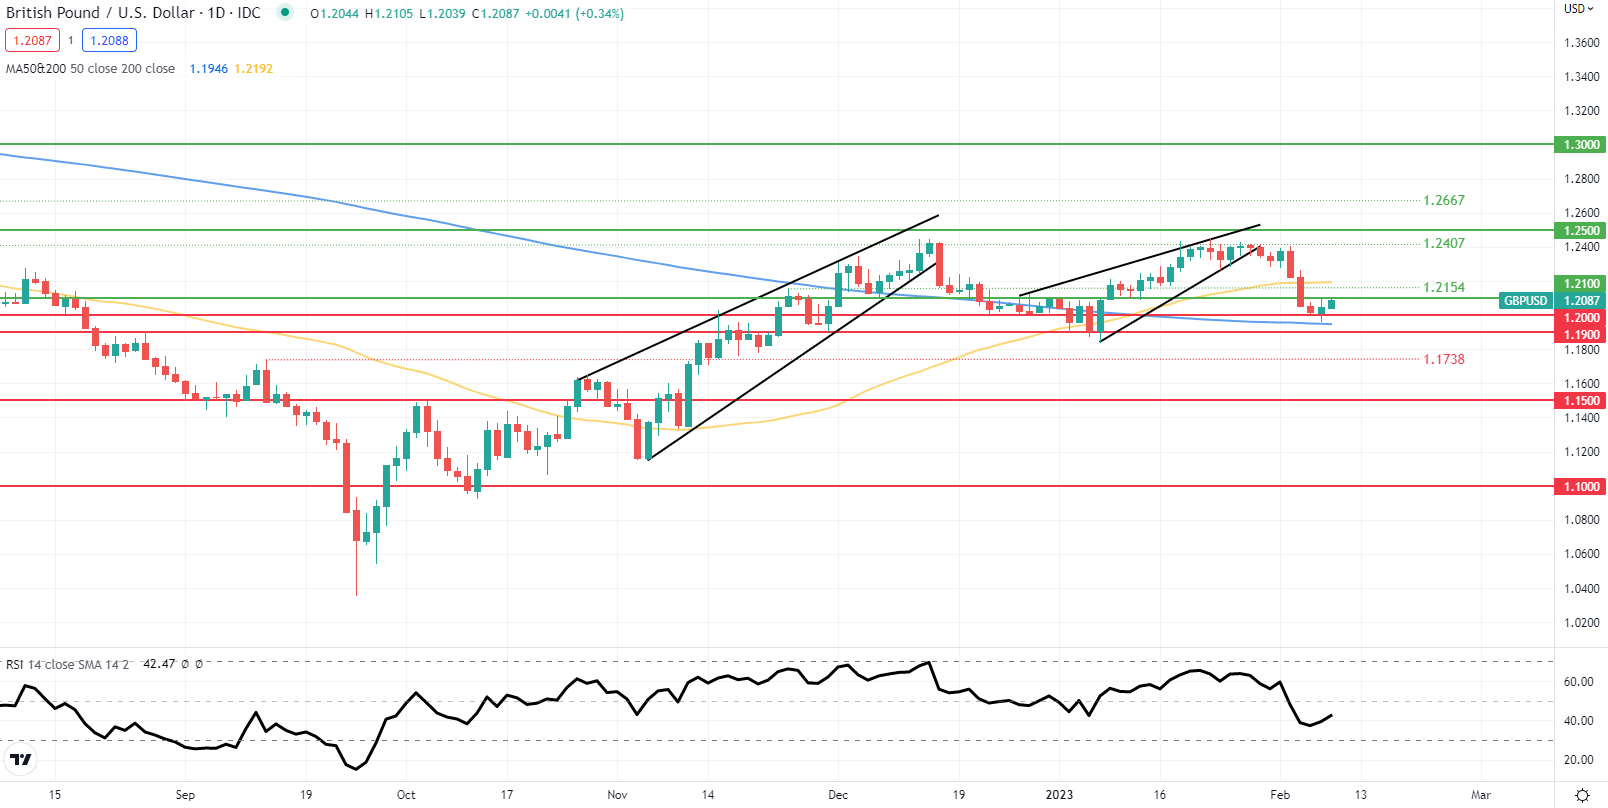
Chart prepared by Warren Venketas, IG
The daily GBP/USD chart has just pushed above the 1.2000 psychological level and looks to be testing the 1.2100 resistance handle. Now sandwiched between the 50-day (yellow) and 200-day (blue) SMA’s respectively, there is no real clear directional bias. Cable could easily slip back below the 200-day SMA depending on Fed chatter but first I would be looking for a daily candle close below the 1.2000 support level. Looking at the Relative Strength Index (RSI), the pair seems to be creeping up towards the midpoint 50 level but remains in favor of downside momentum leaving room for further pound weakness.
Key resistance levels:
Key support levels:
BEARISH IG CLIENT SENTIMENT
IG Client Sentiment Data (IGCS) shows retail traders are currently LONG on GBP/USD, with 68% of traders currently holding long positions (as of this writing). At DailyFX we typically take a contrarian view to crowd sentiment resulting in a short-term upside disposition.
Contact and followWarrenon Twitter:@WVenketas
Be the first to comment