

Pgiam/iStock via Getty Images
INVESTMENT THESIS
Here we provide the reason Apple Inc. (AAPL) investors have no “dead meat” problems with GoPro Inc. (GPRO) or Alphabet Inc. (GOOG)(GOOGL) alternative investments.
Every investment involves a forecast of the future. Those forecasts must encompass the uncertainty of the future. The more future time is involved, the larger the risk potential and the reward prospects. Both aspects should be compared to one another, and that balance accepted/rejected by the investor’s need and purpose.
Sciences of nature in the world around us operate in terms of evidenced, accepted rules of outcomes. Everything else is happenstance, and involves uncertainty. Many natural uncertainties appear to relate to “variables.”
When those variables themselves appear to lack forecast-able outcomes, as in investing, it often is because humans are involved. Humans, as sentient beings, are known to change their minds – and their rules of behavior.
That classifies such behaviors as “games” where “strategy” of behaviors becomes part of the game of “playing the players.” Games like WAR and INVESTING.
The players with the most (and best) resources have the best prospects of winning the game’s events. In the investing war, the advantage usually favors the institutions. They recognize that in the investing game the resources being invested are BOTH capital and time.
Because investing performance is measured over time (which cannot be replaced once spent) it needs respect when committed. Because uncertainty increases with time commitment, the astute investors are quick to adjust their strategies to recognize change.
This is why near-term price expectations need constant attention. Institutions have the resources to demand – and get – attention. They won’t wait for 4 years to find out a mistake was made.
Risk and Reward Balances
Market Maker (MM) forecasts are of reasonable-to-expect price limits, both higher and lower. Their range, split by current market price, defines the balance of gain vs. loss prospects. Figure 1 shows those upper and lower limits of price change on the given date for each of the stocks identified by reader traffic on Yahoo and other internet services.
Figure 1
blockdesk.com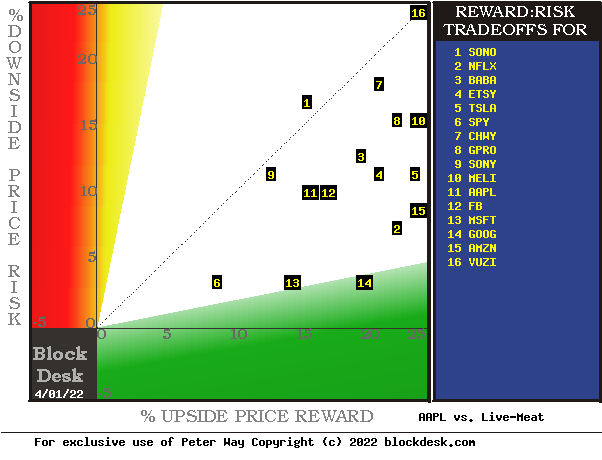
Upside price rewards are from the behavioral analysis (of what to do right, not of errors) by Market-Makers as they protect their at-risk capital from possible damaging future price moves. Their potential reward forecasts are measured by the green horizontal scale.
The risk dimension is of actual price drawdowns at their most extreme point while being held in previous pursuit of upside rewards similar to the ones currently being seen. They are measured on the red vertical scale.
Both scales are of percent change from zero to 25%. Any stock or ETF whose present risk exposure exceeds its reward prospect will be above the dotted diagonal line. Capital-gain attractive to-buy issues are in the directions down and to the right.
Our principal interest is in AAPL at location [11]. A “market index” norm of reward~risk tradeoffs is offered by SPY at [6]. Most appealing by this Figure 1 view are GOOG at [14] and MSFT at [13].
This map provides a good visual comparison of the two most important aspects of every equity investment. There are other aspects of comparison which this map sometimes does not communicate well, particularly when general market perspectives like those of SPY are involved. Where questions of “how likely’ are present other comparative tables, like Figure 2, may be useful.
Figure 2
blockdesk.com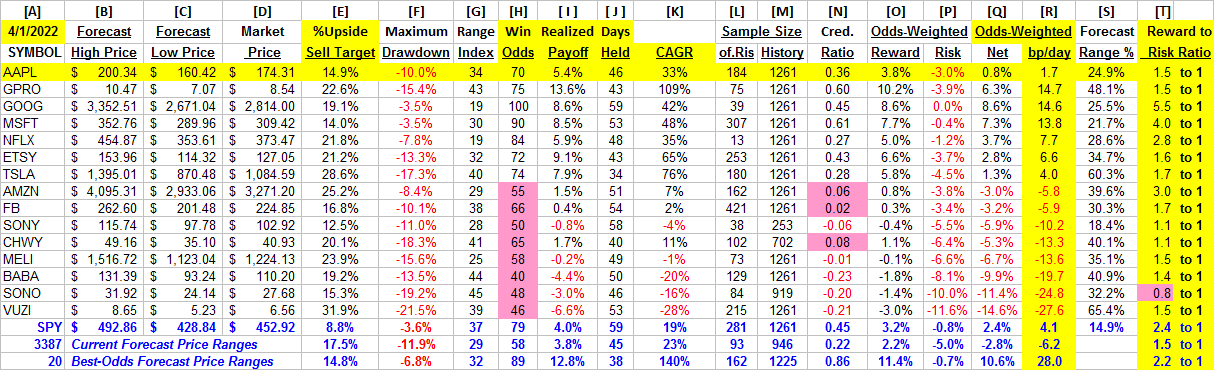
Column headers for Figure 2 define investment-choice preference elements for each row stock whose symbol appears at the left in column [A]. The elements are derived or calculated separately for each stock, based on the specifics of its situation and current-day MM price-range forecasts. Data in red numerals are negative, usually undesirable to “long” holding positions. Table cells with pink background “fills” signify conditions typically unacceptable to “buy” recommendations. Yellow fills are of data for the stock of principal interest and of all issues at the ranking column, [R].
Readers familiar with our analysis methods may wish to skip to the next section viewing price range forecast trends for AAPL, GPRO, and GOOG.
Figure 2’s purpose is to attempt universally comparable answers, stock by stock, of a) How BIG the prospective price gain payoff may be, b) how LIKELY the payoff will be a profitable experience, c) how soon it may happen, and d) what price drawdown RISK may be encountered during its holding period.
The price-range forecast limits of columns [B] and [C] get defined by MM hedging actions to protect firm capital required to be put at risk of price changes from volume trade orders placed by big-$ “institutional” clients.
[E] measures potential upside risks for MM short positions created to fill such orders, and reward potentials for the buy-side positions so created. Prior forecasts like the present provide a history of relevant price draw-down risks for buyers. The most severe ones actually encountered are in [F], during holding periods in effort to reach [E] gains. Those are where buyers are most likely to accept losses.
The Range Index [G] tells where today’s price lies relative to the MM community’s forecast of upper and lower limits of coming prices. Its numeric is the percentage proportion of the full low to high forecast seen below the current market price.
[H] tells what proportion of the [L] sample of prior like-balance forecasts have earned gains by either having price reach its [B] target or be above its [D] entry cost at the end of a 3-month max-patience holding period limit. [I] gives the net gains-losses of those [L] experiences.
What makes GPRO most attractive in the group at this point in time is its ability to produce earnings most consistently at its present operating balance between share price risk and reward. Credibility of the [E] upside prospect as evidenced in the [I] payoff is shown in [N].
Further Reward~Risk tradeoffs involve using the [H] odds for gains with the 100 – H loss odds as weights for N-conditioned [E] and for [F], for a combined-return score [Q]. The typical position holding period [J] on [Q] provides a figure of merit [fom] ranking measure [R] useful in portfolio position preferencing. Figure 2 is row-ranked on [R] among alternative candidate securities, with GPRO in top rank.
Along with the candidate-specific stocks these selection considerations are provided for the averages of some 3300 stocks for which MM price-range forecasts are available today, and 20 of the best-ranked (by fom) of those forecasts, as well as the forecast for S&P500 Index ETF (SPY) as an equity-market proxy.
As shown in column [T] of figure 2, those levels vary significantly between stocks. What matters is the net gain between investment gains and losses actually achieved following the forecasts, shown in column [I]. The Win Odds of [H] tells what proportion of the Sample RIs of each stock were profitable; 70% by AAPL, 75% by GPRO, and 100% by GOOG. Also contributing is the size of [I], with GPRO 1.5x the size of GOOG and 2x that of AAPL.
Description of the competitors
“GoPro, Inc. develops and sells cameras, mountable and wearable accessories, and subscription services and software in the United States and internationally. The company offers cloud Quik subscription access to editing tools, which allows users to edit photos, videos, and create cinematic stories and videos with footage from any phone or camera. GoPro, Inc. markets and sells its products through retailers and distributors, as well as through its GoPro.com website. The company was formerly known as Woodman Labs, Inc. and changed its name to GoPro, Inc. in February 2014. GoPro, Inc. was founded in 2002 and is headquartered in San Mateo, California.”
Yahoo Finance
“Alphabet Inc. provides various products and platforms in the United States, Europe, the Middle East, Africa, the Asia-Pacific, Canada, and Latin America. It operates through Google Services, Google Cloud, and Other Bets segments. The Google Services segment offers products and services, including ads, Android, Chrome, hardware, Gmail, Google Drive, Google Maps, Google Photos, Google Play, Search, and YouTube. It is also involved in the sale of apps and in-app purchases and digital content in the Google Play store; and Fitbit wearable devices, Google Nest home products, Pixel phones, and other devices, as well as in the provision of YouTube non-advertising services. The Google Cloud segment offers infrastructure, platform, and other services; Google Workspace that include cloud-based collaboration tools for enterprises, such as Gmail, Docs, Drive, Calendar, and Meet; and other services for enterprise customers. The Other Bets segment sells health technology and internet services. The company was founded in 1998 and is headquartered in Mountain View, California.”
Source: Yahoo Finance
Yahoo Finance
“Apple Inc. designs, manufactures, and markets smartphones, personal computers, tablets, wearables, and accessories worldwide. It also sells various related services. In addition, the company offers iPhone, a line of smartphones; Mac, a line of personal computers; iPad, a line of multi-purpose tablets; AirPods Max, an over-ear wireless headphone; and wearables, home, and accessories comprising AirPods, Apple TV, Apple Watch, Beats products, HomePod, and iPod touch. Further, it provides AppleCare support services; cloud services store services; and operates various platforms, including the App Store that allow customers to discover and download applications and digital content, such as books, music, video, games, and podcasts. Additionally, the company offers various services, such as Apple Arcade, a game subscription service; Apple Music, which offers users a curated listening experience with on-demand radio stations; Apple News+, a subscription news and magazine service; Apple TV+, which offers exclusive original content; Apple Card, a co-branded credit card; and Apple Pay, a cashless payment service, as well as licenses its intellectual property. The company serves consumers, and small and mid-sized businesses; and the education, enterprise, and government markets. It distributes third-party applications for its products through the App Store. The company also sells its products through its retail and online stores, and direct sales force; and third-party cellular network carriers, wholesalers, retailers, and resellers. Apple Inc. was incorporated in 1977 and is headquartered in Cupertino, California.”
Source: Yahoo Finance
Yahoo Finance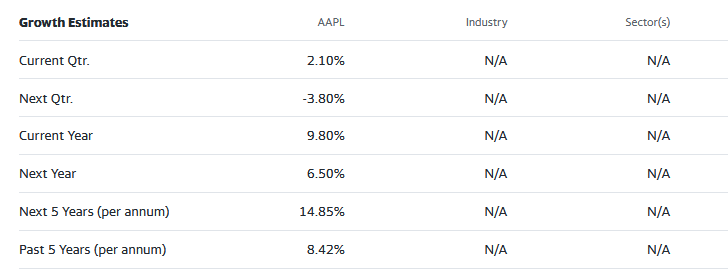
Recent Trends in MM Price-Range Forecasts for AAPL Alternatives
Figure 3
blockdesk.com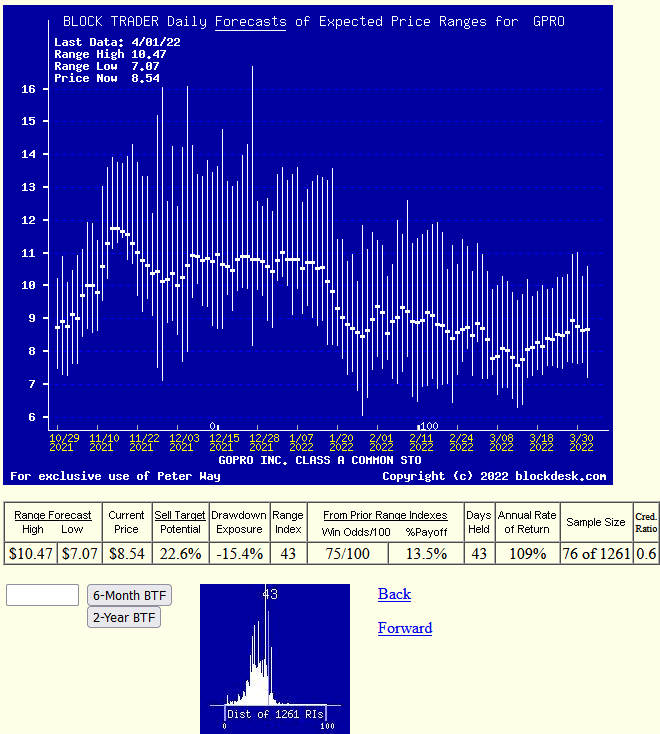
This is NOT a typical “technical analysis CHART” of PAST stock price history. Instead, its vertical lines are a daily-updated visual forecast record of price range limits expected in the coming few weeks and months. The heavy dot in each vertical is the stock’s closing price on the day the forecast was made.
From that point an explicit definition is made of the price reward and risk expectations which were being made at the time, with visual support of the balance between risk and reward. The measure of that balance is the Range Index. Here the RI indicates that 43% of the full forecast range of from $7.07 to $10.47 is downside from $8.54, leaving a slightly larger 57% of the range to the upside.
Having such precise price expectation measures makes it much easier to make direct comparisons between all securities at each point in time, as was done in Figure 1.
The recorded histories of price range forecasts make it possible to understand how well each security performed in subsequent markets. It also reinforces under what Risk~Reward balance circumstances better forecasts were able to be made in the past and as in Figure 2, may be made at present for the future.
Lets’ look at this dimension of GOOG’s Block Trader Forecast picture next.
Figure 4
blockdesk.com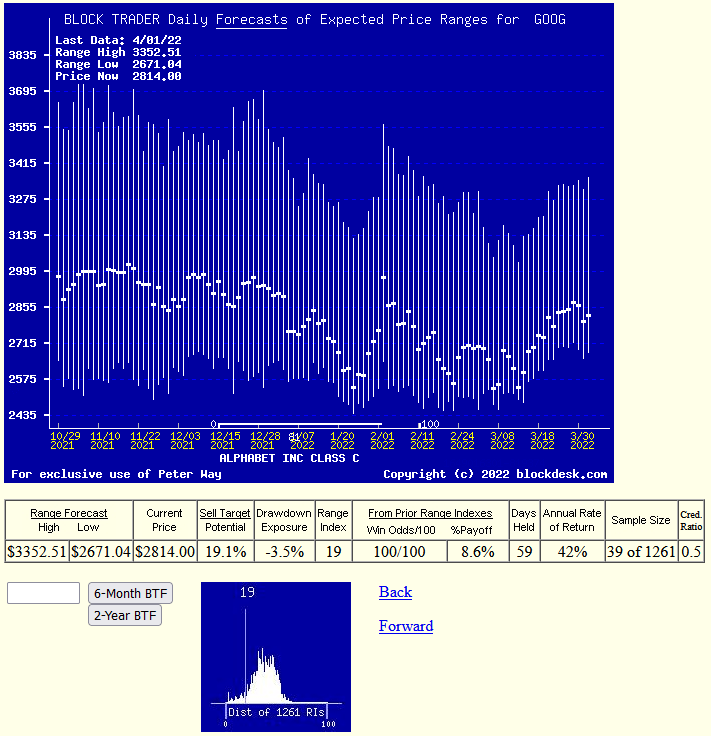
This picture shows a rather unchanging trend of low-end of price range expectations for GOOG during much of the 6 months’ days, up to the last couple of weeks, when it has begun rising. That rise in expectations has paralleled the stock’s price quotes, retaining its low Range Index of 19.
The row of data between the pictures of Figure 4 informs us that when the RI of GOOG is at 19, like it is now and has been 39 times in the past 5 years of 1261 daily forecasts, a buy of the stock produced a profit every time. (100%) What could be better?
Better could be a bigger payoff, sooner, producing a larger Compound Annual Growth Rate [CAGR] for the portfolio. Here the 8.6% average payoffs (no losses) never got to its hoped for price target of $3352, and averaged 59 out of a maximum 63 market days (3 times the average 21 market days in a month).
So only 2 buys reached their targets, and the other 37 were, by the discipline of our standard portfolio management discipline closed out at gains averaging +8.6%, including the two target-winners. If those 2 had targets as large as today’s range-top forecast, the other 37 averaged time-closeouts of only 8%.
When the profit score of GOOG forecasts at RI .19 are calibrated on the CAGR scale, it is an annual rate of +42%. Pretty good, but not as good as GPRO. There 75 of its prior forecasts at today’s RI of 43 produced average gains of 13.6%. Since only 3/4ths of the 75 prior opportunities were profitable, there were 56 winners and 19 losers.
Still, the 75 all told had net gains averaging +13.6% on holdings committed for average times of only 43 market days, or a CAGR rate of +109% even including the losers. If future GPROs can be as productive as priors, it makes good sense to commit capital and time investments to them instead of elsewhere.
Now let’s look at AAPL’s current prospects.
Figure 5
blockdesk.com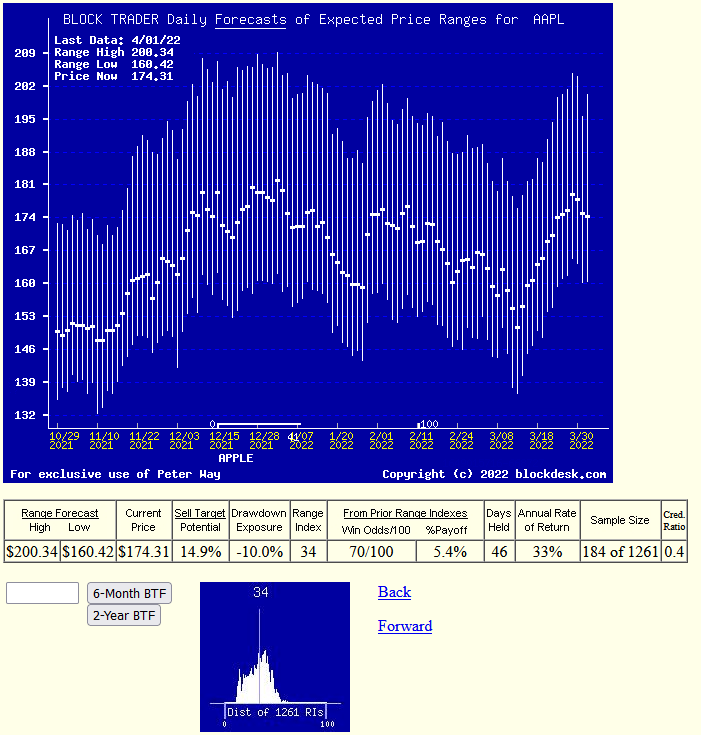
The coaching of Figures 3 and 4 should help observers see whether this is a good time to be buying AAPL or refuse the use of “dead meat”. What has today’s MM price range forecast to say?
Well, if the past experiences for AAPL at prior Range Indexes of 34 turn out to be reality, the CAGR result might be a gain of +33% suggested by 184 priors where 7 out of every 10 were winners and 3 were losers, each spending 46 market days to make their contribution to a 5.4% net gain.
Is a CAGR of +33% a continuation of “dead meat” or “red meat”? Perhaps it depends on what your choices and preferences are.
Is beating the market in a SPY holding over the next 3 months the buy alternative to an AAPL holding, based on each choice’s prior experiences with today’s MM Range Index forecasts? Then AAPL at a 33% CAGR “red meat” looks a lot better than SPY at Figure 2’s data row promise (?) of a +19% CAGR gain rate on today’s MM forecast.
Both GPRO and GOOG make that +33% AAPL CAGR look like a “dead” choice. Yet that decision leaves 3 years and 9 months of further outcomes still open to question, since every day of that period will likely have changes in institutional investors outlooks which may make it advisable to shuffle the deck and deal again.
Conclusion
If the question “is AAPL dead meat today?” is to be answered, then it looks very much that Institutional Investor circles are saying that for the best capital gain opportunity set, a buy of GoPro Inc. as an alternative investment over Apple, Inc. is the next 3-months better choice.
But as to the remainder of the 4-year claim, a further examination for these 3 stocks, including Alphabet Inc., will shortly appear separately.
Be the first to comment