

Herbert Pictures/E+ via Getty Images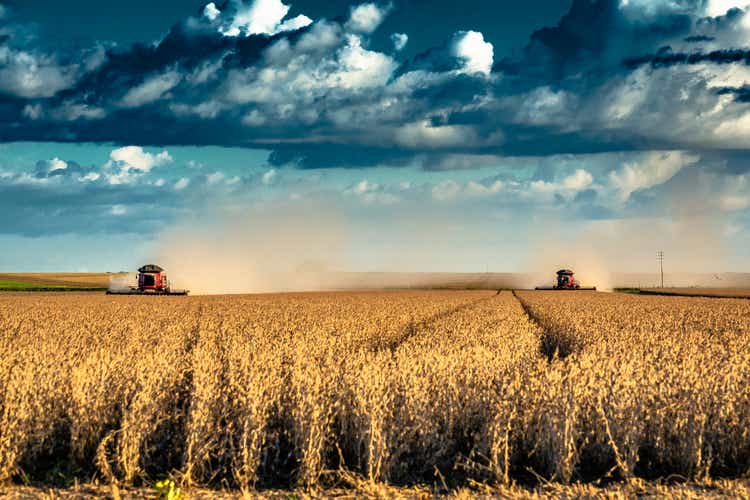
Investment Thesis
Farmland Partners Inc. (NYSE:FPI) provides an easy way for retail investors to invest in a diversified portfolio of farmland properties. As FPI trades close to NAV, buyers can get in without paying a high premium, and they should be able to fully participate in increasing farmland prices once they materialize.
Furthermore, with FPI, investors get some additional leverage to magnify any farmland price appreciation, a small dividend, and exposure to several options that might benefit FPI.
On the flip side, investors will need to share the cashflow from renting out farmland with FPI management and the providers of leverage. Which makes FPI mostly an asset play on long-term value appreciation of farmland.
The case for farmland as an asset class
I recently wrote an article on why I consider farmland an excellent addition to any portfolio. Here are two key tables from that article:
more recent performance of farmland (Oct. 2020 study by Bruce Sherrick, Ph.D, Director of TIAA Center for Farmland Research) farmland return spread vs. CPI (Oct. 2020 study by Bruce Sherrick, Ph.D, Director of TIAA Center for Farmland Research)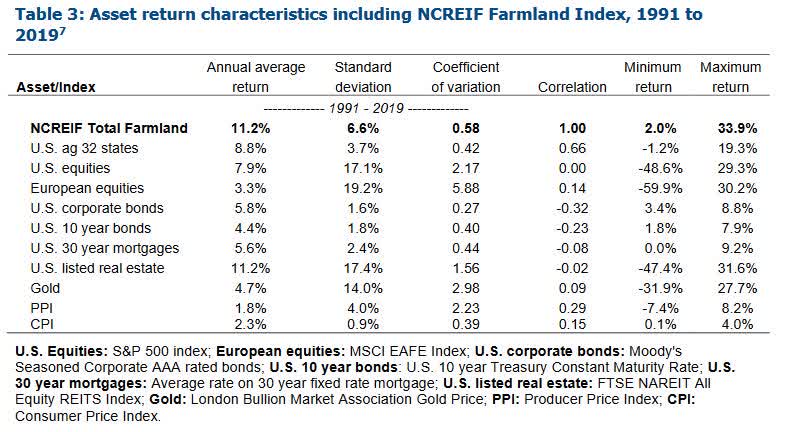
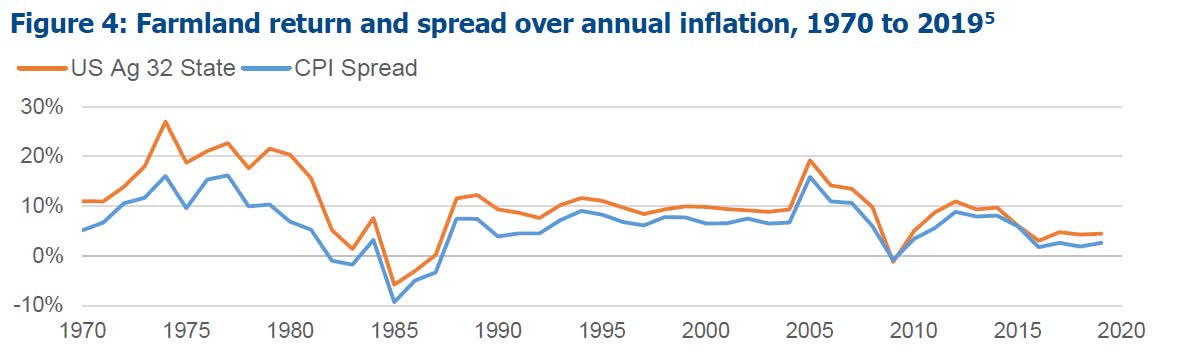
In a nutshell: farmland produces high stand-alone returns, has low downside risk, and low correlation to other asset classes. Therefore, from a portfolio point of view, this is an excellent addition. I consider current trading conditions to be favorable for an investment in farmland after prices have stagnated for several years and just recently started picking up.
For a more in-depth discussion, please refer to my earlier article, as this one will take a positive stance on farmland as an asset class as a given and will focus on FPI.
Why Farmland Partners?
In my prior piece, I argued for a diversified investment in farmland and put forward the case of doing so by investing in farmland REITs. Unfortunately, I know of only two listed REITs that invest in US farmland. Those two REITs are Gladstone Land (LAND) and Farmland Partners (FPI). I recently wrote an article about Gladstone Land where I detailed why I sold my shares. Basically, it was a question of valuation, and as the share price has dropped since then, I start to become more constructive on the name again. However, I invested my sale proceeds from LAND into FPI and I still believe it is the better choice of the two for the time being.
Business Model
FPI’s business model is owning farmland and renting it out to farmers. Here is what their portfolio looks in a nutshell:
FPI at a glance (REITweek investor conference presentation June 2022)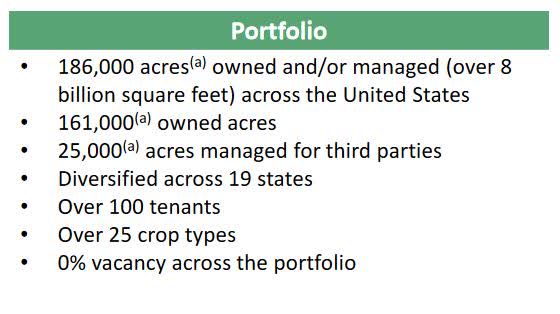
FPI does not generally operate farms itself, although they occasionally do. Therefore, they are normally not exposed to operational risks of running a farm but just collect the rent check. They do have some exposure via some of their rental contracts to how well their farm operators do. And, right now, they do very well. Furthermore they recently took a 9.97% interest in the OZ Fund and acquired “100% of the membership interests of Murray Wise Associates, LLC (“MWA”), an agricultural asset management, brokerage and auction company, for total transaction value of $8.1 million.” Therefore they are now to a small degree active in agricultural asset management. For now I will focus on their REIT operations, which builds the base for my investment thesis.
FPI diversification
Geographically, FPI seems well-diversified at first glance:
FPI’s regional footprint Q1-22 (Q1-22 investor presentation)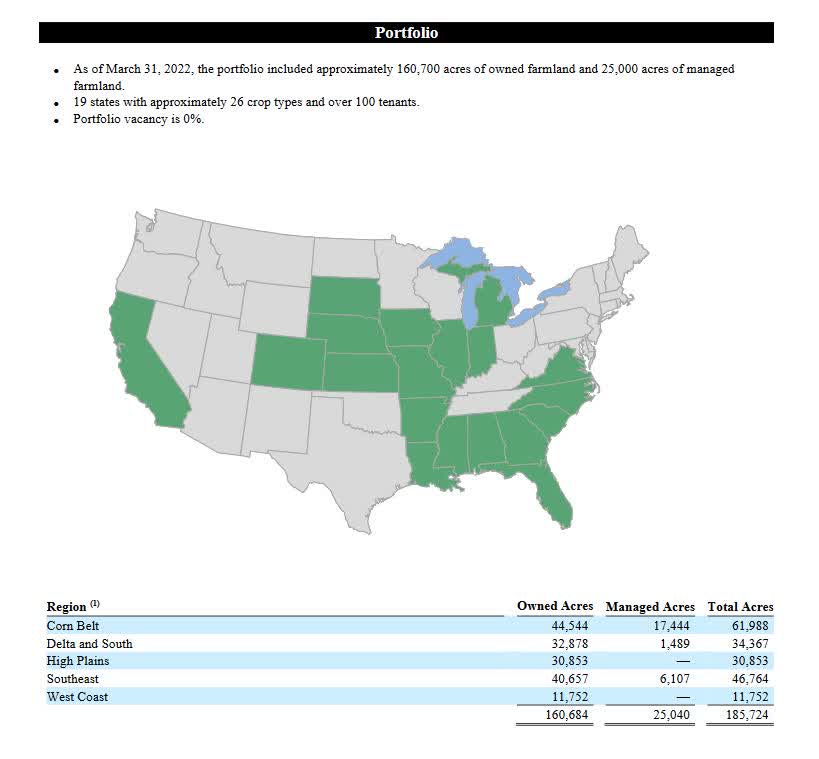
However, looking at acres does not tell the full picture, as land values by state differ materially. Based on their disclosure from their farmland valuation appreciation table, it seems that, by value, about 1/3 is located in Illinois and well over 20% in California (vs. 7% in terms of acres).
FPI’s exposure to Illinois and California (FVA disclosure by FPI August 2021)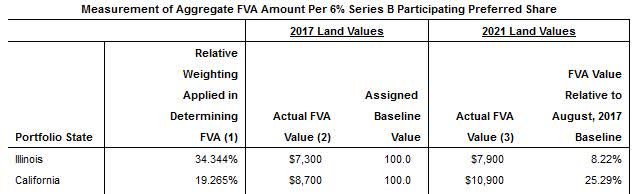
Therefore, FPI is unfortunately less diversified than it initially seems. California has 3-4x the importance that one would assume looking just at acres. In terms of rental income, California has a high weight with 36.9% for 2021 compared to Illinois with 25.5%. The high significance of California is, however, likely partly explained by the better cash yield that permanent crops grown there provide. Still, it could be that California is closer to a third than a quarter of the overall portfolio value, which is something I would personally like to see lower given the reports on droughts in California.
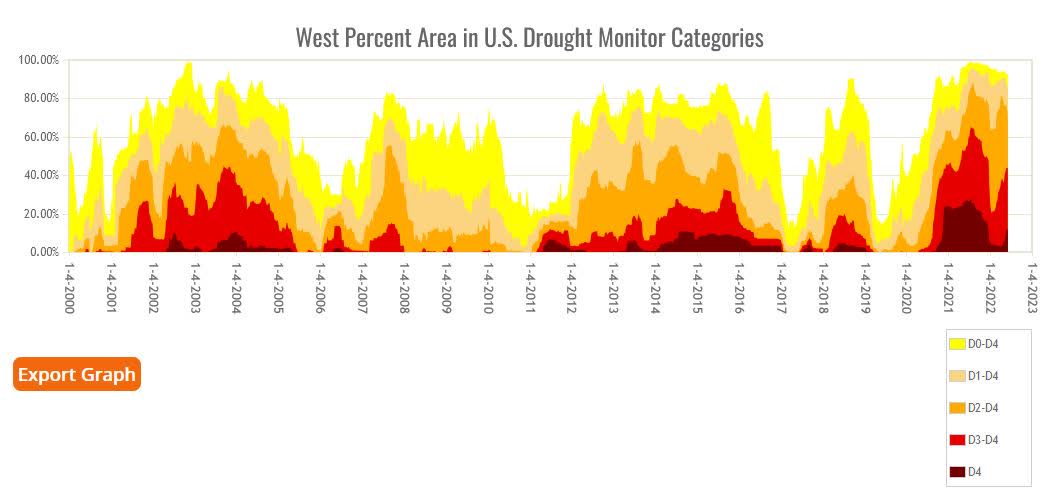
California hard hit by drought (US drought monitor) History of droughts western region (US drought monitor)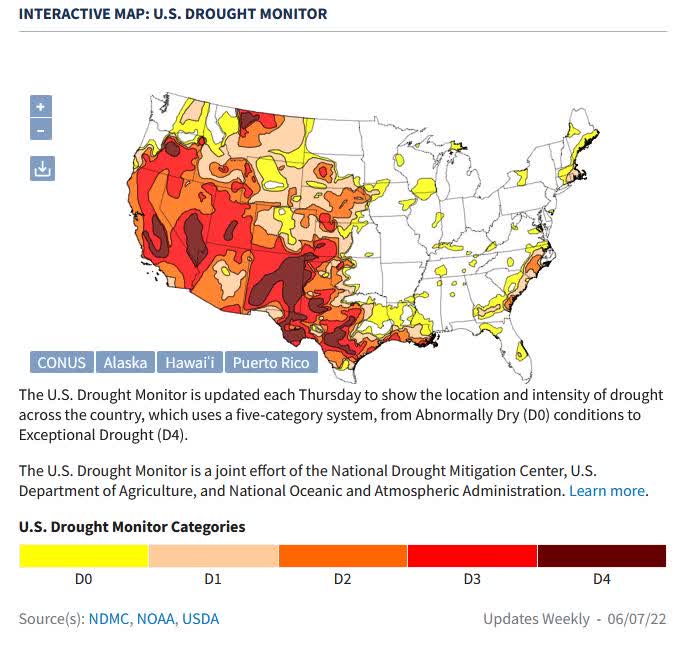
The State of California warns of a new normal:
California: drought the new normal? (State of California)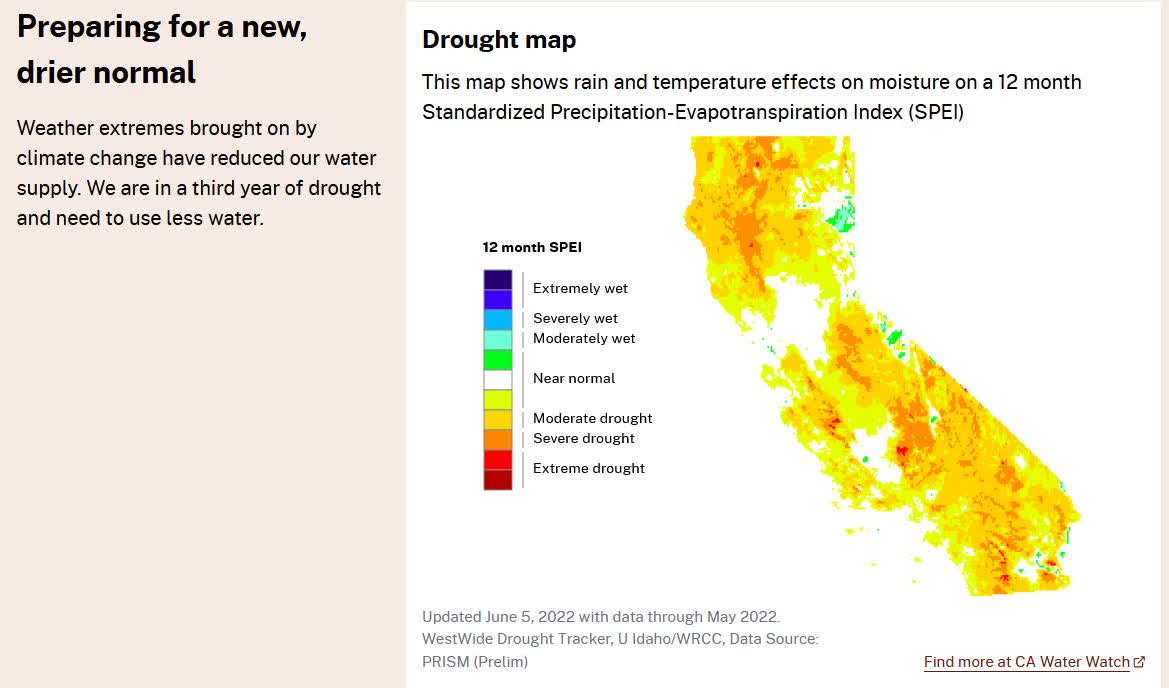
Illinois had its bad years, like 2012, but certainly looks better in recent years:
Illinois drought history (Illinois State drought monitor)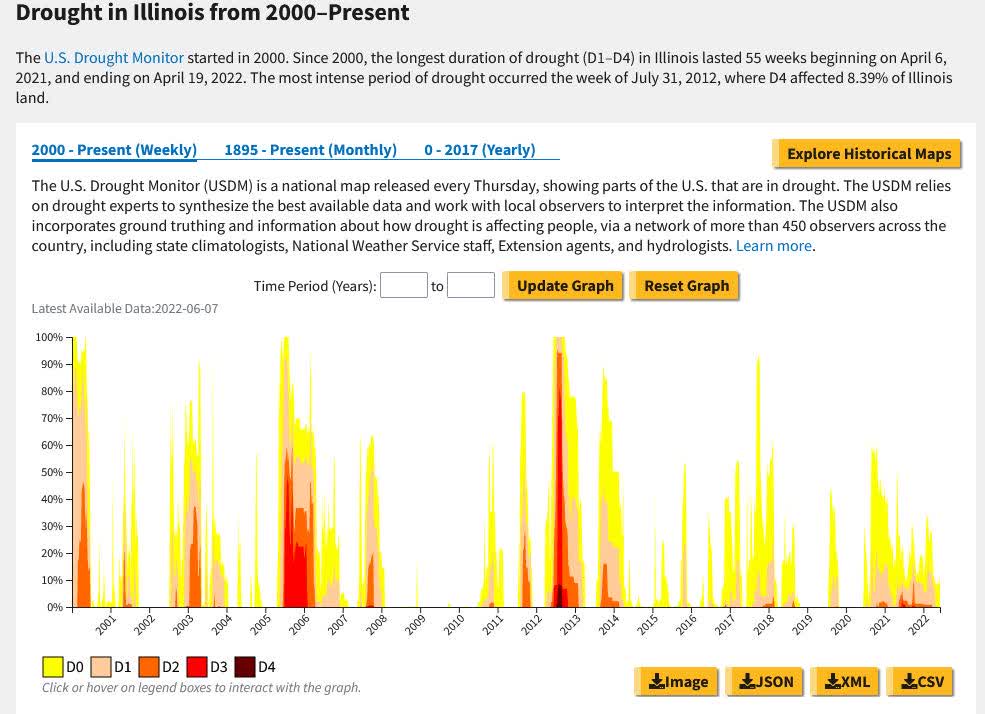
Besides the drought issues, Californian land prices have been increasing nicely in recent years, as opposed to overall cropland prices in the U.S., which have been mostly stagnant from 2015 to 2020. Therefore, I feel there is more catch up potential with non-Californian farmland. That said, California and Illinois are both premier agricultural states.
Besides geography, diversification by produce and tenants is very important. As they state in their presentation, FPI has over 100 tenants, and they grow about 26 different crop types. About 70% of that by value is primary crop like wheat or corn and 30% is specialty crop like citrus and tree nuts. One distinguishing feature between those two types is that, with specialty crops, often a large value is captured by the so-called permanent plantings. Unfortunately, despite their name, those plantings are far from permanent. On the contrary, they generally have an economic life of 15-25 years depending on the specific plantings, which means they need some replacement eventually at a fairly high cost. Therefore, unlike farmland, they are wasting assets that should mostly be ignored when looking at land appreciation. Luckily, for FPI permanent plantings make up only about 5% of their real estate values on the balance sheet.
While primary crops are normally on very short (2-3 years) leases, permanent crops tend to be on longer ones ( up to 7+ years). In the current benign environment for annual row crops, I do regard FPI’s strong positioning in mainly primary crops as a positive. Their average rental contract on these is about 3 years, and they are seeing sizeable rent increases, which will filter through their results over the next three years. In their Q4-21 conference call, they said that their rent increases on contracts that they renewed in 2021 was 10.5%, and 2022 should be even higher, with initial indications showing 15-20% increases.
Financial and Operational Leverage
10-20% increases on 1/3 of 70% of their portfolio per year translates into a 2-3% increase in rent per year for the next few years, which does not sound all that impressive. However this ignores operational and financial leverage. As the rent increases won’t directly increase FPI’s costs, they fall mostly through to the bottom line. As we can see, operating and financial leverage is fairly high at FPI, as administrative costs and interest payments take up a large part of revenues.
FPI earnings table (FPI Q4-2021 earnings presentation)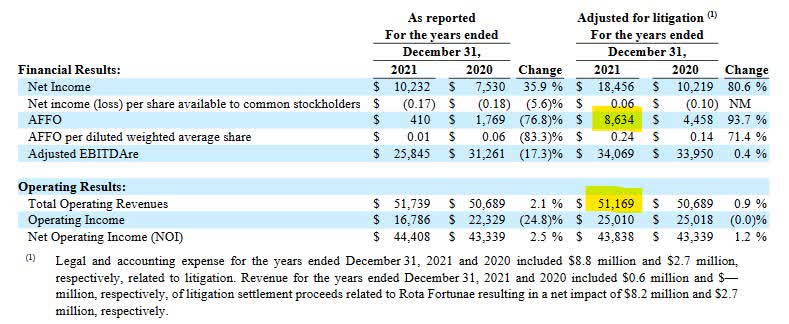
Therefore, AFFO margin is only about 17% which on the other hand means that any 1% increase in revenue increases AFFO by roughly 6%, everything else being equal. If we run the numbers with a 2.5% increase in revenue, we would get about a 15% increase in AFFO. This is roughly in line with estimates by analysts, which go up to $0.39 by 2024 in an accelerated growth pattern. Management also showed confidence by increasing their dividend by 20% starting with the July quarter. Furthermore, FPI wants to grow more aggressively again which should lead to increased operational efficiency as their cost base gets spread over a larger asset base.
Valuation and NAV
Unlike Gladstone Land, FPI does not provide updated valuations of its properties. It lists them at cost on its balance sheet. Book Value is currently around $10.50/share. However land values have been rising recently. And, while FPI does not provide an updated NAV, they did provide a calculation of a “farmland value appreciation” factor based on USDA data for their preference shares last year. This pointed to a farmland price increase over their 2017 values of 12.3%. That value is based on their portfolio composition in 2017 and also based on general USDA data, and not a property-by-property valuation. But I think it should give a decent idea of how FPI’s land values have been developing over the last 4 years.
As this was based on the USDA data from August, which is normally based on mid-year surveys, there has since been another 10 months of good farmland price performance. Here is what the NAV/share should look like based on different land values (without improvements or buildings) compared to their cost base:
FPI NAV calculation based on land appreciation (own calculations based on Q1-2022 10-Q data)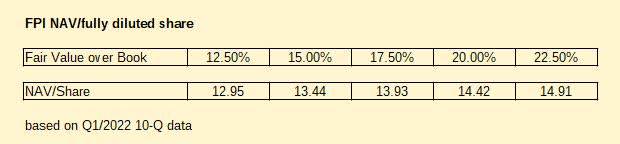
I see 12.5% appreciation as a floor based on their farmland valuation appreciation data, and believe we could be another 7%+ higher by now. Therefore, I estimate that current NAV should be in the $14-15 range, which is roughly where the stock currently trades.
How has FPI been trading vs. NAV and what should it trade at? Let’s look at its trading history:
FPI share price (Seeking Alpha)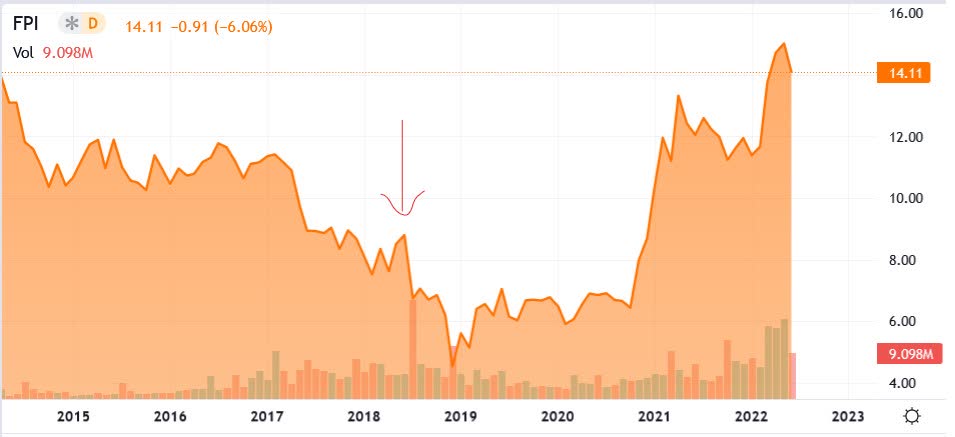
As one can see, they went public in 2014 in a typical procyclical manner during the big runup in farmland prices, and started trading around $11 for several years as farmland prices started to stagnate. My best guess would be that it was trading slightly above NAV during that time, as book value increased from $8.83 in 2014 to $9.81 by 2017 (SA data). They were buying a lot of land during that time, increasing real estate assets on their balance sheet from $166m in 2014 to $1,092m in 2017. As prices mostly stagnated during that time period, book value should be a reasonable proxy for NAV, as it reflects their purchase price. During 2017, price dropped a bit to a slight discount to NAV but the really big and massive drop with huge volumes occurred mid 2018. What happened?
In July 2018 an author called “Rota Fortunae” published a negative piece about FPI at Seeking Alpha claiming that FPI had a high risk of insolvency. This led to a massive drop in FPI’s share price. FPI launched a strong defense and it eventually turned out that this article was part of a short-and-distort attack.
Unfortunately for FPI, this had a lingering effect on their share price. FPI was sued in a class action lawsuit and also sued the author and the alleged people behind it. This led to high legal costs for years, as evidenced in the results table I showed above with legal costs basically eliminating all of their AFFO in 2021. The low share price also impacted their ability to grow, as they could only raise equity capital at a discount to NAV, which would not make sense. Therefore, unresolved legal issues with high costs and the lack of being able to raise growth equity at reasonable terms created a constant overhang over FPI’s shares and had them trading at a massive discount to NAV. This, however, started to reverse by mid-last-year, with the above linked admission of wrong-doing by Rota Fortunae.
In May 2022, FPI was finally able to successfully dismiss the class action lawsuit brought against them:
“This class action litigation has hung over our Company for a long time, forcing us to spend considerable resources to defend ourselves from baseless accusations,” said FPI Chairman and CEO Paul Pittman. “Today, we can finally close this chapter and move on to doing what we do best – investing in high-quality farmland across the country and delivering for our shareholders.”
Therefore, a large overhang that had depressed FPI’s valuation has finally vanished. Another defining event in 2021 was the conversion of high cost preference shares. This led to a strong decrease in interest costs for FPI.
Thus, over the last year, FPI has seen a strongly improving operating environment for farmers, increases in farmland prices, was able to successfully resolve its legal issues, and restructured its balance sheet by eliminating a high cost series of preference shares. This all lead to a rerating of FPI, as evidenced in the above price chart.
I think this also means that it is very unlikely that FPI will trade at a similar discount to NAV like it has been doing after the short attack anytime soon. If anything, it could go back to trading at some premium given the positive operational backdrop, which is similar to what persisted during the early years after the IPO.
Return Potential
What returns can you expect from holding FPI?
Assuming a stable P/NAV, one should expect a return equal to the increase in NAV/share plus the dividend. Historically, Farmland has produced annual price gains of 5-7% with cash rental income of 3-5%. Luckily, NAV/share growth for FPI is amplified by the use of leverage. In their Q1/22 conference call, they indicated that they intend to de-lever a bit going forward. Assuming a 40% leverage ratio, a 6% increase in farmland value would equate to a 10% increase in respective equity value.
Therefore I believe we can expect a roughly 10% increase in NAV/share longer term. Unfortunately, while leverage increases the NAV/share, it also detracts from cashflow due to interest payments. The same is true for the costs of running FPI. Both taken together take out a large chunk of the cashflow that the underlying assets provide. Which is why, when looked at from a cashflow perspective, FPI trades at an extremely high valuation. Its current dividend yield is currently 1.7%, and I believe that is pretty much what one can expect going forward. As I show below, that cashflow might even come under pressure due to higher debt costs. Which leaves us with a roughly 11-12% return opportunity. Personally, I am happy with that for an investment that provides both high diversification benefits as well as a bit of current income.
While satisfying, it is not really outstanding. I do, however, believe that we might see an even better performance over the next few years. This is due to three levers:
1. I believe we are in the midst of a very strong upcycle for agricultural products and land values. After several years of stagnation, I think we are likely to see above-average value increases as land values play catch-up.
2. I think there is a good chance of an expanding P/NAV multiple for FPI as investors wake up to the positive story of FPI.
3. There is optionality embedded in FPI’s share price from several angles, which I will quickly lay out below
Overall, I can see 15%+ annual return potential for FPI over the next few years should some of those levers come true.
Optionality within FPI
I see four different areas that could provide additional upside to FPI investors. Here they are in order of likely magnitude:
1. Legal cost reimbursement plus potential damages. FPI has currently sued the hedge fund they claim was behind the short-and-distort attack. If they are successful, that could provide a sizeable inflow of cash, especially if they can successfully claim damages in addition to legal cost reimbursement.
2. Usage of acreage for renewable energy. According to FPI, about 20,000 acres are under review for this kind of usage, which could provide a sizeable uplift to rental income. In April, they sold a farm to a solar power developer for a staggering 132% gain.
3. With the acquisition of Murray Wise Associates, LLC, they now also dabble in farm-related asset management. This can provide some asset light income streams. It is hard to judge how big that opportunity can really grow, but it is certainly an interesting side story.
4. FPI might be embarking on a positive feedback loop of issuing shares at a premium to NAV and thus growing NAV/share and AFFO/share stronger than would have been otherwise possible on an underlying basis, leading to a higher premium to NAV leading again to better growth. And those two positive effects together creating a virtuous cycle could have a massive (and I mean really massive – just look at LAND’s performance! I described the mechanism in a bit more detail in that article) impact on FPI share price performance.
Risks
Interest rates
I consider rising rates as the top risk to my investment thesis.
As my main investment case rests on land values increasing over time, the biggest risk is that this doesn’t happen. In theory, higher rates should reduce the value of farmland as a long duration, income producing asset. However, as farmland has not participated in the valuation increase due to quantitative easing that most other assets had, and given the currently very benign operational backdrop, I view the risk of a major downward pressure on land prices as low.
Secondly, increasing rates will lead to higher interest payments. Here is FPI’s debt data:
FPI debt (FPI year end 2021 data) FPI debt structure in more detail (8-k 2022) FPI maturity schedule (FPI year end 2021 data)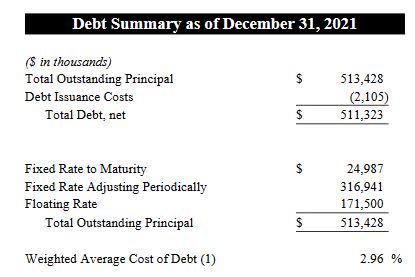
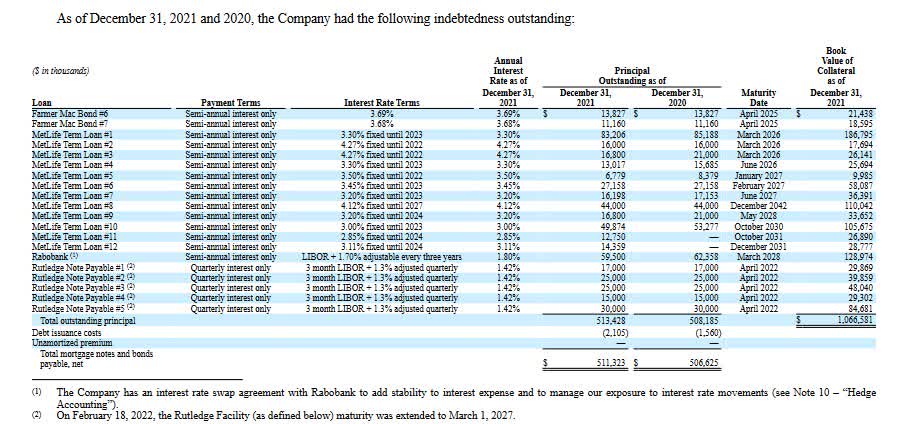
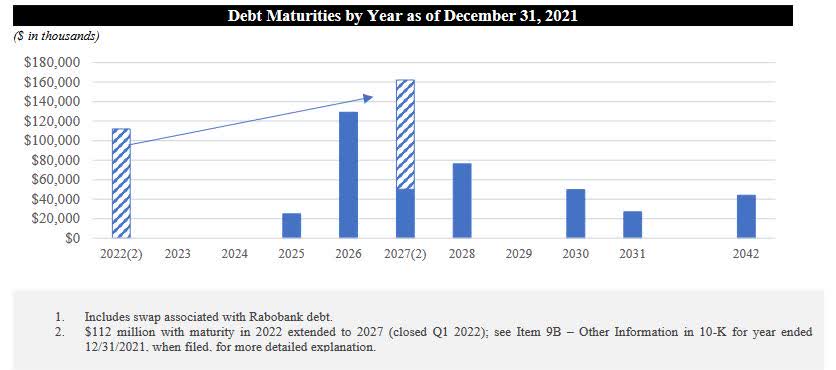
Since then, they have repaid some of their debt, but as we can see, they have both floating as well as regularly resetting fixed rate debt. Most of their debt will reset one way or another over the next 2-3 years. As the Fed increases rates aggressively, one should expect this to filter through FPI’s financial statements. At $500m of debt, just one percentage point of higher interest cost would mean $5m more in interest that is not available to shareholders.
Given that they had only $51m in revenue and less than $9m in AFFO, this could lead to some nasty surprises on AFFO. Furthermore, if annual row crop farmland yields 3-4% in cash rents, we might soon have a situation where using leverage will actually have a detrimental effect on cashflows left over for shareholders (given that cost of debt is already close to 3% for FPI). This might very well counteract the increased operational efficiency from increasing rents and a larger asset base. Which is exactly why I view FPI as an asset play but not really as an investment based primarily on cashflows, because I fear they might be more under pressure going forward than analysts might assume.
Conflicts of interest
Owning a business that manages farmland for clients (MWA), and being an investor in farmland themselves, might lead to potential conflicts of interest and/or related party transactions. Management has to be careful to properly distinguish between the different interests involved when they decide on what land to buy for whom.
Lack of Stewardship Diminishing Land Values
FPI rents out land to farmers on short leases. This might lead to farmers not really caring about keeping the quality of the land intact, as it isn’t theirs and they might not even continue to use it going forward. Luckily, FPI just published a survey on their farmers, and the results are very positive. If they are truthful is another question, given that the farmers answered to their landlord, and by openly stating that they do not care about the land they might jeopardize that relationship.
Investment Thesis Recap
FPI provides diversified exposure to farmland in the U.S. At current price, investors can get in without paying a premium to the underlying value of its land holdings. While the sizeable leverage detracts from the available cashflows, it amplifies potential land appreciation gains, which is my main goal of an investment in FPI.
Main risks are rising rates, as those might negatively impact farmland values short term. Rising interest cost will pressure cashflows and might lead to negative leverage in terms of cashflow when acquiring new farms. Furthermore, the addition of asset management services gives rise to potential conflicts of interest.
Be the first to comment