

Pavlo Sukharchuk/iStock via Getty Images
Thesis
The thesis of this article is to argue for a pair trade idea: Buy Advanced Micro Devices (NASDAQ:AMD) and sell Nvidia (NASDAQ:NVDA). First and foremost, let me clarify that the thesis is a tactical, i.e., short-term trade idea. In the long term, I am optimistic about both companies given the world’s unstoppable trend toward digitalization and automation.
Both stocks are highly cyclical and respond sensitively to economic downturns as you can see from the following chart. Both AMD and NVDA stock prices have suffered an almost 50% loss YTD (48.8% for AMD and 50.6% for NVDA), against the backdrop of a 19.4% correction for the S&P 500. Admittedly, both stocks have been valued in a bubbling regime earlier in the year and a correction is inevitable. AMD’s peak valuation reached 58x P/E toward the end of 2021, and NVDA even higher, almost 90x.
Now, with an almost 50% correction, both of their valuations have become more reasonable. At the same time, both businesses boast a strong product lineup to be detailed next and are both well-poised for robust growth. I have no doubt about a stock price rebound driven by profit growth and also some valuation recovery. However, in the near term, I foresee AMD to have the potential for a stronger rebound than NVDA for several reasons. AMD’s valuation is substantially more compressed, especially in terms of owners’ earnings, while AMD’s profitability is very competitive compared to NVDA and the demands for CPUs are less volatile than GPUs.
Seeking Alpha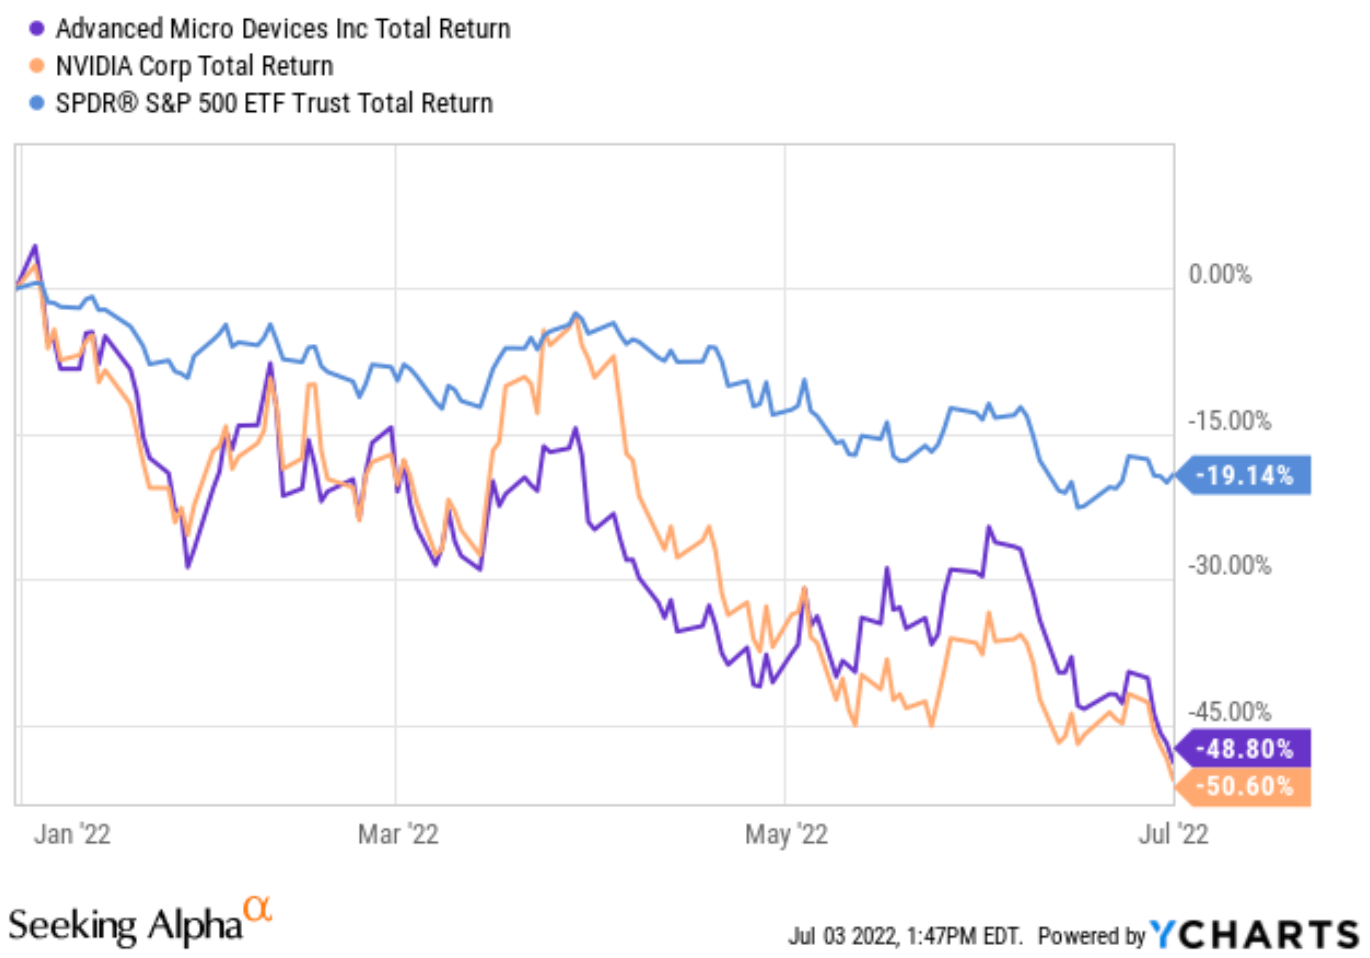
R&D and product lineup
Both companies invest strongly in their research and development efforts, and both of them boast a strong product lineup. As you can see from the following chart, the R&D expenses for AMD have been on average 21.3% of total revenues in the past five years. And the expenses have fluctuated only in a narrow range from about 17.3% to 25.3%. The picture for NVDA is similar, its R&D expenses have been on average 21.5% of total revenues, essentially identical to AMD. And the expenses have also been consistent and fluctuated only in a similarly narrow range.
Thanks to their aggressive R&D efforts, both companies enjoy a strong market position with leading products. AMD gained performance leadership with its Zen2 architecture in the CPU market and widened the leadership position further with the Zen3 and RDNA2 AMD technologies. Looking forward, the recent Xilinx acquisition will further augment its strength and expand its addressable market. And it has also introduced the new AM5 platform, and I expect it to consolidate AMD’s position for the next few years (like what AM4 did in the past 4~5 years).
NVDA’s product lineup is equally strong. Its current offerings like the GeForce RTX 3050 desktop GPU and GeForce RTX 3080 enjoy robust sales and high margin. Looking forward, the company is betting aggressively on the AI future. Indeed, the potential addressable AI market is tremendous, and estimates are in the $150B range in the next few years. A key argument NVDA makes for the AI future is the need to shift the datacenter (which consumes an astounding amount of electricity these days) from the current CPUs to more energy-efficient CPUs. And one of its key technologies here is codenamed Grace based on ARM architecture. As NVDA CFO Colette Kress commented (the emphases were added by me):
Building on the H100 product side, we are on track to launch our first ever Data Center CPU, Grace, in the first half of 2023. Grace is the ideal CPU for AI factories. This week at COMPUTEX, we announced that dozens of server models based on Grace will be brought to market by the first wave of system builders, including ASUS, Foxconn, Gigabyte, QCT, Supermicro and Wiwynn. These servers will be powered by the NVIDIA Grace CPU Super Chip, which features two CPUs and the Grace Upper Super Chip, which pairs an NVIDIA Hopper GPU with an NVIDIA Grace CPU in an integrated model.
These leading technologies have created consistent and enviable profitability for both companies as we will see next.
Seeking Alpha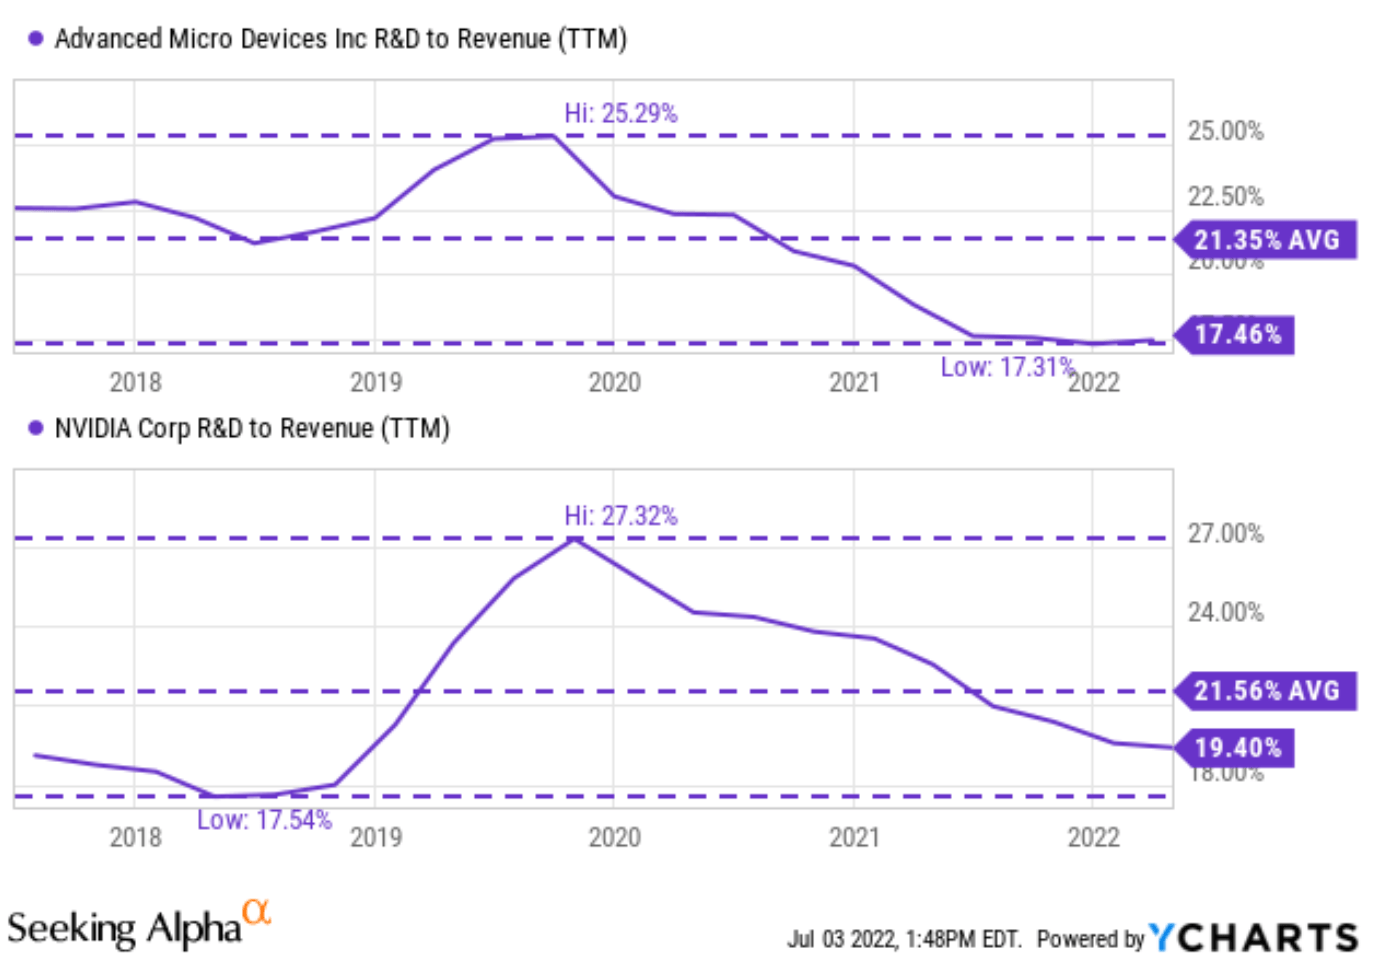
Profitability comparison
As you can see from the following chart, both enjoy strong profitability. And by these metrics, you may form the impression that NVDA obviously is the more profitable one here. For example, to cite a few key metrics, NVDA enjoys a gross margin of 65%, almost a whopping 15% lead over AMD. In terms of net margin, NVDA also enjoys a huge lead here. Its net margin of 32.0% is almost 2x of AMD’s 17.9%.
Seeking Alpha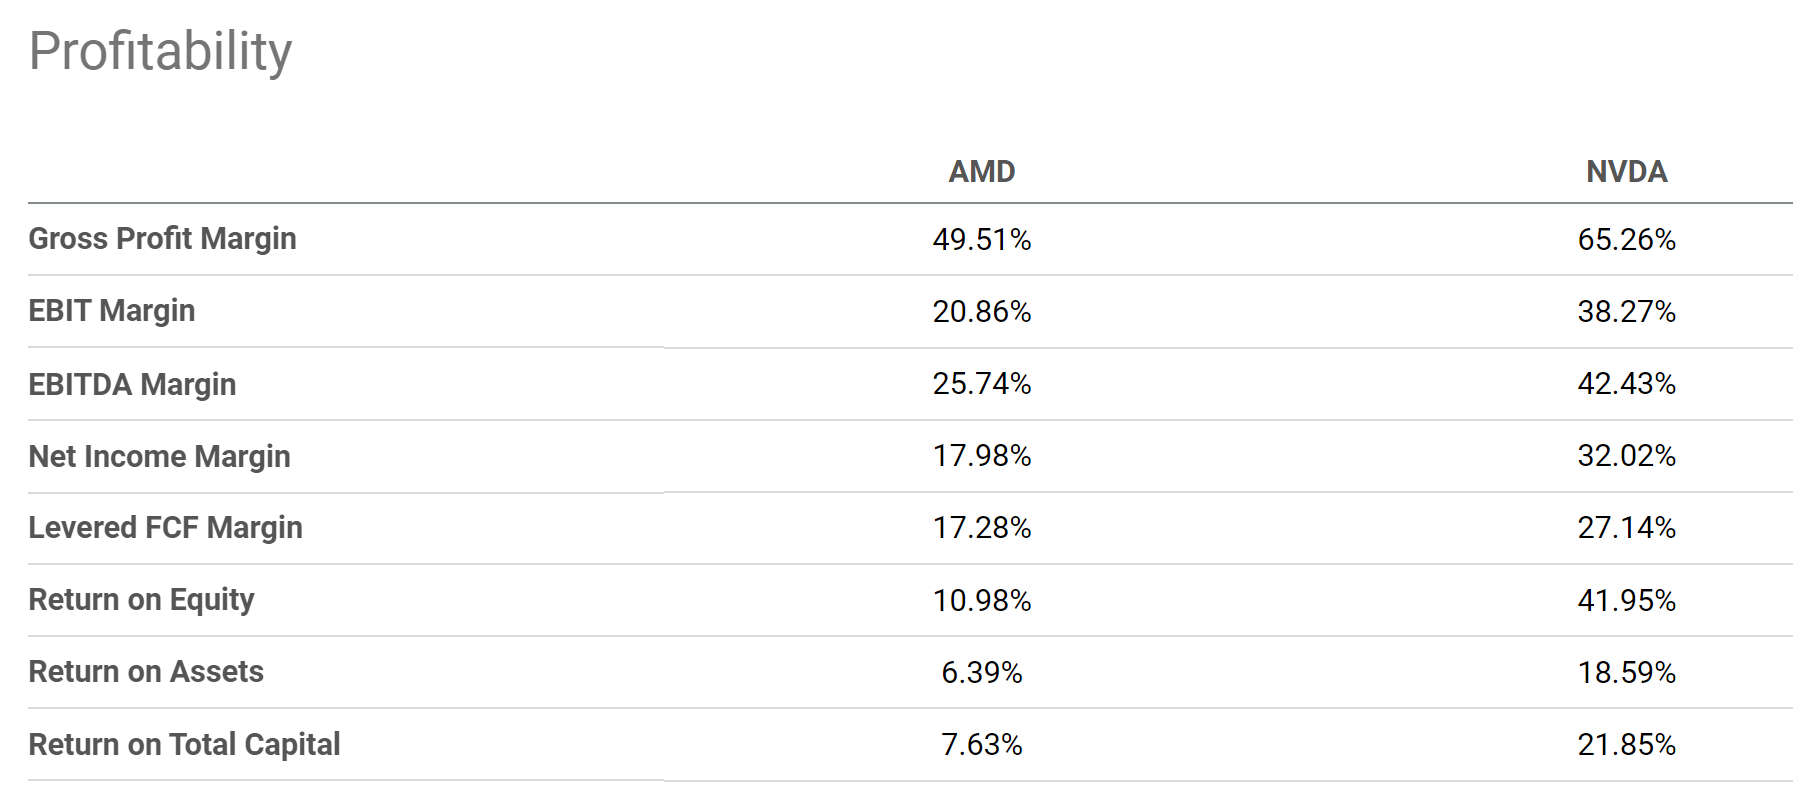
However, in addition to this snapshot of various metrics, I’d like to draw your attention to the next chart, which shows a more fundamental profitability measure, the return on capital employed (“ROCE”). The chart also provides data over a longer period of time to provide a broader view. And as explained in our earlier writings, to us, the most important profitability measure is ROCE because it considers the return of capital ACTUALLY employed.
As seen, the ROCE comparison paints a different picture. NVDA’s ROCE has been on average 60% in the recent 3 years. Its ROCE peaked in the 70% to 80% range around 2017.
In comparison, AMD’s ROCE has been on a robust upward trajectory. It started from an unprofitable level around 2012 and has been on a stable climb since then. Currently, its ROCE hovers around almost 50%, about 10% below NVDA. Looking forward, I see several catalysts to further expand its margin and ROCE. As aforementioned, the recent Xilinx acquisition further expands its addressable market such as Versal HBM adaptive SOCs, FPGA-as-a-Service, 5G, et al. Its higher-margin offerings have also demonstrated robust momentum, such as the EPYC, Radeon, and Ryzen lines.
Author based on Seeking Alpha data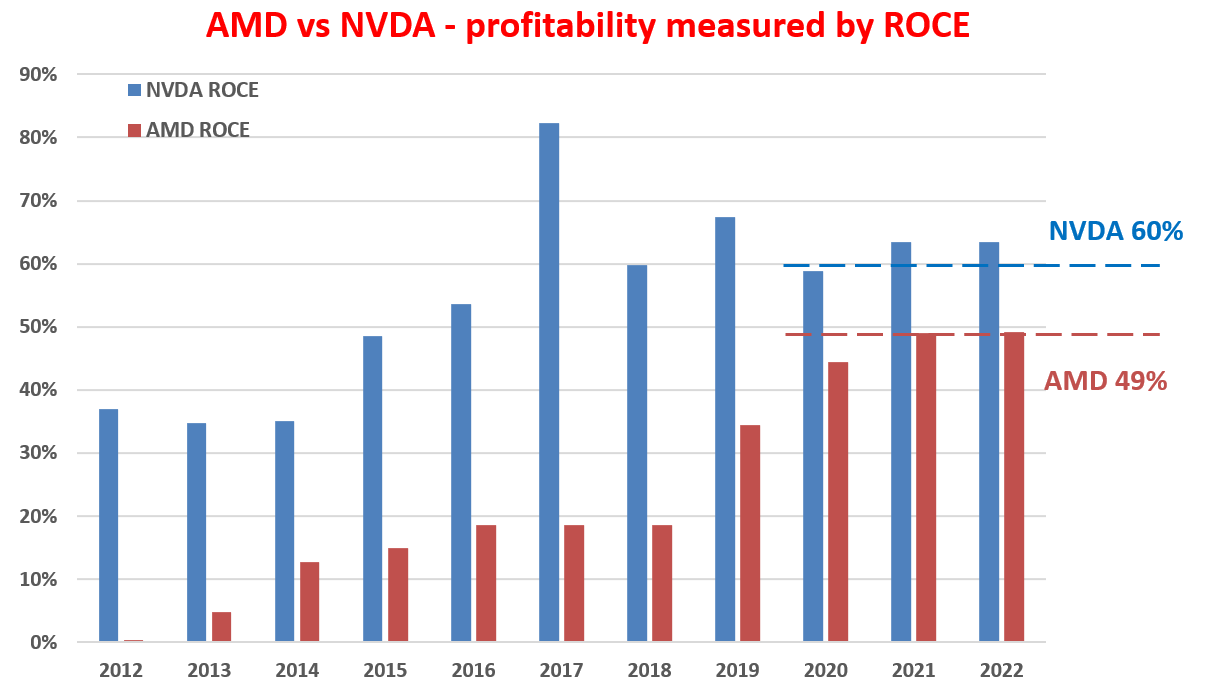
Valuation comparison
Despite the above converging ROCE gap, NVDA is currently trading at a substantial premium over AMD as you can see from the second chart. Its FY1 P/E of 26.7x is almost 60% higher than AMD’s 16.8x. The contrast in topline metrics such as price to sales or EV/sales ratios are even more dramatic. NVDA’s Price /sales ratio is 10.4x, more than 2.3 times higher than AMD’s 4.37x. Its EV/sales ratio is about twice higher than AMD (12.0x vs 6.0x).
For high-growth stocks like AMD and NVDA, a more insightful valuation metric is based on the so-called owners’ earnings instead of the accounting earnings. Because a large part of their CAPEX expenditures are targeted for growth and therefore can be considered optional. Once the discrepancy between the owners’ earnings and accounting earnings are adjusted for, AMD’s valuation becomes even more attractive. As detailed in my earlier article, AMD’s reported accounting EPS is about $0.4 per share last quarter, while its owners’ earnings is about $0.85 per share, more than 2x higher.
Admittedly, NVDA’s owners’ earnings are also significantly higher than its accounting EPS, but not as much as AMD. Our analysis shows that its owners’ earnings are about 1.7x of its accounting EPS.
Seeking Alpha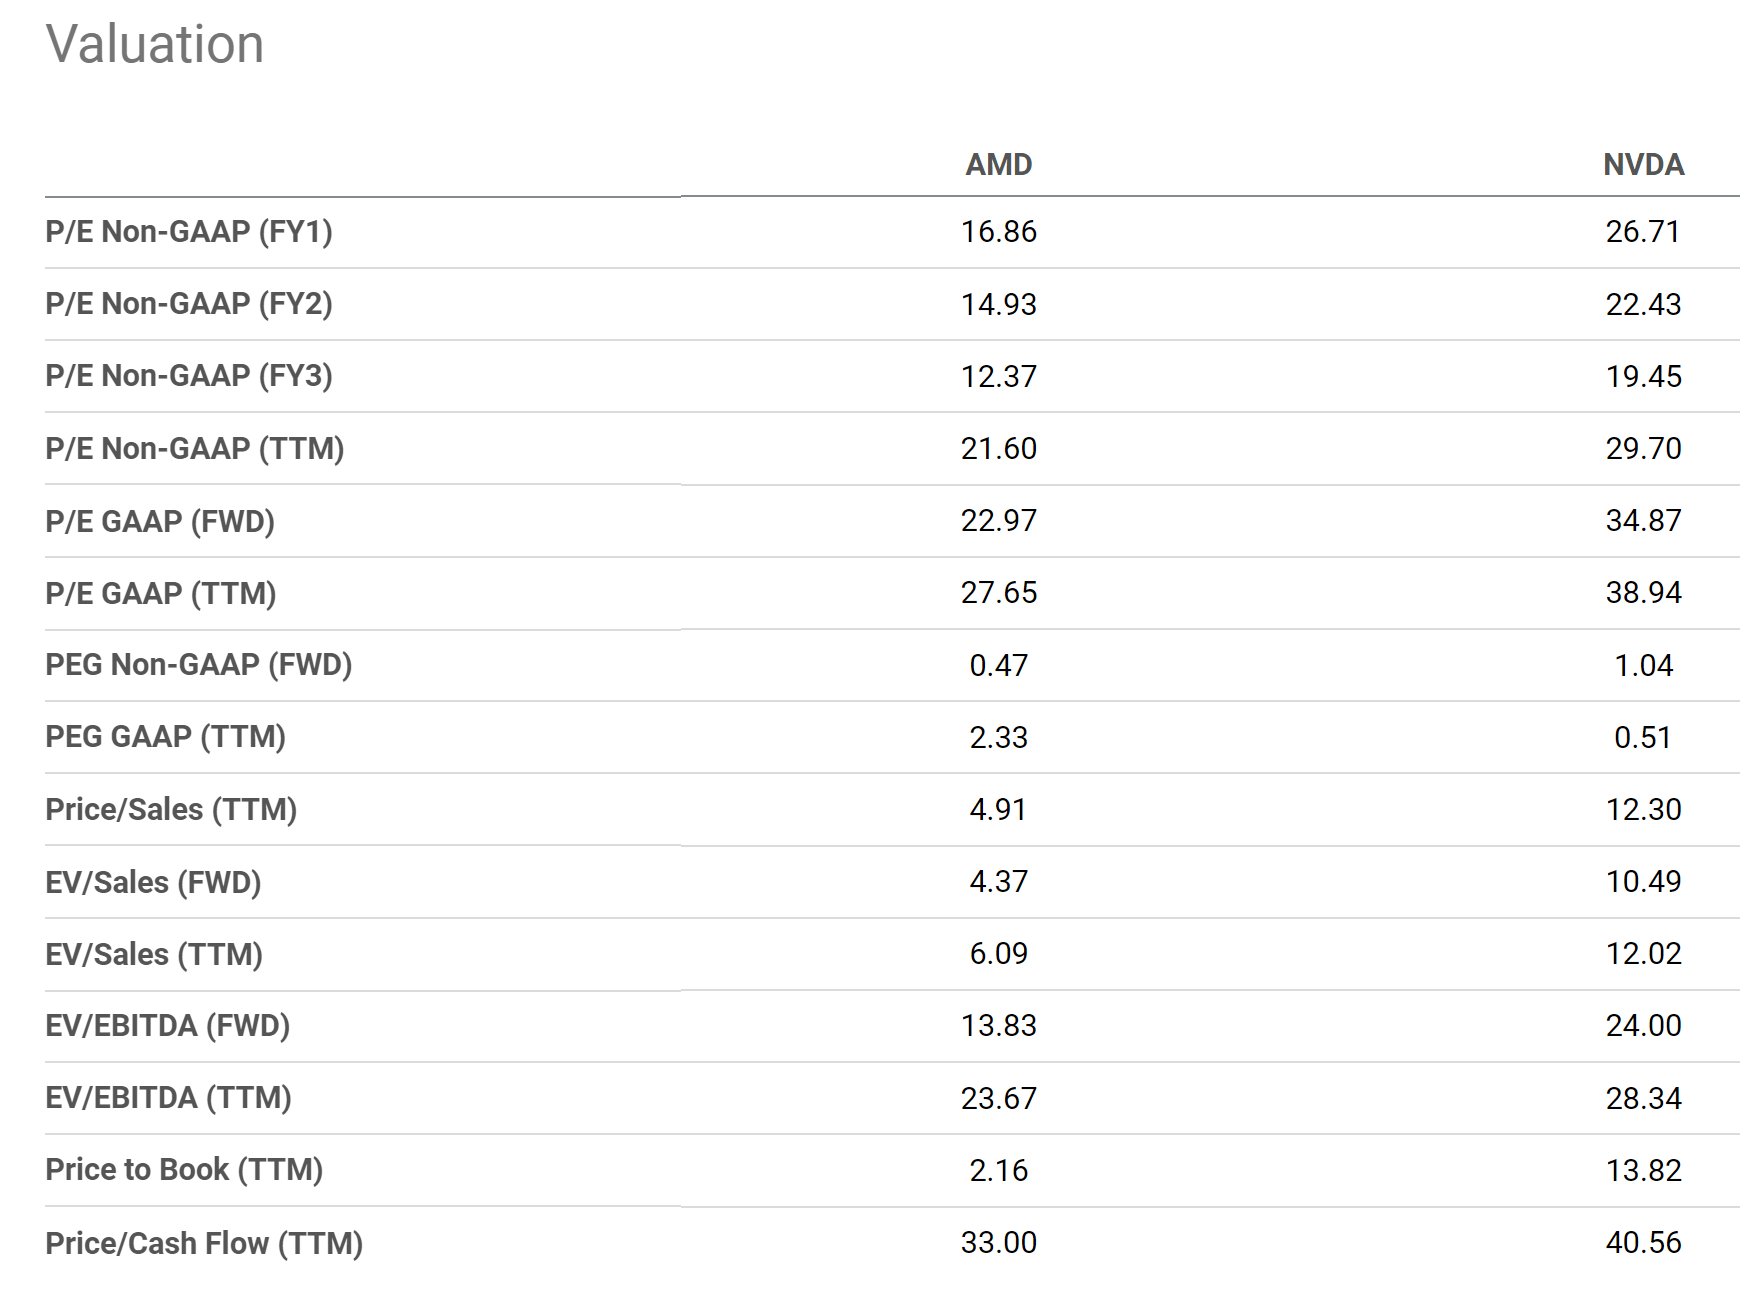
Final thoughts and risks
This article describes a tactical pair trade idea: buy AMD and sell NVDA. The stock market tends to completely ignore business fundamentals at both the fear and greed extremes. Both stocks were valued in a bubble regime earlier in the year with AMD P/E peaking around 58x P/E and NVDA almost 90x. Now, with an almost 50% correction, both are more reasonably valued. And our view is that AMD is even more so, while NVDA’s valuation is still at a premium both in absolute terms and especially in relative terms. As a result, I foresee AMD stock price stage a stronger rebound than NVDA.
Besides the above valuation consideration, I will see the demand for CPUs as less volatile than GPUs. For example, NVDA’s stock prices and earnings are sensitive to bitcoin mining, which is completely unpredictable in my view. As commented in our earlier article,
NVDA and crypto mining have demonstrated positive correlations in the past. The correlation is not only in terms of prices (which largely reflect market psychology) and also in terms of earnings (which reflect business fundamentals). In investing, both are important. Currently, the correlation is at a very high level of 0.875 in terms of prices and 0.722 in terms of EPS. To me, these data signal that NVDA still derives a large portion of its earnings from crypto mining either directly or indirectly, and the turmoil in cryptocurrency will keep pressuring both its stock prices and profits.
There are risks to AMD too. Many of the risks are common to both AMD and NVDA (and other chip stocks too) such as the ongoing interruptions of the global supply chain, COVID-induced lockdowns, et al. Although I see AMD faces more competitive pressure. Its CPUs business directly competes with Intel and Intel currently still dominates the CPU market. The competition is not only limited to chip design but also extends to other areas such as manufacturing and Intel (INTC) is aggressively pursuing its fab initiative.
Be the first to comment