

Deagreez
According to Howard Marks and John Templeton, two of the greatest investors in history, you can only ever be 80% confident about any company on Wall Street.
This is the Marks/Templeton certainty limit, and it represents “I’ll die on this hill” confidence. Today I wanted to explain why Altria Group, Inc. (NYSE:MO), the 8% yielding dividend king, is one of my highest conviction ultra high-yield recommendations today. One that I’m 80% confident will make you a lot of money in the coming 5+ years.
While I’m not a market timer, there are five reasons why you might want to buy Altria before August 26th. Not just for a potential short-term pop that might be coming, but to achieve potentially life-changing long-term income and wealth compounding that could help you retire in safety and splendor.
So let me show you the five reasons why your retirement will likely thank you if you buy the greatest stock in history before August 26th.
Reason One: Solid Earnings During Challenging Economic Conditions
Bottom line up front, Altria’s earnings were solid in a quarter where they were facing some exceptionally challenging macroeconomic headwinds.
(Source: earnings presentation)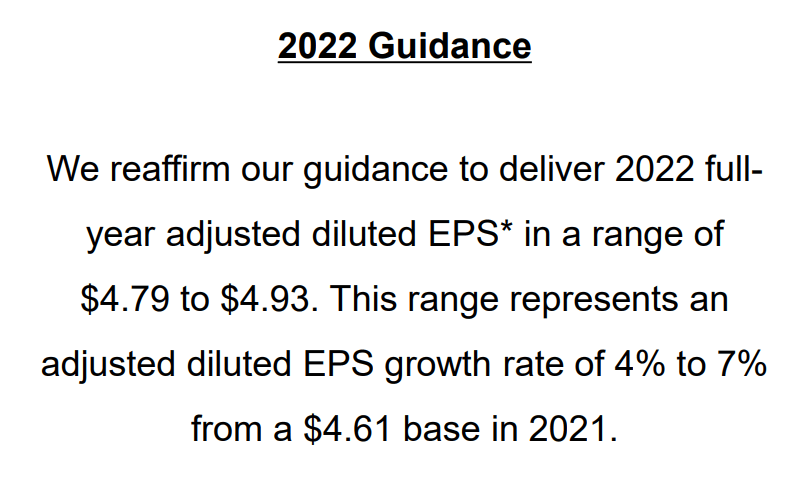
MO reaffirmed its guidance for 4% to 7% EPS growth in 2022.
(Source: earnings presentation)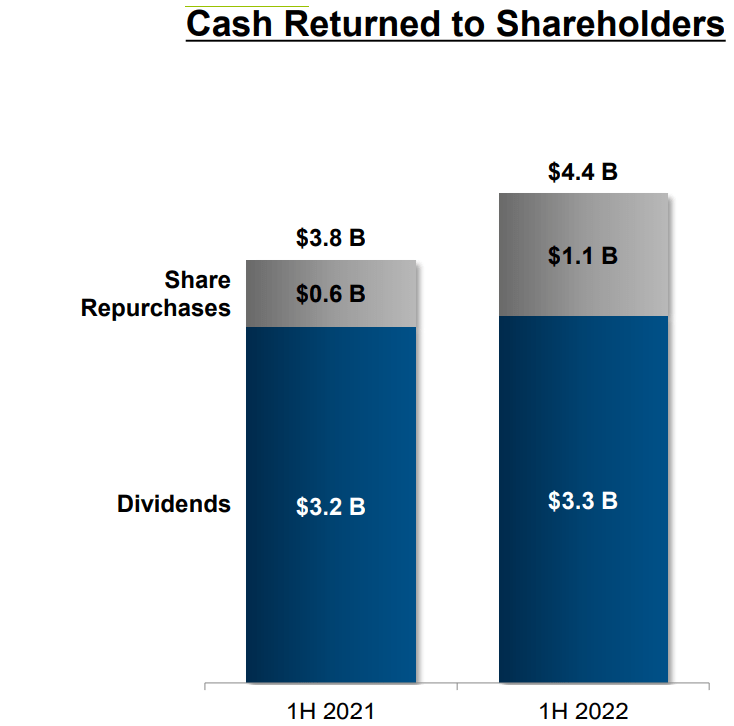
Management is ramping up its buyback program with a $3.5 billion authorization. Buybacks in the first half of 2022 were up 83% from the first half of 2021.
We have approximately $750 million remaining under the currently authorized $3.5 billion share repurchase program, which we expect to complete by the end of this year. Our balance sheet remains strong. And as of the end of the second quarter, our debt-to-EBITDA ratio was 2.3x. We expect to retire $1.1 billion of notes coming due in August with available cash.” – CFO, Q2 conference call
MO plans to buy back $750 million in additional shares at highly attractive valuations in the final six months of 2022 and retire $1.1 billion in debt.
(Source: earnings presentation)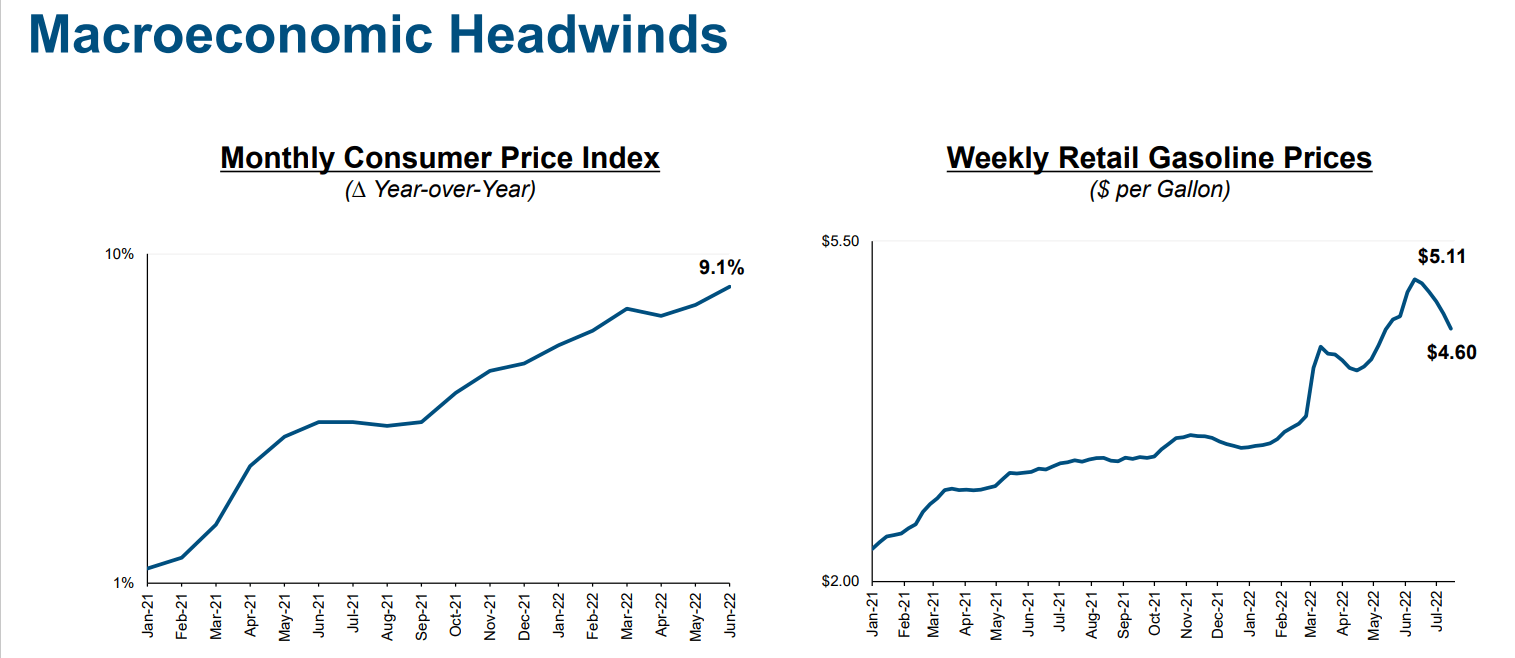
Some analysts were worried that high inflation and soaring gas prices could hurt consumers’ ability to pay MO’s rising prices on its cigarettes.
- Which still make up 84% of its total revenue
(Source: earnings presentation)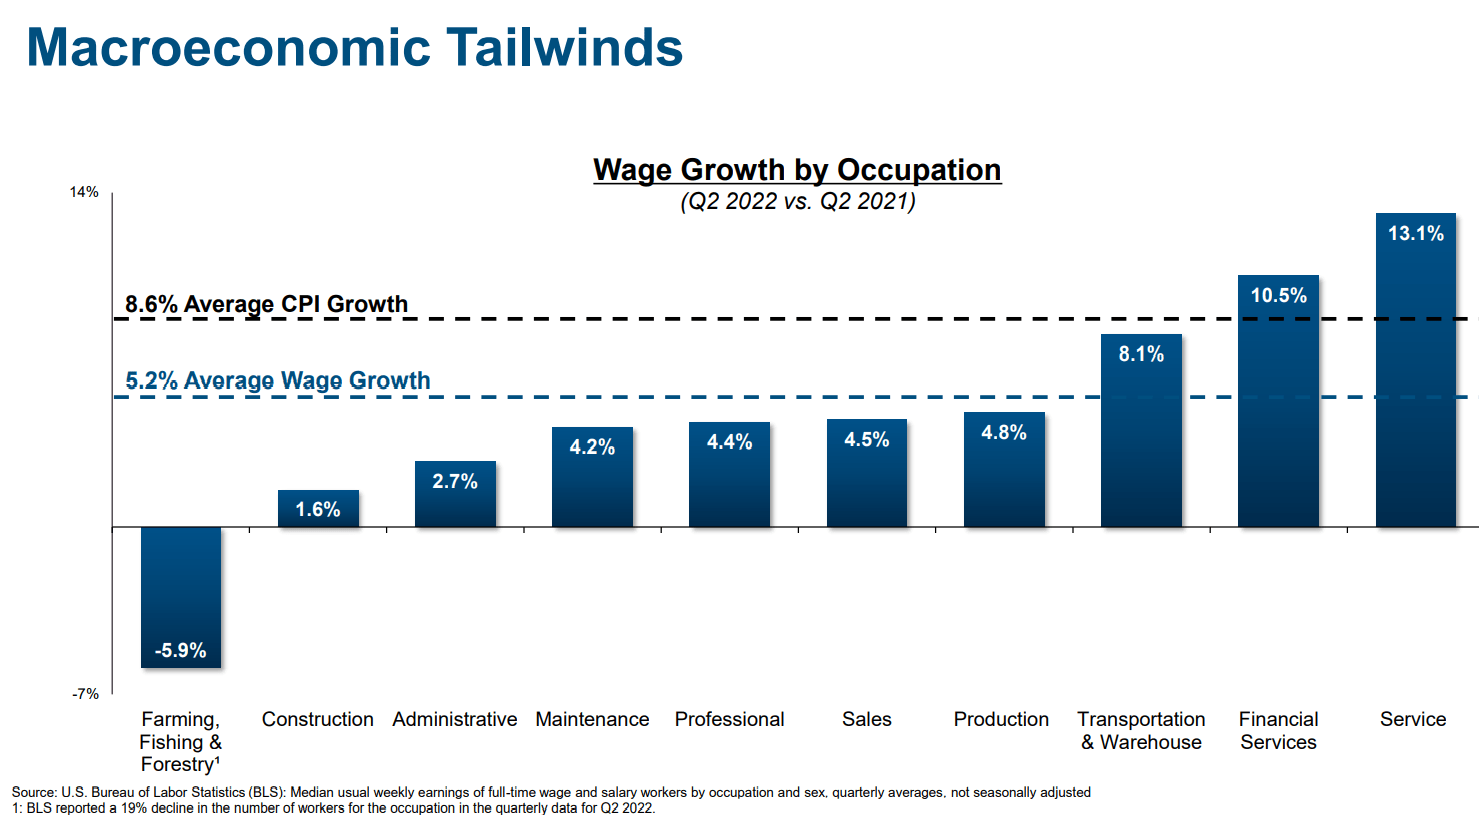
In Q2, real wage growth averaged -3.4%, which does indicate a rising short-term risk to its core business.
The Bond Market Is Also Concerned About High Gas Prices Hurting MO’s Business
FactSet Research Terminal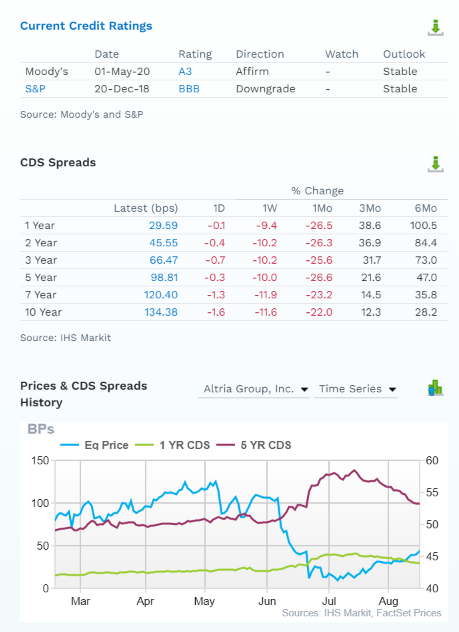
As gas prices soared to record highs, the bond market’s credit default swaps began pricing in a higher default risk (fundamental risk of bankruptcy).
- Gas prices are now down for 63 consecutive days
- MO’s default risk has fallen 26% in the last month
- tracking gas prices almost perfectly.
(Source: earnings presentation)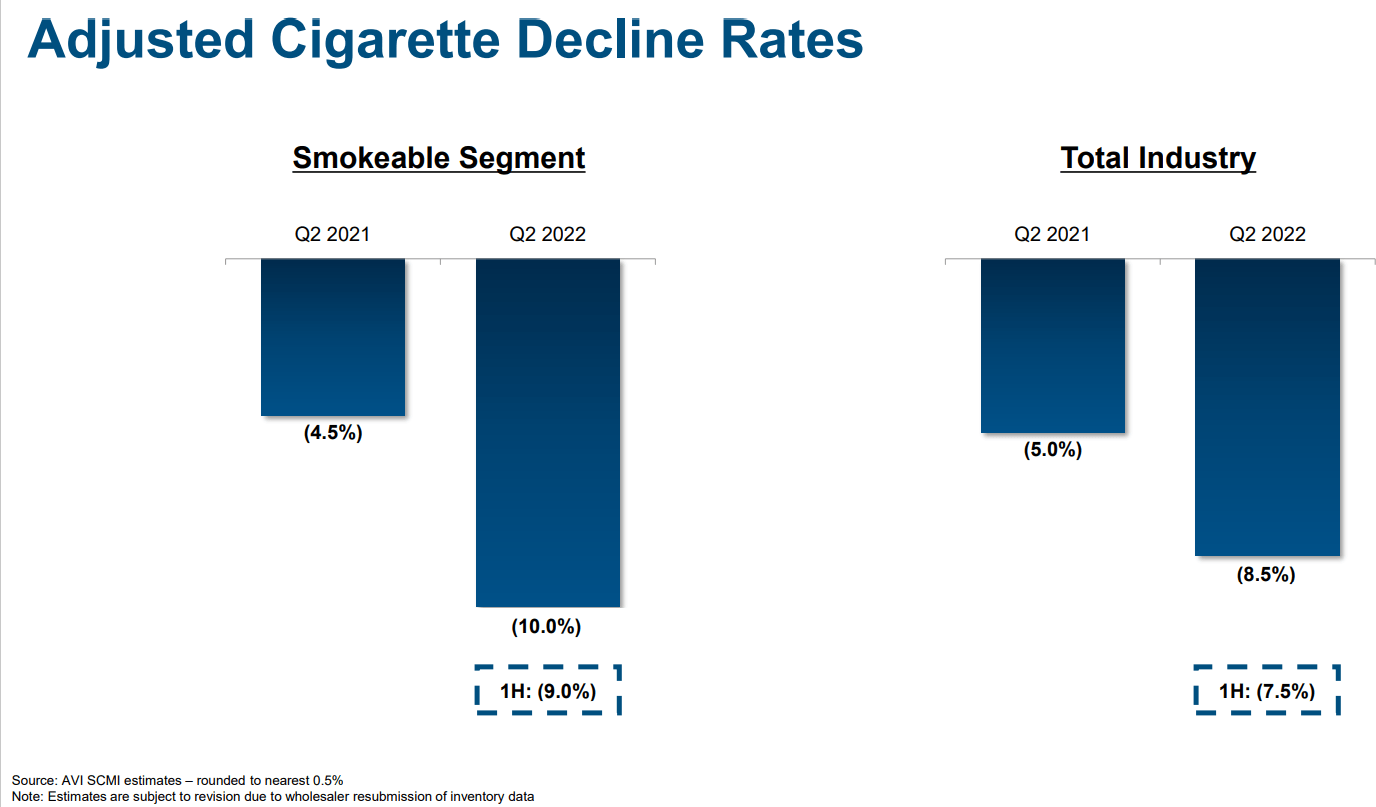
MO’s experienced a sharp 10% volume decline in Q2 and -9% in the first half of the year, with about 1.5% loss of market share.
- Cigarette revenue was down 0.7%
- due to a 9.3% increase in price.
Although the U.S.’s economic outlook is darkening, Altria may be a relatively safe shelter from commodity cost inflation. There is an upside to our valuation as of the close of business on July 28.” – Morningstar (emphasis added).
Altria is legendary for its pricing power, thanks to its dominance in premium U.S. cigarettes, making it a great inflation hedge.
(Source: earnings presentation)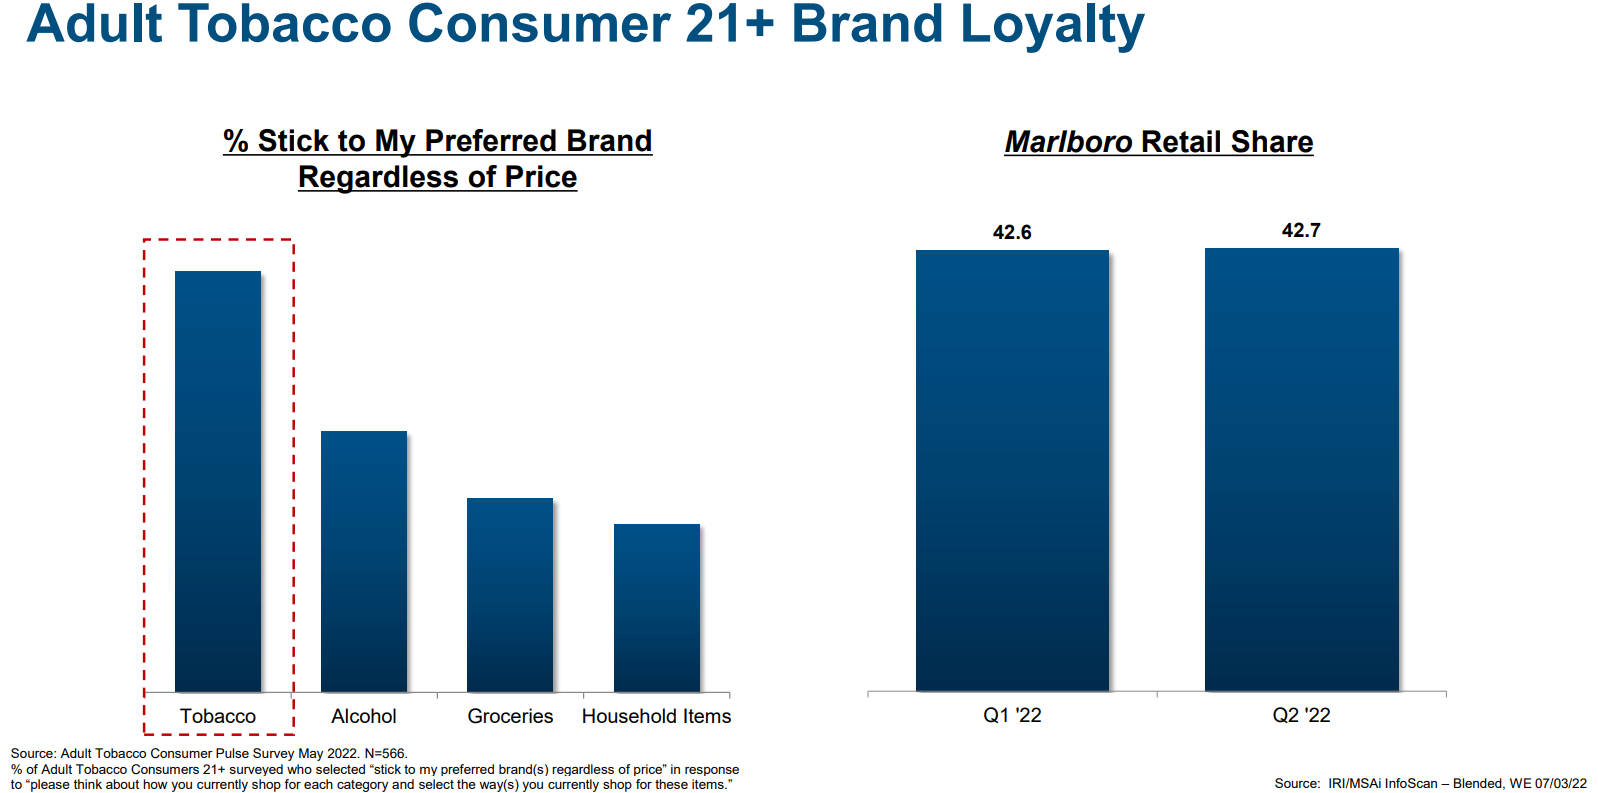
Consumer loyalty to tobacco brands is stronger than alcohol, groceries, or household consumer staples products, and Marlboro has a stable 43% market share in the U.S.
How long can MO keep raising cigarette prices before demand destruction kicks in?
We analyzed the affordability of cigarettes by estimating the number of minutes of labor required, on average, to purchase a pack of 20 cigarettes. The U.S. was the fourth most affordable cigarette market among the 35 OECD nations…
A pack of 20 cigarettes (equivalent; a standard pack contains 25 sticks in Australia) now costs roughly $26, well above the $17.80 retail price for a premium pack in the U.K., $6.50 in the U.S., and around $5.50 on average globally, according to the World Health Organization. Assuming the Australian experience is applicable to price elasticity in other markets, it appears a great deal of headroom remains for price increases globally. At 4% real pricing (based on 6% nominal price/mix and 2% global inflation), this crude calculation suggests that it will be 2051 before global pricing reaches levels at which price elasticity increased in Australia. ” – Morningstar (emphasis added).
U.S. cigarettes are the 4th cheapest in the developed world. This implies that MO and BTI have plenty of time to transition to 100% non-tobacco sales.
Globally, Morningstar estimates that BTI has 29 years before demand destruction will start to erode pricing power.
In the U.S., cigarettes are about $1 per pack, more expensive for MO, has a bit less time, but still likely over 20 years.
- Management plans to fully transition to RRPs well before pricing power erodes
Our approach spans 3 of the most promising smoke-free categories with the potential to reduce harm: oral tobacco, e-vapor and heated tobacco.” – MO CEO, Q2 conference call
MO’s plan for the transition to a smoke-free future involves the following:
- oral nicotine pouches
- vaping
- heat sticks (iQos)
(Source: earnings presentation)
In the U.S., oral nicotine saw its market share (vs. chewing tobacco) rise by 50% to 21%.
MO’s on! brand saw its market share rise 2.9% to 43%, second only to Swedish’s Match’s Zyn at 56%.
- PM is buying Swedish Match
Together, PM and MO control 99% of this market.
(Source: earnings presentation)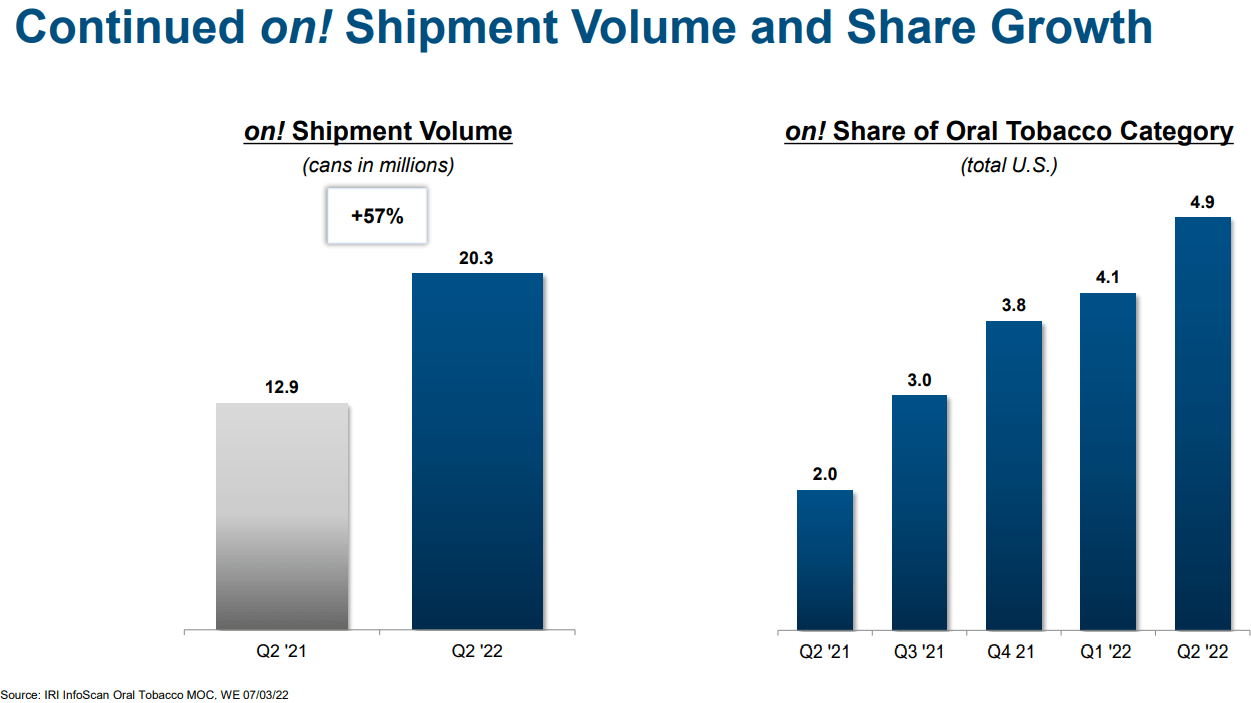
on!’s market share of oral tobacco rose about 150% in the last year, to 4.9%, with volumes up 57%.
(Source: earnings presentation)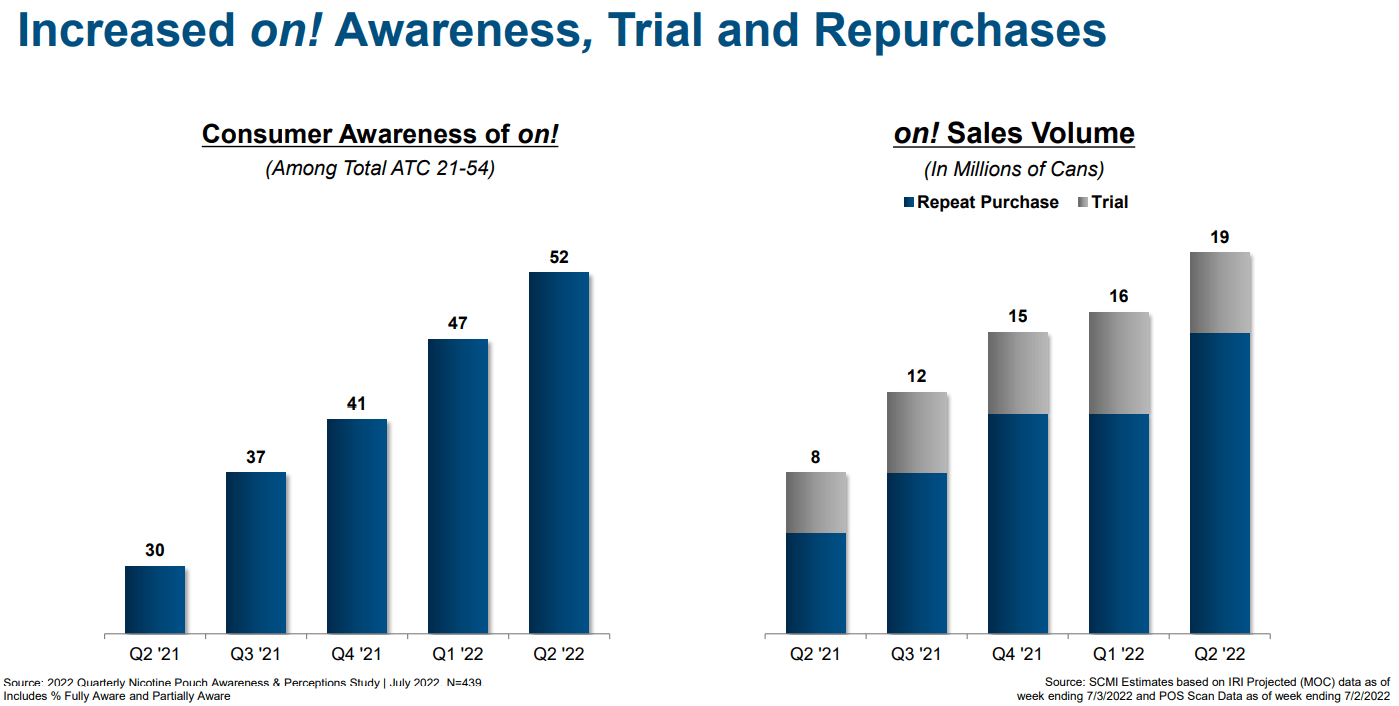
About half of U.S. oral tobacco users have never heard of on! And as its advertising rollout proceeds, so does repeat adoption and sales.
That’s the good news on RRPs. Here’s the bad news.
(Source: earnings presentation)
U.S. vaping growth has stalled thanks to the FDA dragging its feet on regulations.
(Source: earnings presentation)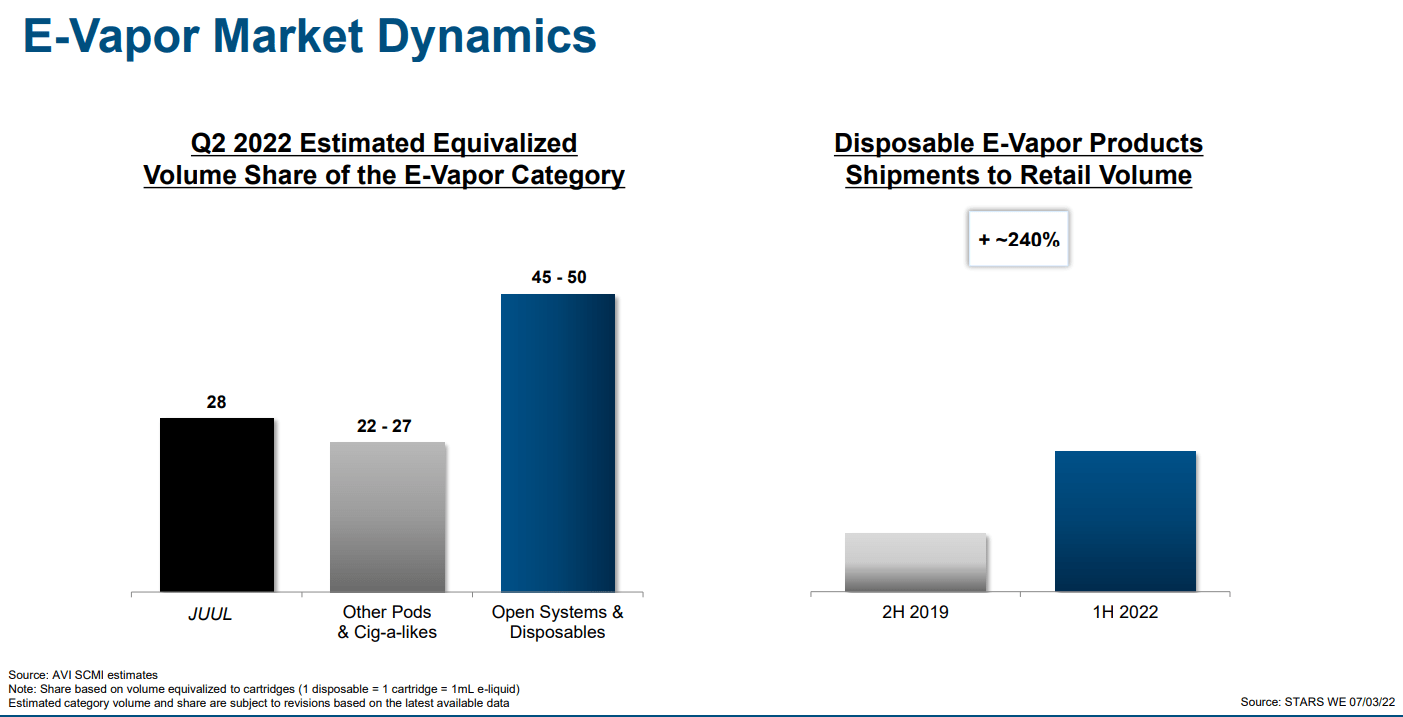
Juul has a 28% market share in vaping, but now half of vapers use independent products not sold by large companies.
(Source: earnings presentation)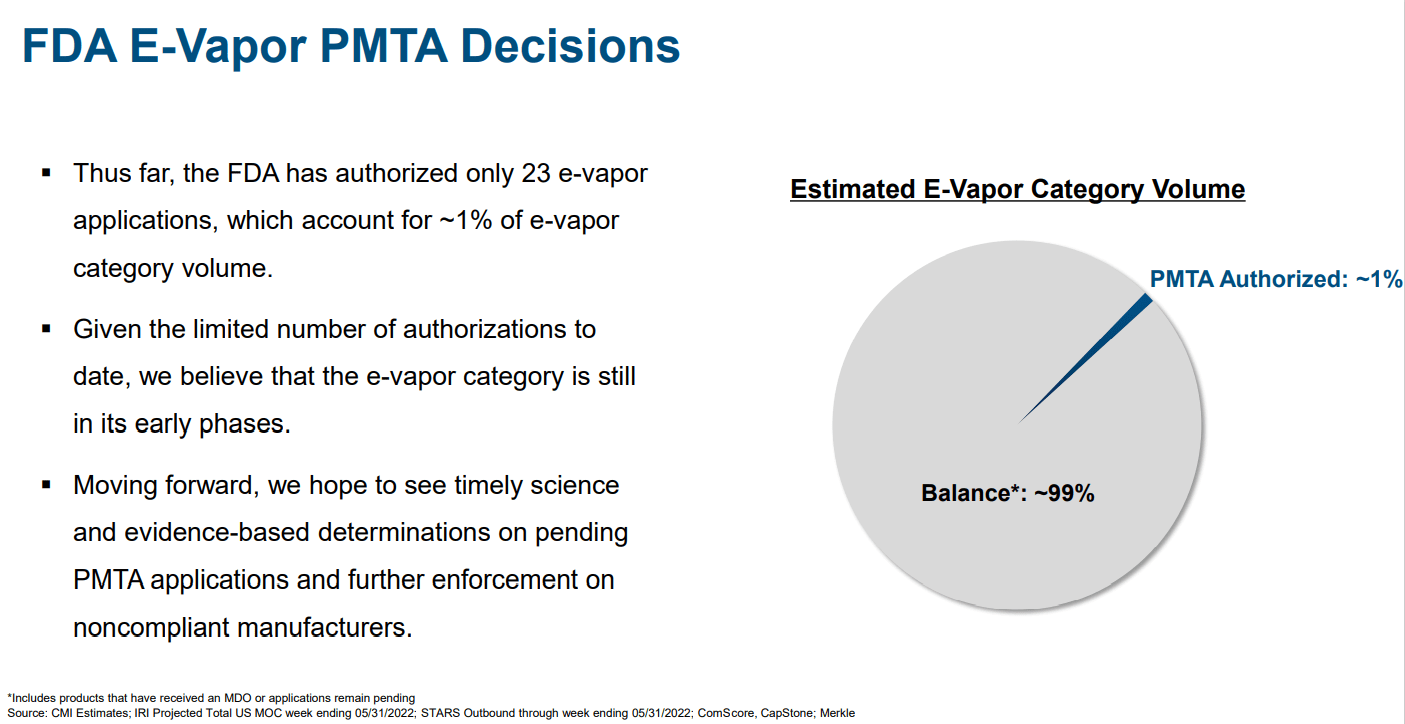
The FDA isn’t approving vaping products nor cracking down on the many producers selling products without regulatory compliance.
(Source: earnings presentation)
The FDA tried to ban Juul in the U.S., but a judge has blocked that order under Juul can complete its appeal.
- Juul claims to have 6,000 pages of studies showing the reduced risk nature of its products that the FDA ignored in its decision
(Source: earnings presentation)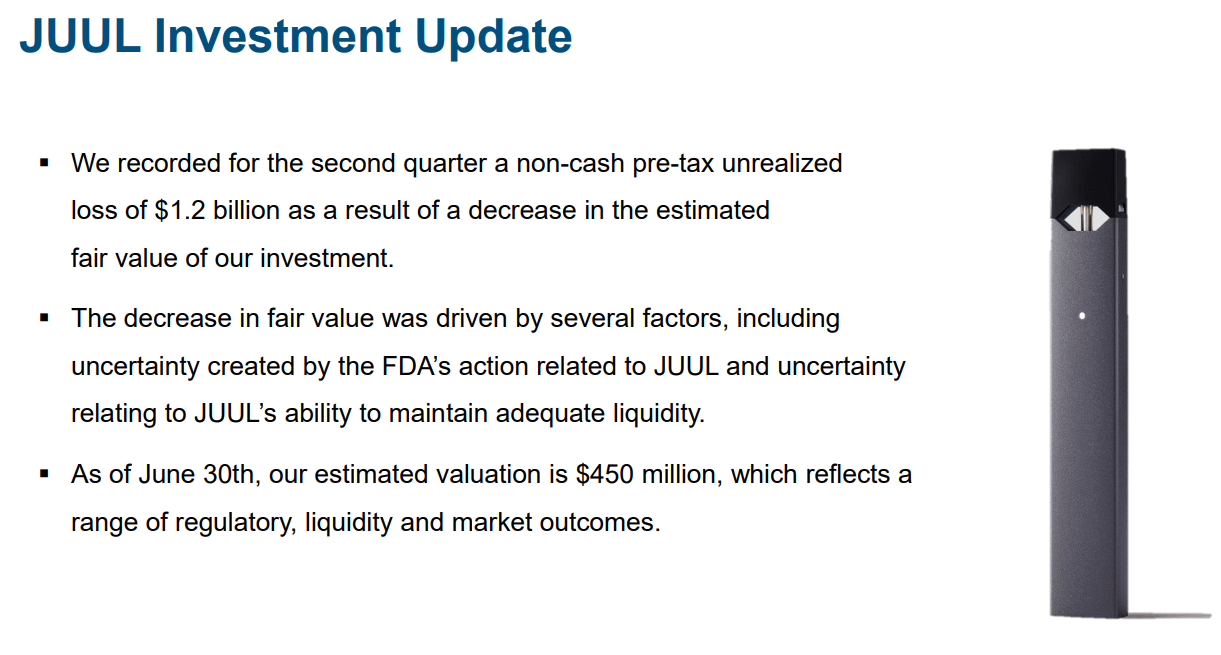
MO wrote down its $12.8 billion investment for 35% of Juul to $450 million, a 96.5% write-down.
- a non-cash expense
- has no impact on cash flow or dividend safety
This means that MO is now contractually able to start competing with JUUL in the U.S. However, it doesn’t plan to do that.
(Source: earnings presentation)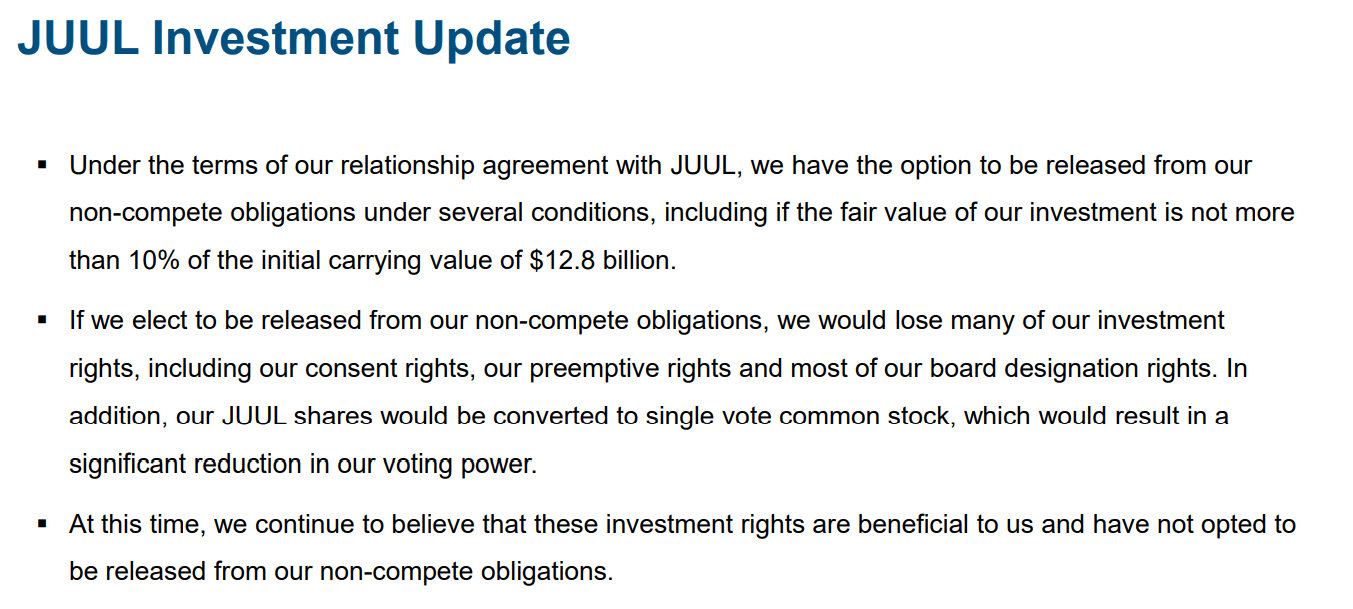
MO wants to keep its board seats and voting power at JUUL, which still commands 28% of the US vaping market.
I understand the logic here, but I am concerned that MO could run out of time to transition to RRPs before the new nicotine regulations kill Marlboro.
- if BTI’s RRPs are approved, and MO’s aren’t, then brand loyalty goes out the window
- if the only way to get a nicotine fix is to choose approved RRPS over Marlboro, MO, customers are likely to switch brands
(Source: earnings presentation)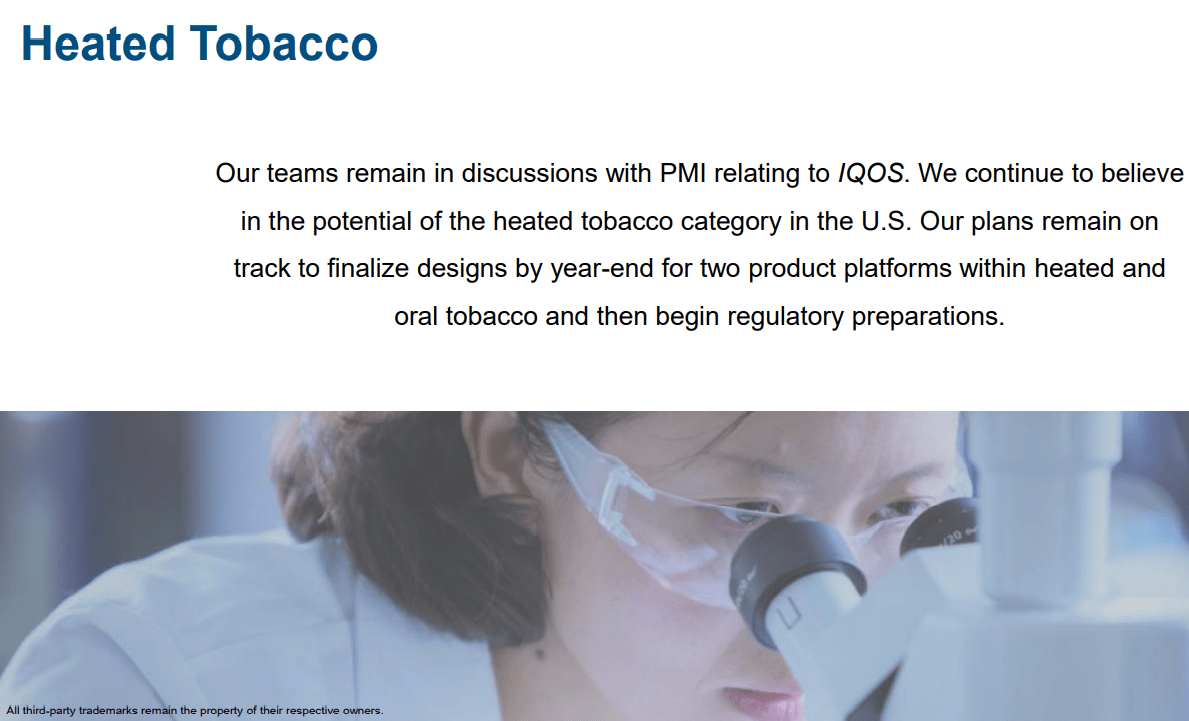
MO and PM expect to have two new iQos versions ready to submit for FDA approval by the end of the year.
Regulatory Update
The Biden administration announced plans for future FDA rule-making to develop a product standard to set a maximum nicotine level for cigarettes. We expect to fully engage in the multi-year process if and when the FDA proceeds with rule-making. We believe harm-reduction is the best approach toward reducing smoking and improving public health. And according to a nationwide survey, others agree.” – MO CEO, Q2 conference call (emphasis added).
(Source: earnings presentation)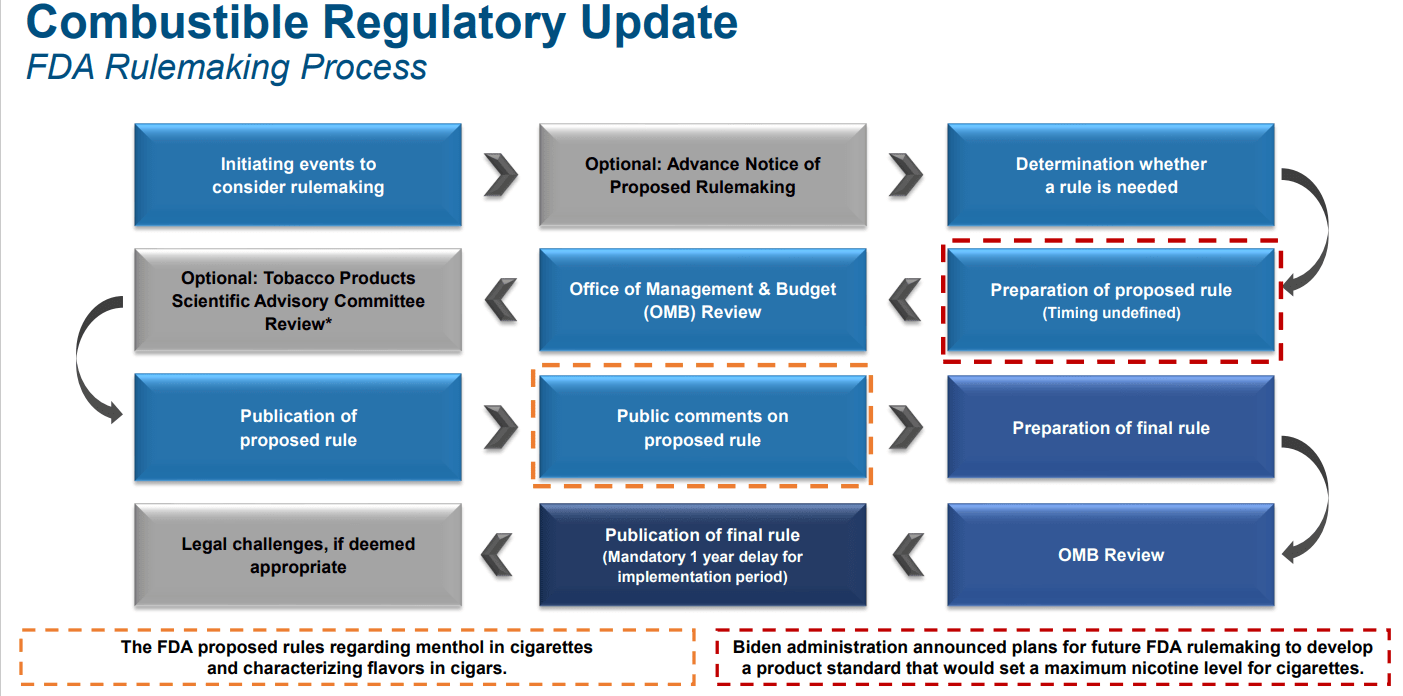
The regulatory process for tobacco is a long and winding road.
- British American estimates the menthol ban/nicotine reduction proposal likely won’t kick in until 2027
So, MO and BTI have time to prepare for the new regulations by ramping up their reduced-risk products, or RRPs.
- The nicotine regulations aren’t expected to apply to RRPs
(Source: earnings presentation)
Most industry experts, smokers, and Americans support RRPs replacing cigarettes rather than full-on bans.
Post Earnings Safety And Quality Update
The Dividend Kings’ overall quality scores are based on a 269-point model that includes the following:
-
Dividend safety
-
Balance sheet strength
-
Credit ratings
-
Credit default swap medium-term bankruptcy risk data
-
Short and long-term bankruptcy risk
-
Accounting and corporate fraud risk
-
Profitability and business model
-
Growth consensus estimates
-
Management growth guidance
-
Historical earnings growth rates
-
Historical cash flow growth rates
-
Historical dividend growth rates
-
Historical sales growth rates
-
Cost of capital
-
GF Scores
-
Morningstar business model uncertainty score
-
Long-term risk-management scores from MSCI, Morningstar, FactSet, S&P, Reuters’/Refinitiv, and Just Capital
-
Management quality
-
Dividend-friendly corporate culture/income dependability
-
Long-term total returns (a Ben Graham sign of quality)
-
Analyst consensus long-term return potential
It includes over 1,000 fundamental metrics, including the 12 rating agencies we use to assess fundamental risk.
-
credit and risk management ratings make up 41% of the DK safety, and quality model
-
dividend/balance sheet/risk ratings make up 82% of the DK safety and quality model
How do we know that our safety and quality model works well?
During the two worst recessions in 75 years, our safety model 87% of blue-chip dividend cuts, the ultimate baptism by fire for any dividend safety model.
How does MO score on our comprehensive safety and quality models after earnings?
Altria Dividend Safety
| Rating | Dividend Kings Safety Score (191 Point Safety Model) | Approximate Dividend Cut Risk (Average Recession) | Approximate Dividend Cut Risk In Pandemic Level Recession |
| 1 – unsafe | 0% to 20% | over 4% | 16+% |
| 2- below average | 21% to 40% | over 2% | 8% to 16% |
| 3 – average | 41% to 60% | 2% | 4% to 8% |
| 4 – safe | 61% to 80% | 1% | 2% to 4% |
| 5- very safe | 81% to 100% | 0.5% | 1% to 2% |
| MO | 86% | 0.5% | 1.70% |
| Risk Rating | Medium-Risk (56th industry percentile risk-management consensus) | BBB stable outlook credit rating 7.5% 30-year bankruptcy risk | 20% OR LESS Max Risk Cap Recommendation |
Long-Term Dependability
| Company | DK Long-Term Dependability Score | Interpretation | Points |
| Non-Dependable Companies | 21% or below | Poor Dependability | 1 |
| Low Dependability Companies | 22% to 60% | Below-Average Dependability | 2 |
| S&P 500/Industry Average | 61% (61% to 70% range) | Average Dependability | 3 |
| Above-Average | 71% to 80% | Very Dependable | 4 |
| Very Good | 81% or higher | Exceptional Dependability | 5 |
| MO | 84% | Exceptional Dependability | 5 |
Overall Quality
| MO | Final Score | Rating |
| Safety | 86% | 5/5 Very Safe |
| Business Model | 80% | 3/3 Wide And Stable Moat |
| Dependability | 84% | 5/5 Exceptional |
| Total | 85% | 13/13 Ultra SWAN Dividend King |
| Risk Rating | 3/5 Low-Risk | |
| 20% OR LESS Max Risk Cap Rec |
5% Margin of Safety For A Potentially Good Buy |
MO is the 147 highest quality company on the DK 500 Masterlist.
How significant is this? The DK 500 Master List is one of the world’s best watchlists, including
- every dividend aristocrat (S&P companies with 25+ year dividend growth streaks)
- every dividend champion (every company, including foreign, with 25+ year dividend growth streaks)
- every dividend king (every company with 50+ year dividend growth streaks)
- every foreign aristocrat (every company with 20+ year dividend growth streaks)
- every Ultra SWAN (wide moat aristocrats, as close to perfect quality companies as exist)
- 40 of the world’s best growth stocks
In other words, even among the world’s best companies, MO is higher quality than 71% of them, similar in quality to such aristocrats and blue-chips as:
- Coca-Cola (KO): Ultra SWAN dividend king
- Procter & Gamble (PG): Ultra SWAN dividend king
- Kimberly-Clark (KMB): Ultra SWAN dividend king
- Illinois Tool Works (ITW): Ultra SWAN dividend king
- Caterpillar (CAT): Ultra SWAN dividend aristocrat
- Walmart (WMT): Ultra SWAN dividend aristocrat
- McCormick (MKC): Ultra SWAN dividend aristocrat
Reason Two: Altria Is Likely To Hike Its Dividend 6% By August 26th
Altria has a 52-year dividend growth streak making it a dividend king.
FAST Graphs, FactSet
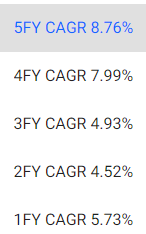
Altria raises its dividend once per year (2018 was 2 due to tax cuts), and analysts expect a 6% dividend hike to arrive by the end of the month.
- $3.6 annual dividend to $3.82
- an 8.5% forward yield at today’s prices
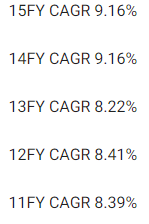
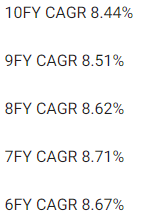
Altria’s Historical Dividend Hikes
| Year | Date Of Dividend Increase | Day Of The Week | Size Of Dividend Increase |
Stock Total Return In The Following 3 Months |
| 2021 | 8/26/2021 | Thursday | 4.70% | -8.6% |
| 2020 | 7/28/2020 | Tuesday | 2.40% | -11.9% |
| 2019 | 8/22/2019 | Thursday | 5.00% | 7.2% |
| 2018 | 8/23/2018 | Thursday | 14.30% | -9.1% |
| 2017 | 8/24/2017 | Thursday | 8.20% | 4.1% |
| 2016 | 8/25/2016 | Thursday | 8.00% | -1.3% |
| 2015 | 8/21/2015 | Friday | 8.70% | 7.1% |
| 2014 | 8/21/2014 | Thursday | 8.30% | 17.0% |
| 2013 | 8/23/2013 | Friday | 9.10% | 10.2% |
| 2012 | 8/24/2012 | Friday | 7.30% | -0.5% |
| Average | NA | NA | 7.6% | 1.4% |
| Median | NA | NA | 8.1% | 1.8% |
(Source: Seeking Alpha, Ycharts, DK Research Terminal)
Altria usually hikes its annual dividend on the 3rd Thursday or Friday of August.
- August 25th or 26th this year
The stock tends to rally a bit in the following months following the hike, though any given year can be different, depending on whether it’s in a bear market and what the overall market is doing.
What’s the takeaway this time?
- MO’s actual yield is likely to jump from 7.9% to 8.5%
- the stock MIGHT rally sharply in the following months if the recent value rotation continues
Reason Three: The Investment Thesis Remains Intact
- MO’s plan remains a 100% smoke-free future
- 100% of revenues from RRPs (and Cannabis)
- making tobacco no more controversial than alcohol companies
MO has hit some headwinds with its smoke-free RRP plans but has the financial resources, adaptable management, and time necessary to adapt and overcome them.
- just as it has for over 50 years
- in which cigarette volumes declined every single year other than the Pandemic (they went up because smokers smoked more)
Reasons To Potentially Buy Altria Today (Before The Likely 6% Dividend Hike On Friday, August 26th)
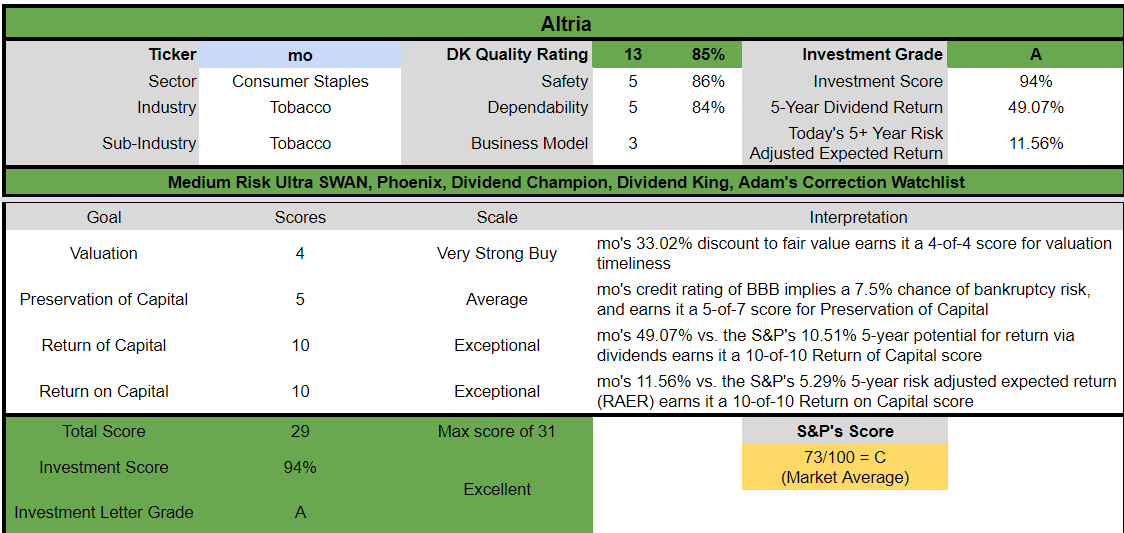
| Metric | Altria |
| Quality | 85% 13/13 Ultra SWAN (Sleep Well At Night) |
| Risk Rating | Medium |
| DK Master List Quality Ranking (Out Of 500 Companies) | 147 |
| Quality Percentile | 71% |
| Dividend Growth Streak (Years) | 52 (53 Soon) |
| Dividend Yield | 7.8% (8.5% Soon) |
| Dividend Safety Score | 86% – Very Safe |
| Average Recession Dividend Cut Risk | 0.5% |
| Severe Recession Dividend Cut Risk | 1.7% |
| S&P Credit Rating | BBB Stable |
| 30-Year Bankruptcy Risk | 7.5% |
| Consensus LT Risk-Management Industry Percentile |
56% Average Risk-Management |
| Fair Value | $68.29 |
| Current Price | $45.74 |
| Discount To Fair Value | 33% |
| DK Rating |
Potentially Very Strong Buy |
| PE | 9.2 |
| Cash-Adjusted PE | 8.6 |
| Growth Priced In | 0.2% CAGR |
| Historical PE Range | 14 to 16 |
| LT Growth Consensus/Management Guidance | 4.7% |
| 5-year consensus total return potential | 16% to 20% CAGR |
| Base Case 5-year consensus return potential |
17% CAGR (3X S&P 500 consensus) |
| Consensus 12-month total return forecast | 15% |
| Fundamentally Justified 12-Month Return Potential | 59% |
| LT Consensus Total Return Potential | 13.2% CAGR Vs. 11.0% dividend aristocrats and 10.1% S&P |
| Inflation-Adjusted Consensus LT Return Potential | 11.0% |
| Consensus 10-Year Inflation-Adjusted Total Return Potential (Ignoring Valuation) | 2.66 |
| LT Risk-Adjusted Expected Return | 8.09% |
| LT Risk-And Inflation-Adjusted Return Potential | 5.87% |
| Conservative Years To Double | 12.26 |
(Source: Dividend Kings Zen Research Terminal)
Altria 2024 Consensus Total Return Potential
(Source: FAST Graphs, FactSet Research) (Source: FAST Graphs, FactSet Research)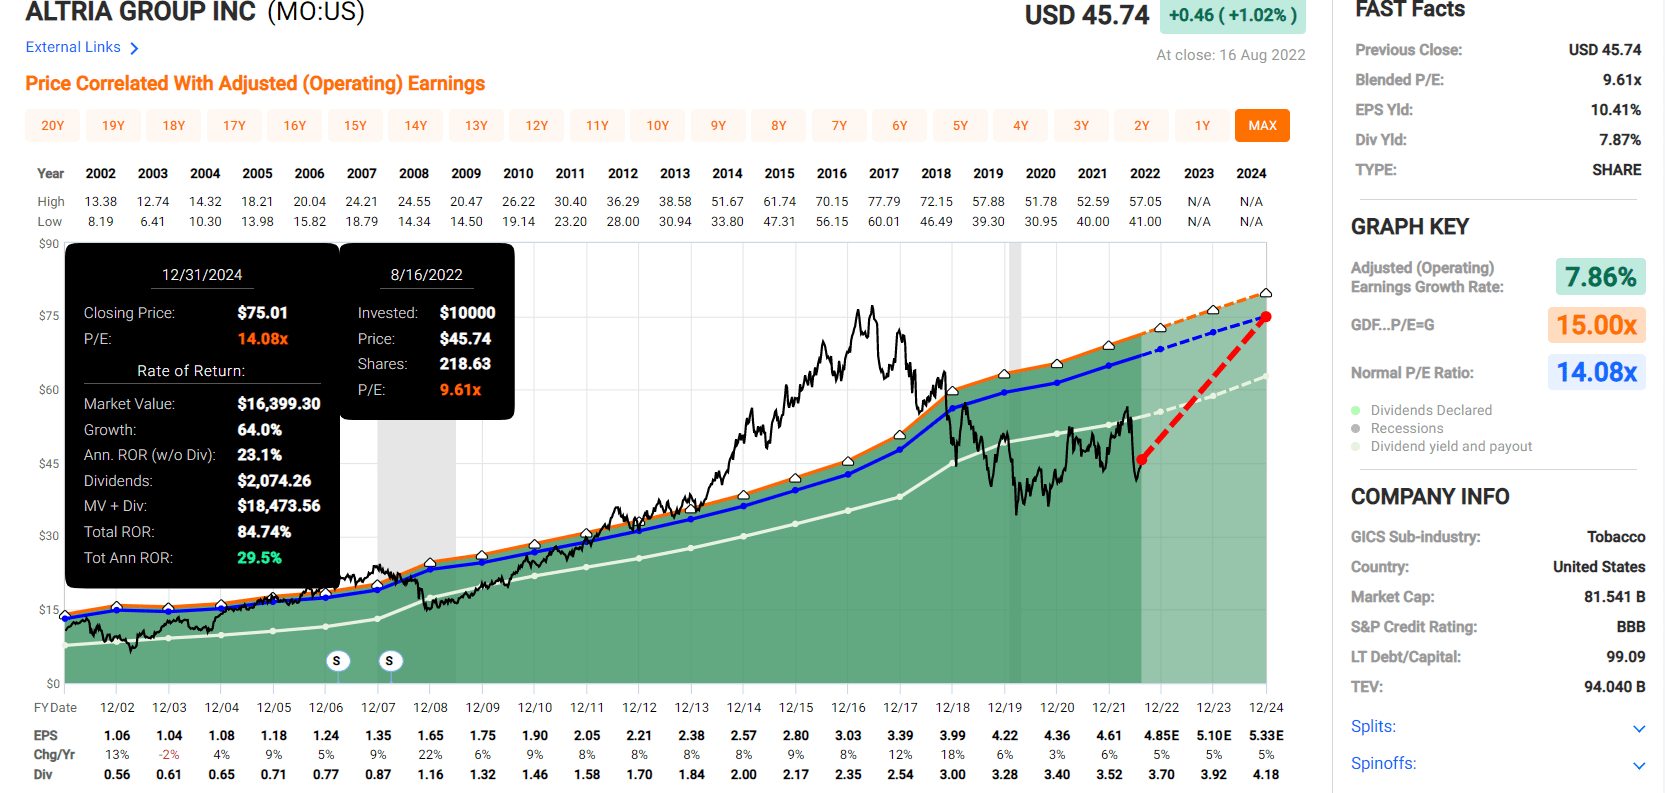
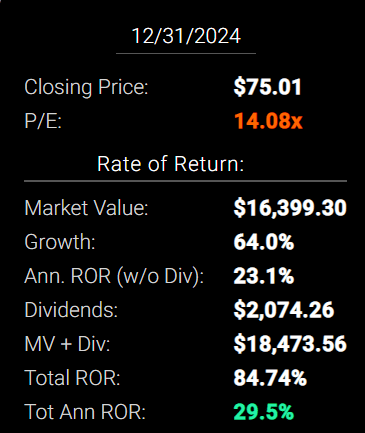
If MO grows as expected through 2024 (it almost always does) and returns to historical market-determined fair value, it could almost double in the next 2.5 years.
- 30% CAGR total return potential
- literally, Warren Buffett-like return potential from an Ultra SWAN dividend king bargain hiding in plain sight
Altria 2027 Consensus Total Return Potential
(Source: FAST Graphs, FactSet Research) (Source: FAST Graphs, FactSet Research)
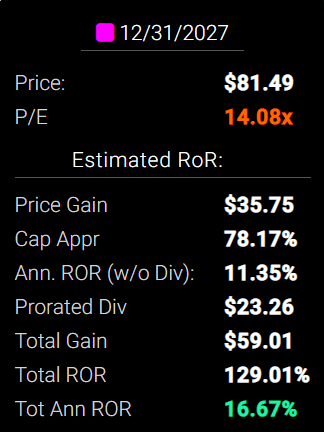
If MO grows as expected through 2027 and returns to historical fair value (the low end of the historical P/E range), it could deliver 129% total returns or 17% CAGR.
S&P 500 2024 Consensus Total Return Potential
(Source: FAST Graphs, FactSet Research)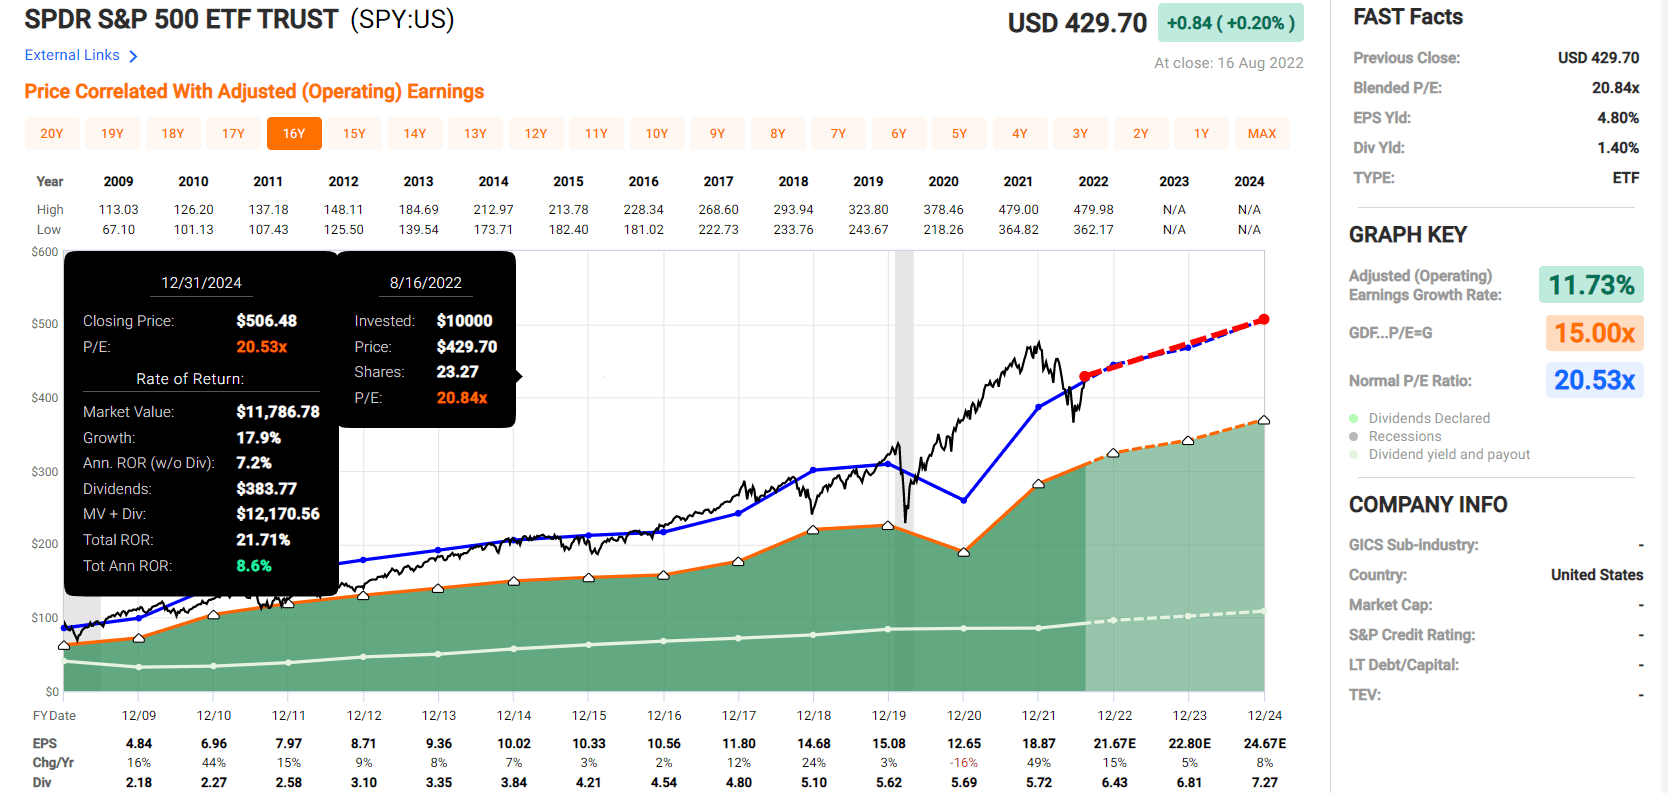
Analysts expect 22% total returns from the market over the next 2.5 years or 8.6% CAGR.
- 2022 growth estimates are falling by the week
- this figure is likely overly bullish
S&P 500 2027 Consensus Total Return Potential
| Year | Upside Potential By End of That Year | Consensus CAGR Return Potential By End of That Year | Probability-Weighted Return (Annualized) |
Inflation And Risk-Adjusted Expected Returns |
| 2027 | 40.61% | 7.05% | 5.29% | 3.01% |
(Source: DK S&P 500 Valuation And Total Return Tool)
Analysts expect 41% total returns from the S&P 500 over the next five years or 7% annually.
- MO offers 3X the total return potential of the S&P 500
Historical Returns Since April 1985
(Source: Portfolio Visualizer Premium)
MO is the best-performing stock in history.
- 17% CAGR returns since 1985 and the last 90 years
- almost 200,000X inflation-adjusted return
(Source: Portfolio Visualizer Premium)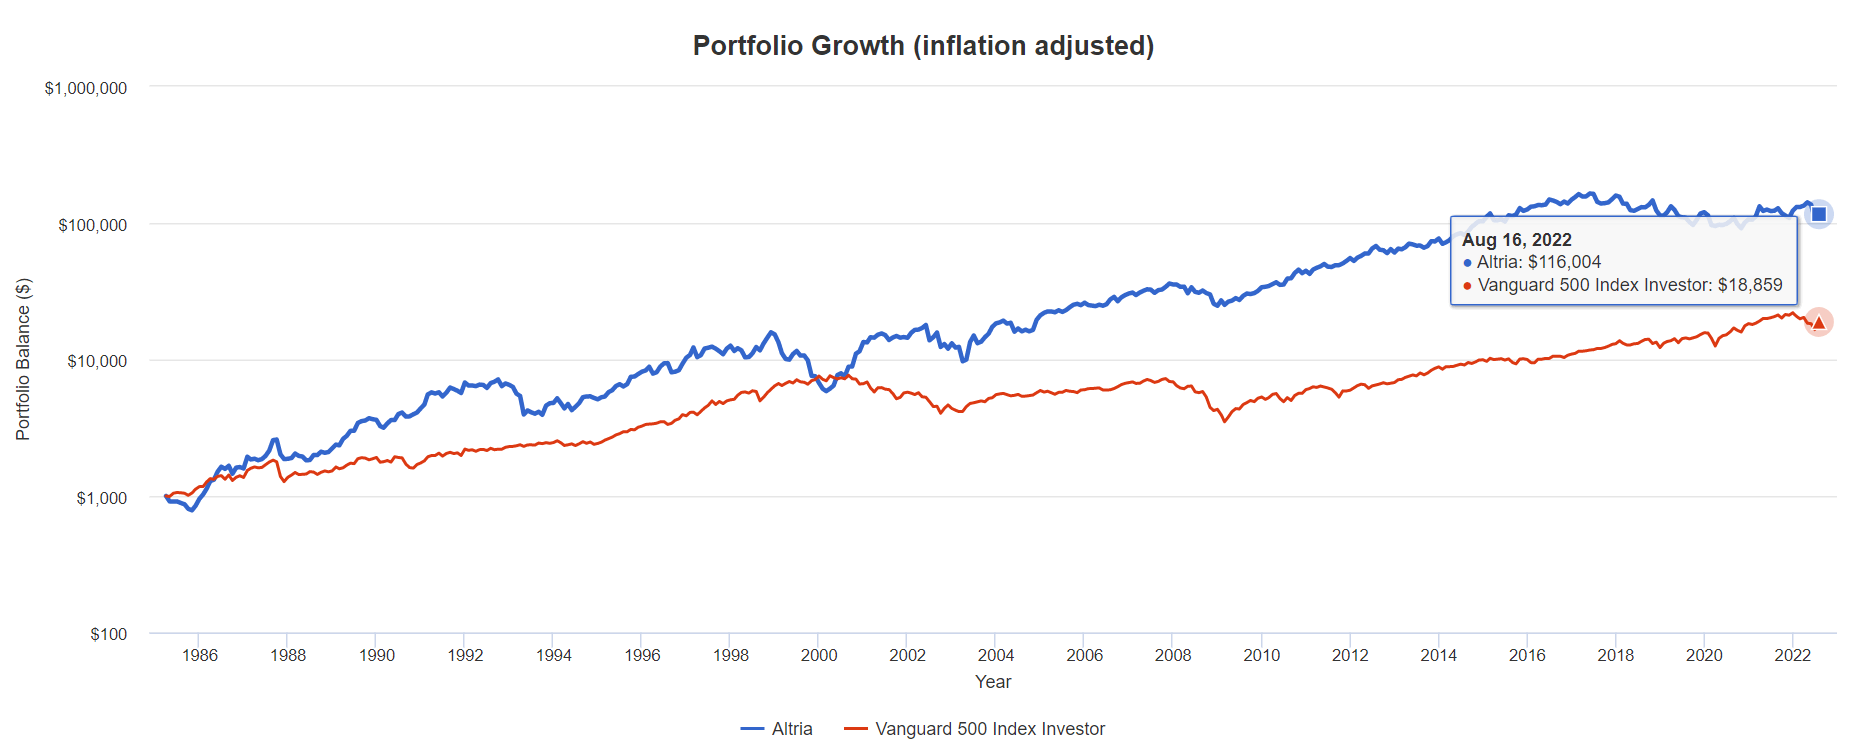
Over the last 37 years, MO delivered 116X inflation-adjusted returns, 6.1X more than the S&P 500.
Altria Rolling Returns Since April 1985
(Source: Portfolio Visualizer Premium)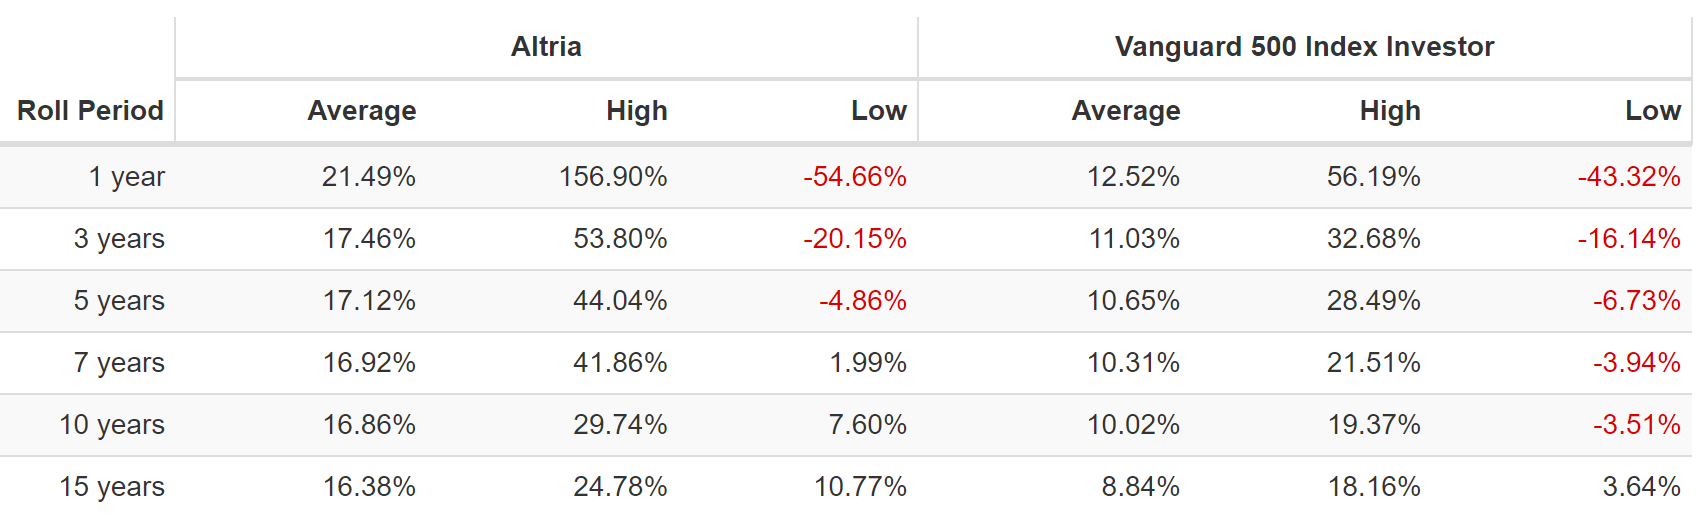
MO growing at 8% per year delivered 16% historical returns but from bear market lows as strong as 30% CAGR for the next 10 years and 25% CAGR for the next 15 years.
- 13.5X return in 10 years
- 27.7X return in 15 years
If MO were growing at its consensus growth rate over this time frame:
- 13.4% CAGR historical returns
- 22% CAGR best returns for 15 years (19.7X)
- 27% CAGR best returns for 10 years (10.9X)
What do analysts expect from MO in the future?
MO Long-Term Consensus Total Return Potential (Ignoring Valuation)
| Investment Strategy | Yield | LT Consensus Growth | LT Consensus Total Return Potential | Long-Term Risk-Adjusted Expected Return | Long-Term Inflation And Risk-Adjusted Expected Returns | Years To Double Your Inflation & Risk-Adjusted Wealth |
10-Year Inflation And Risk-Adjusted Expected Return |
| Altria (Consensus Dividend Hike) | 8.5% | 4.7% | 13.2% | 9.2% | 7.0% | 10.3 | 1.97 |
| Altria | 7.8% | 4.7% | 12.5% | 8.8% | 6.5% | 11.0 | 1.88 |
| Dividend Aristocrats | 2.4% | 8.6% | 11.0% | 7.7% | 5.5% | 13.2 | 1.70 |
| S&P 500 | 1.6% | 8.5% | 10.1% | 7.1% | 4.9% | 14.8 | 1.61 |
| Nasdaq | 0.9% | 12.6% | 13.4% | 9.4% | 7.2% | 10.0 | 2.00 |
(Sources: Morningstar, FactSet, Ycharts)
Factoring in the expected dividend hike, MO could deliver 13.2% long-term returns that are almost as good as the Nasdaq’s consensus forecast and far better than the S&P 500 and dividend aristocrats.
Inflation-Adjusted Consensus Total Return Forecast: $1,000 Initial Investment
| Time Frame (Years) | 7.9% CAGR Inflation And Risk-Adjusted S&P Consensus | 8.9% Inflation-Adjusted Aristocrat Consensus | 11.0% CAGR Inflation-Adjusted MO Consensus | Difference Between Inflation-Adjusted MO And S&P Consensus |
| 5 | $1,461.18 | $1,530.17 | $1,683.54 | $222.36 |
| 10 | $2,135.06 | $2,341.43 | $2,834.31 | $699.25 |
| 15 | $3,119.71 | $3,582.79 | $4,771.67 | $1,651.97 |
| 20 | $4,558.47 | $5,482.29 | $8,033.31 | $3,474.84 |
| 25 | $6,660.75 | $8,388.86 | $13,524.40 | $6,863.65 |
| 30 (Retirement Time Frame) | $9,732.58 | $12,836.40 | $22,768.88 | $13,036.29 |
| 35 | $14,221.09 | $19,641.92 | $38,332.33 | $24,111.24 |
| 40 | $20,779.62 | $30,055.54 | $64,534.03 | $43,754.42 |
| 45 | $30,362.83 | $45,990.17 | $108,645.67 | $78,282.84 |
| 50 | $44,365.65 | $70,372.93 | $182,909.40 | $138,543.75 |
| 55 | $64,826.35 | $107,682.76 | $307,935.41 | $243,109.05 |
| 60 (Investment Lifetime) | $94,723.18 | $164,773.26 | $518,421.77 | $423,698.59 |
(Source: DK Research Terminal, FactSet)
Analysts think MO could deliver 23X inflation-adjusted returns over the next 30 years and, over an investing lifetime, could be a potential 518X bagger.
| Time Frame (Years) | Ratio Aristocrats/S&P Consensus | Ratio Inflation-Adjusted MO vs. S&P consensus |
| 5 | 1.05 | 1.15 |
| 10 | 1.10 | 1.33 |
| 15 | 1.15 | 1.53 |
| 20 | 1.20 | 1.76 |
| 25 | 1.26 | 2.03 |
| 30 | 1.32 | 2.34 |
| 35 | 1.38 | 2.70 |
| 40 | 1.45 | 3.11 |
| 45 | 1.51 | 3.58 |
| 50 | 1.59 | 4.12 |
| 55 | 1.66 | 4.75 |
| 60 | 1.74 | 5.47 (Vs. 6.1X since 1985) |
(Source: DK Research Terminal, FactSet)
For context, the aristocrats are expected to deliver 74% more inflation-adjusted returns over an investing lifetime than the S&P 500. MO could deliver 5.5X more or 3.1X better outperformance than the dividend aristocrats.
- Assuming the smoke-free future plans are successful and MO grows at 4.7% CAGR for decades to come
An Income Growth Legend You Can Trust
(Source: Portfolio Visualizer Premium) 2007 and 2008, when the PM, Kraft, and Miller spin-offs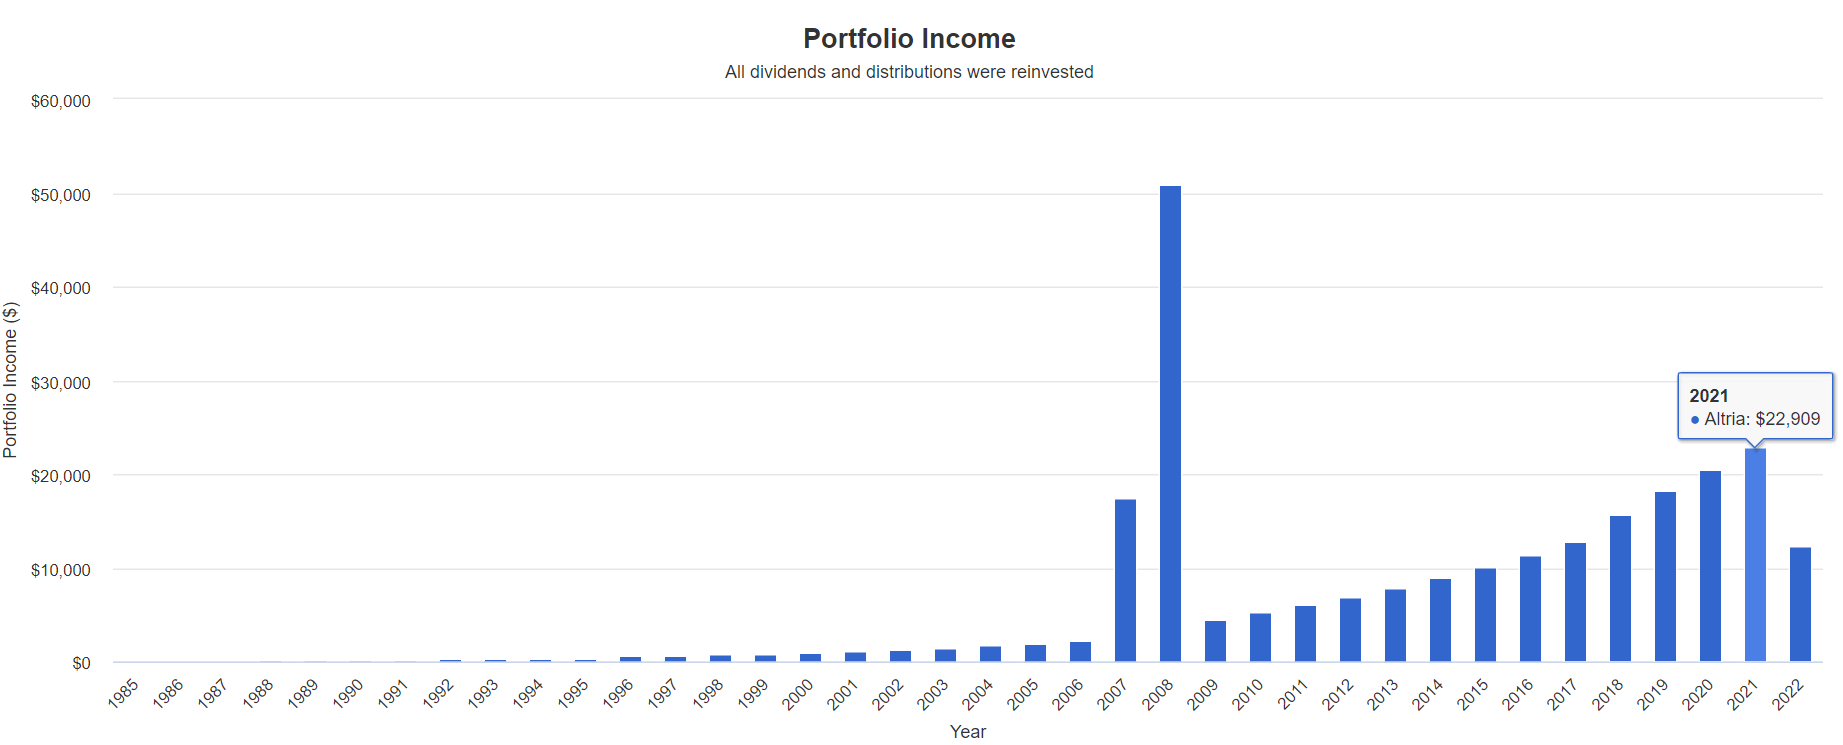
MO’s income compounding is the stuff of legend.
Altria Cumulative Dividend Since 1985: $1,000 Initial Investment
| Metric | Altria |
| Total Dividends | $259,709 |
| Annualized Income Growth Rate | 18.43% |
| Total Income/Initial Investment | 259.71 |
| Inflation-Adjusted Income/Initial Investment | 96.19 |
(Source: Portfolio Visualizer Premium)
MO has delivered 18% annual income growth for 36 years, resulting in a 260X return on your investment in dividends alone and a 96X inflation-adjusted return from dividends alone.
- a 2,473% yield on cost means investors who bought in 1986 are now getting 25X the money back every year
- and growing exponentially
Altria Consensus Future Income Growth Potential
| Analyst Consensus Income Growth Forecast | Risk-Adjusted Expected Income Growth | Risk And Tax-Adjusted Expected Income Growth |
Risk, Inflation, And Tax-Adjusted Income Growth Consensus |
| 14.6% | 10.2% | 8.7% | 6.4% |
(Source: DK Research Terminal, FactSet)
Analysts think MO could deliver similar 14.6% annual income growth in the future, which, adjusted for the risk of the company not growing as expected, inflation, and taxes, is 6.4% real expected income growth.
Now compare that to what they expect from the S&P 500.
| Time Frame | S&P Inflation-Adjusted Dividend Growth | S&P Inflation-Adjusted Earnings Growth |
| 1871-2021 | 1.6% | 2.1% |
| 1945-2021 | 2.4% | 3.5% |
| 1981-2021 (Modern Falling Rate Era) | 2.8% | 3.8% |
| 2008-2021 (Modern Low Rate Era) | 3.5% | 6.2% |
| FactSet Future Consensus | 2.0% | 5.2% |
(Sources: S&P, FactSet, Multipl.com)
- 1.7% post-tax inflation-adjusted income growth from the S&P 500
- S&P 500’s historical post-tax inflation-adjusted income growth rate (current tax code) is 5.8% CAGR
S&P is now dominated by companies favoring buybacks over dividends, potentially explaining the slower income growth in the future.
What about a 60/40 retirement portfolio?
- 0.5% consensus inflation, risk, and tax-adjusted income growth.
In other words, MO could generate about 4X faster real income growth than the S&P 500 and 13X faster income growth than a 60/40.
- And a 5.3X higher and safer yield on day one
MO Investment Decision Score
DK (Source: DK Automated Investment Decision Tool)
For anyone comfortable with its risk profile, MO is one of the most reasonable and prudent high-yield aristocrats you can buy today.
- 33% discount vs 9% market premium = 42% better valuation
- 5.3X higher yield (and a much safer yield at that)
- 30% higher long-term return potential than S&P 500 overtime
- 2X higher risk-adjusted expected return for the next five years
- 5X of your investment repaid in consensus dividends over five years
Quantitative Analysis: The Math Backing Up The Investment Thesis
Ben Graham recommended combining qualitative (the story) analysis with quantitative analysis looking at the past, present, and likely future.
MO Credit Ratings
| Rating Agency | Credit Rating | 30-Year Default/Bankruptcy Risk | Chance of Losing 100% Of Your Investment 1 In |
| S&P | BBB stable | 7.50% | 13.3 |
| Fitch | BBB stable | 7.50% | 13.3 |
| Moody’s | A3 (A- equivalent) stable | 2.50% | 40.0 |
| Consensus | BBB+ stable | 5.83% | 17.1 |
(Sources: S&P, Fitch, Moody’s)
Rating agencies estimate a 1 in 17 chance of MO going bankrupt and investors losing all their money over the next 30 years.
MO Leverage Consensus Forecast
| Year | Debt/EBITDA | Net Debt/EBITDA (3.0 Or Less Safe According To Credit Rating Agencies) |
Interest Coverage (8+ Safe) |
| 2021 | NA | 1.97 | 10.04 |
| 2022 | 2.39 | 1.96 | 11.34 |
| 2023 | 2.32 | 1.87 | 11.72 |
| 2024 | 2.28 | 1.79 | 14.71 |
| 2025 | 2.35 | 1.78 | NA |
| Annualized Change | -0.60% | -3.29% | 13.59% |
(Sources: FactSet Research Terminal)
MO has safe leverage now, and management says it plans to maintain current leverage ratios in the future.
MO Balance Sheet Consensus Forecast
| Year | Total Debt (Millions) | Cash | Net Debt (Millions) | Interest Cost (Millions) | EBITDA (Millions) | Operating Income (Millions) |
| 2021 | NA | NA | $23,783 | $1,176 | $12,044 | $11,807 |
| 2022 | $29,701 | $4,814 | $24,385 | $1,064 | $12,420 | $12,063 |
| 2023 | $29,651 | $4,814 | $23,915 | $1,070 | $12,777 | $12,540 |
| 2024 | $29,982 | $4,814 | $23,557 | $870 | $13,138 | $12,802 |
| 2025 | $29,488 | $5,353 | $22,299 | $12,555 | $12,407 | |
| Annualized Growth | -0.24% | 3.60% | -2.94% | -9.56% | 1.04% | 1.25% |
(Sources: FactSet Research Terminal)
- debt is drifting lower
- cash flows are slowly but steadily growing
- interest costs are 4.02% and are expected to approach 3% by 2024
- possibly due to credit rating upgrades
- MO’s inflation-adjusted average borrowing cost is 1.7%
- vs. 30% cash returns on invested capital
MO Bond Profile
(Sources: FactSet Research Terminal) (Sources: FactSet Research Terminal)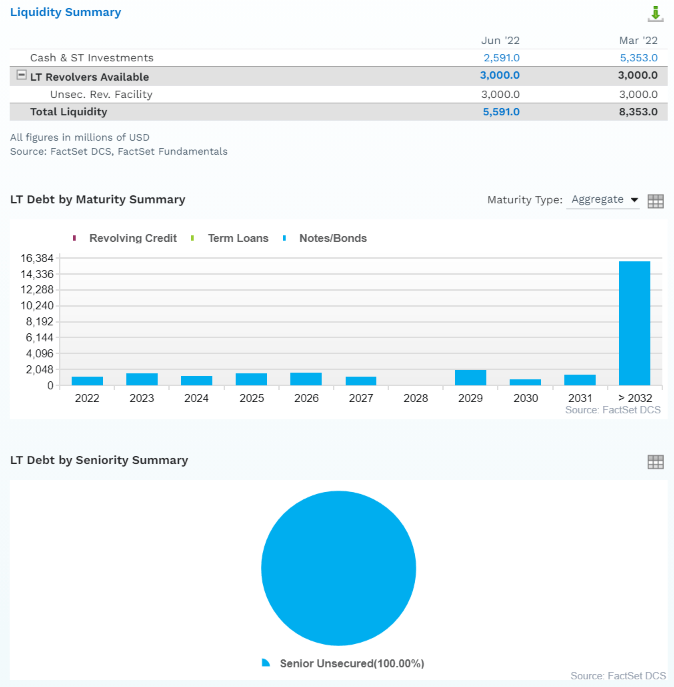
- $5.6 billion in liquidity
- well-staggered bond maturities (no issues refinancing maturing debt)
- 100% unsecured bonds (maximum financial flexibility)
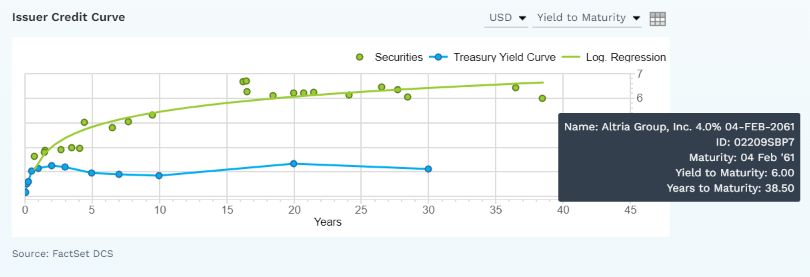
- bond investors are so confident in MO’s smoke-free future that they are willing to lend to it for 39 years at 6.0%
- the “smart money” on Wall Street thinks MO will still be around in 2061 to pay off its debt
MO Credit Default SWAPs: The Bond Market’s Real-Time Fundamental Risk Estimate
(Sources: FactSet Research Terminal)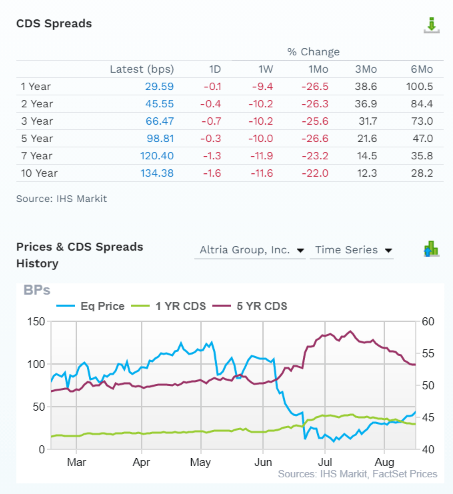
Credit default swaps are insurance policies taken out by bond investors in case a company defaults (goes bankrupt).
- they serve as a real-time fundamental risk assessment from “the smart money” on Wall Street
- including the latest news that can cause stock prices to be extremely volatile
- the modest increase in fundamental risk in the last six months
- MO’s 10-year CDS is still consistent with a BBB+ credit rating (4.03% 30-year bankruptcy risk)
- and its CDS are relatively stable over time, much more so than the stock price
The bond market agrees with analysts, management, and rating agencies that MO’s investment thesis is intact.
Profitability: Wall Street’s Favorite Quality Proxy
(Source: GuruFocus Premium)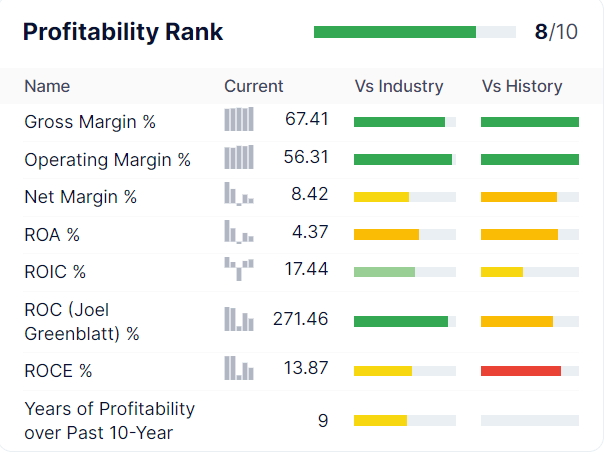
MO’s profitability is historically in the top 20% of its peers (a famously high-margin industry).
MO Trailing 12-Month Profitability Vs. Peers (Operating Results Only Due To JUUL Write Down)
| Metric | TTM | Industry Percentile | Major Tobacco Companies providers More Profitable Than MO (Out Of 50) |
| Gross Margins | 67.41% | 89.36 | 5 |
| Operating Margin | 56.31% | 95.83 | 2 |
| Returns On Invested Capital | 17.44% | 60.00 | 20 |
| Return On Capital (Greenblatt) | 271.46% | 92.00 | 4 |
| Average | 103.16% | 84.30 | 8 |
(Source: GuruFocus Premium)
JUUL’s $1.2 billion write-down is hammering some of MO’s profitability metrics, but its operating metrics still show one of the world’s greatest companies.
Ycharts
MO’s profitability has been stable for decades, and its free cash flow margins, which directly support the growing dividend, are in the top 5% of all global companies.
- 40%, nearly 2X that of Apple (AAPL)
MO Profit Margin Consensus Forecast
| Year | FCF Margin | EBITDA Margin | EBIT (Operating) Margin | Net Margin | Return On Capital Expansion |
Return On Capital Forecast |
| 2021 | 39.0% | 57.1% | 55.9% | 40.4% | 1.03 | |
| 2022 | 37.7% | 59.4% | 57.7% | 41.4% | TTM ROC | 271.46% |
| 2023 | 39.3% | 59.4% | 58.3% | 42.0% | Latest ROC | 485.82% |
| 2024 | 40.1% | 62.0% | 60.4% | 44.0% | 2027 ROC | 280.60% |
| 2025 | 38.1% | 58.5% | 57.8% | 42.4% | 2027 ROC | 502.18% |
| 2026 | NA | NA | NA | NA | Average | 391.39% |
| 2027 | NA | NA | NA | NA | Industry Median | 59.96% |
| 2028 | NA | NA | NA | NA | MO/Industry Median | 6.53 |
| Annualized Growth | -0.60% | 0.63% | 0.83% | 1.23% | Vs. S&P | 26.81 |
(Sources: FactSet Research Terminal)
MO’s incredible margins are expected to remain stable or grow in the coming years. That includes 42% net margins in 2025 and 38% free cash flow margins.
Its return on capital is expected to hit 6.5X its industry norm and 27X that of the S&P 500.
Returns on capital = annual pre-tax profit/operating capital (the money it takes to run the business).
- Joel Greenblatt’s gold standard of profitability and moatie-ness
- According to one of the greatest investors in history, MO’s quality is 27X greater than the average S&P 500 company
(Source: GuruFocus Premium)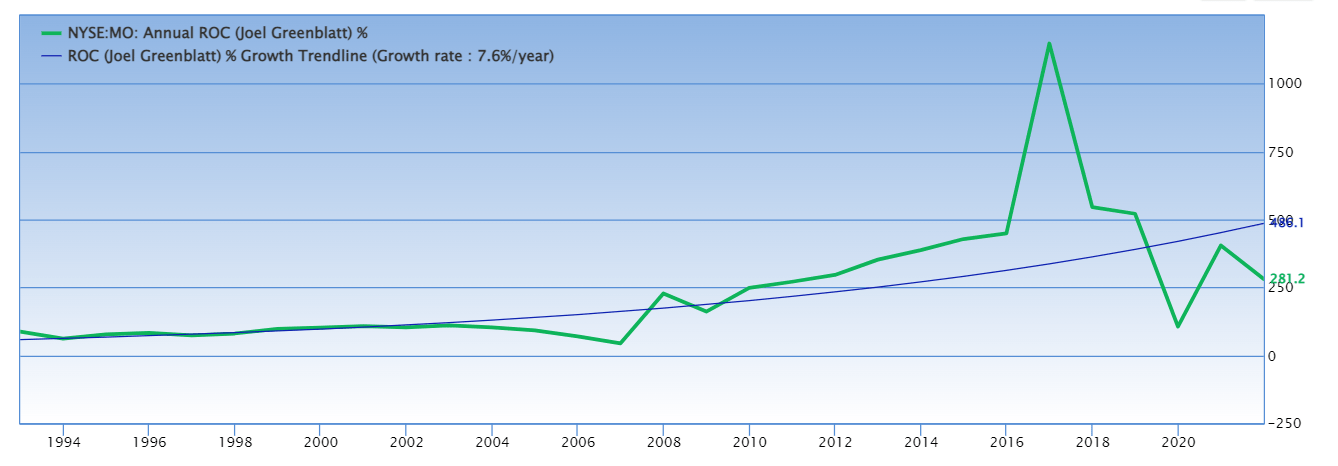
MO’s ROC has been doubling every decade for 30 years, confirming a wide and stable moat.
Reason Four: Slow But Steady Growth Prospects For Decades To Come
According to the Graham/Dodd fair value formula, a company trading at 8.6X cash-adjusted earnings is pricing in 0.2% CAGR growth. Here’s what analysts actually expect.
MO Medium-Term Consensus Forecast
| Year | Sales | Free Cash Flow | EBITDA | EBIT (Operating Income) | Net Income |
| 2021 | $21,111 | $8,236 | $12,044 | $11,807 | $8,519 |
| 2022 | $20,894 | $7,885 | $12,420 | $12,063 | $8,658 |
| 2023 | $21,513 | $8,444 | $12,777 | $12,540 | $9,046 |
| 2024 | $21,207 | $8,510 | $13,138 | $12,802 | $9,326 |
| 2025 | $21,461 | $8,173 | $12,555 | $12,407 | $9,094 |
| Annualized Growth | 0.41% | -0.19% | 1.04% | 1.25% | 1.65% |
| Cumulative Next 2022-2025 | $85,075 | $33,012 | $50,890 | $49,812 | $36,124 |
(Sources: FactSet Research Terminal)
MO is a slow-growing company, but it is growing.
| Metric | 2021 consensus growth | 2022 consensus growth | 2023 consensus growth | 2024 consensus growth |
| Sales | 2% | 1% | 2% | 0% |
| Dividend | 2% | 7% (Official) | 6% (Coming In August) | 7% (54-Year Dividend Growth Streak) |
| EPS | 6% | 5% | 5% | 5% |
| Operating Cash Flow | 1% | 7% | -1% | 3% |
| Free Cash Flow | 2% | 9% | -3% | 0% |
| EBITDA | 7% | 6% | 2% | 3% |
| EBIT (operating income) | 7% | 5% | 3% | 1% |
(Source: FAST Graphs, FactSet Research)
MO is expected to grow with clockwork-like dependability at 5% in the coming years.
This is a highly defensive, recession-resistant business model. The last time MO reported negative earnings growth was -2% in 2003.
MO Dividend Growth Consensus Forecast
| Year | Dividend Consensus | EPS/Share Consensus | EPS Payout Ratio | Retained (Post-Dividend) Earnings | Buyback Potential | Debt Repayment Potential |
| 2022 | $3.70 | $4.85 | 76.3% | $2,072 | 2.52% | 7.0% |
| 2023 | $3.92 | $5.10 | 76.9% | $2,126 | 2.58% | 7.1% |
| 2024 | $4.18 | $5.33 | 78.4% | $2,072 | 2.52% | 6.9% |
| Total 2022 Through 2024 | $11.80 | $15.28 | 77.2% | $6,270.96 | 7.61% | 20.92% |
| Annualized Rate | 6.3% | 4.8% | 1.4% | 0.0% | 0.0% | -0.6% |
(Sources: FactSet Research Terminal)
Rating agencies consider 85% to be a safe payout ratio for this industry.
- MO’s company policy is an 80% payout ratio
- PM’s policy is 75%
- BTI’s policy is 65%
MO’s $6.3 billion in post-dividend retained earnings through 2024 is enough to pay 21% off its current debt or buy back 8% of its stock at current valuations.
MO Buyback Consensus Forecast
| Year | Consensus Buybacks ($ Millions) | % Of Shares (At Current Valuations) | Market Cap |
| 2022 | $2,152 | 2.6% | $82,370 |
| 2023 | $1,660 | 2.0% | $82,370 |
| 2024 | $2,000 | 2.4% | $82,370 |
| 2025 | $3,000 | 3.6% | $82,370 |
| Total 2022 through 2025 | $8,812 | 10.7% | $82,370 |
| Annualized Rate | 2.79% | Average Annual Buybacks | $2,203 |
| 1% Buyback Tax | $88 | Average Annual Buyback Tax | $22 |
(Sources: FactSet Research Terminal)
Analysts expect MO to buy back $2.2 billion of its stock over the next four years, about 2.8% annually at current valuations.
Ycharts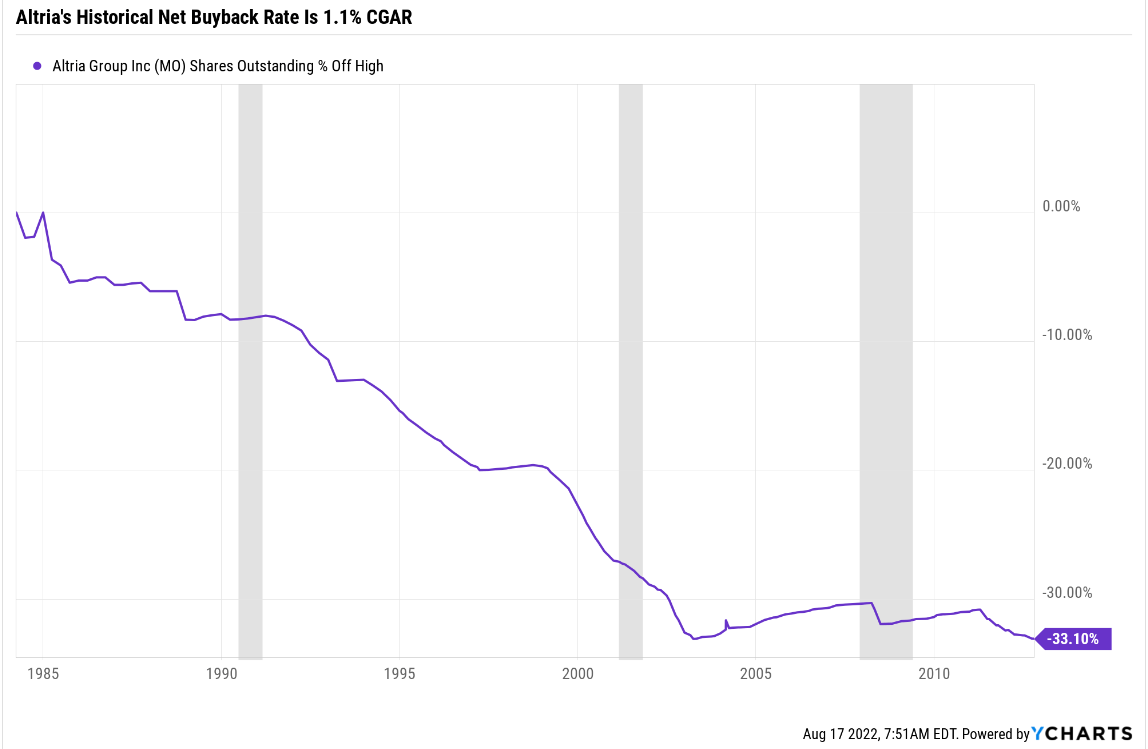
MO’s historical buyback rate since 1985 is 1.1% per year, but analysts think it will be much more aggressive in the future, similar to how it bought back 15% of shares during the Master Settlement period.
- the worst bear market in MO history, a 61% crash
| Time Frame (Years) | Net Buyback Rate | Shares Remaining | Net Shares Repurchased | Each Share You Own Is Worth X Times More (Not Including Future Growth And Dividends) |
| 5 | 2.8% | 86.81% | 13.19% | 1.15 |
| 10 | 2.8% | 75.35% | 24.65% | 1.33 |
| 15 | 2.8% | 65.41% | 34.59% | 1.53 |
| 20 | 2.8% | 56.78% | 43.22% | 1.76 |
| 25 | 2.8% | 49.29% | 50.71% | 2.03 |
| 30 | 2.8% | 42.79% | 57.21% | 2.34 |
| 35 | 2.8% | 37.14% | 62.86% | 2.69 |
| 40 | 2.8% | 32.24% | 67.76% | 3.10 |
| 45 | 2.8% | 27.99% | 72.01% | 3.57 |
| 50 | 2.8% | 24.30% | 75.70% | 4.12 |
| 55 | 2.8% | 21.09% | 78.91% | 4.74 |
| 60 | 2.8% | 18.31% | 81.69% | 5.46 |
(Sources: FactSet Research Terminal)
If MO buybacks stocks at the consensus rate, it could repurchase 57% of its stock over the next three decades and 82% of its shares over an investing lifetime.
- increasing your shares’ intrinsic value by 2.3X to 5.5X
- not counting dividend and earnings growth
MO Long-Term Growth Outlook
(Sources: FactSet Research Terminal)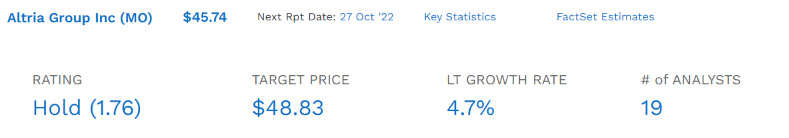
- 4.3% to 4.7 CAGR growth consensus (from five sources)
- 4.7% median consensus from all 19 analysts
How accurate is the management guidance that these forecasts are based on?
FAST Graphs, FactSet Research
Other than the pandemic, MO hasn’t missed 2-year estimates in a decade.
Margins of error of 10% to the upside and 5% to the downside.
- 4% to 6% CAGR margin-of-error adjusted growth consensus range
- 70% statistical probability that MO grows at 4% to 6% over time
FAST Graphs, FactSet Research FAST Graphs, FactSet Research FAST Graphs, FactSet Research FAST Graphs, FactSet Research
Faster volume declines in the U.S. are expected to result in 3% slower growth than in the past.
- which is why we use the low end of the historical 14 to 16 P/E market-determined fair value range
- 14 P/E requires just 2.75% CAGR growth according to the Graham/Dodd fair value formula
Reason Five: A Wonderful Company At A Wonderful Price
(Source: FAST Graphs, FactSet) (Source: FAST Graphs, FactSet) (Source: FAST Graphs, FactSet)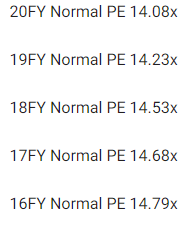
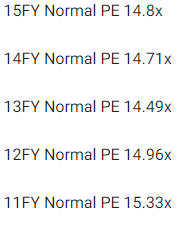

For 20 years, hundreds of millions of income investors have paid between 14 and 16X earnings for MO outside of bear markets and bubbles.
- 91% statistical probability that this approximates intrinsic value
| Metric | Historical Fair Value Multiples (all-years) | 2021 | 2022 | 2023 | 2024 | 2025 |
12-Month Forward Fair Value |
| 25-year average yield | 5.42% | $64.94 | $66.42 | $66.42 | $78.04 | $78.78 | |
| Earnings | 14.08 | $64.91 | $68.15 | $71.53 | $76.74 | $77.16 | |
| Average | $64.93 | $67.27 | $68.88 | $77.38 | $68.29 | $68.29 | |
| Current Price | $45.74 | ||||||
|
Discount To Fair Value |
29.55% | 32.01% | 33.59% | 40.89% | 33.02% | 33.02% | |
|
Upside To Fair Value (NOT Including Dividends) |
41.95% | 47.08% | 50.59% | 69.18% | 49.31% | 49.31% (59% including dividend) | |
| 2022 EPS | 2023 EPS | 2021 Weighted EPS | 2022 Weighted EPS | 12-Month Forward EPS | 12-Month Average Fair Value Forward PE |
Current Forward PE |
|
| $4.84 | $5.08 | $1.77 | $3.22 | $4.99 | 13.7 | 9.2 |
I conservatively estimated that MO is historically worth 13.7X earnings and today trades at 9.2X.
- 8.6X cash-adjusted P/E
- priced for 0.2% CAGR growth
- Vs. 4.7% CAGR consensus
|
Analyst Median 12-Month Price Target |
Morningstar Fair Value Estimate |
| $48.83 (9.8 PE) | $52.00 (10.4 PE) |
|
Discount To Price Target (Not A Fair Value Estimate) |
Discount To Fair Value |
| 6.33% | 12.04% |
|
Upside To Price Target (Not Including Dividend) |
Upside To Fair Value (Not Including Dividend) |
| 6.76% | 13.69% |
|
12-Month Median Total Return Price (Including Dividend) |
Fair Value + 12-Month Dividend |
| $52.43 | $55.60 |
|
Discount To Total Price Target (Not A Fair Value Estimate) |
Discount To Fair Value + 12-Month Dividend |
| 12.76% | 17.73% |
|
Upside To Price Target ( Including Dividend) |
Upside To Fair Value + Dividend |
| 14.63% | 21.56% |
Morningstar’s fair value estimate of 10.4X earnings is 91% likely to be too low.
FAST Graphs, FactSet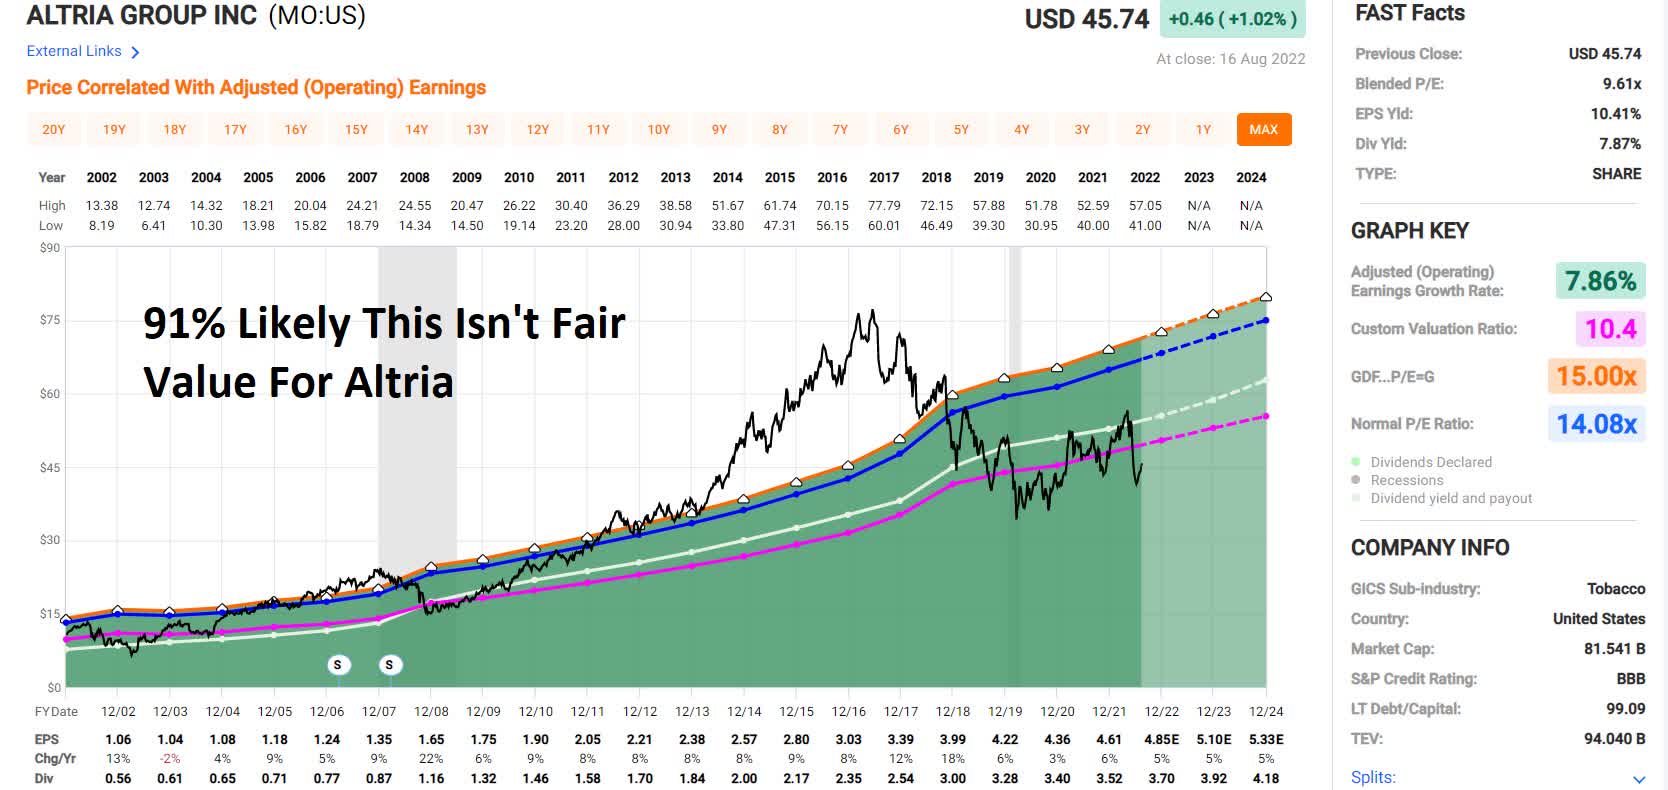
Unless you think a company can spend 10+ years above fair value and only return to them at the worst bear market lows, Morningstar’s fair value estimate is too conservative.
Analysts expect the P/E to modestly expand to 9.2X in 12 months, delivering a 15% total return within a year.
I don’t recommend companies based on 12-month forecasts but on the margin of safety and whether or not it sufficiently compensates you for a company’s risk profile.
Margin Of Safety Not 12-Month Price Targets Are How I Make Investment Decisions
| Rating | Margin Of Safety For Medium-Risk 13/13 Quality Ultra SWANs | 2022 Fair Value Price | 2023 Fair Value Price |
12-Month Forward Fair Value |
| Potentially Reasonable Buy | 0% | $67.27 | $68.88 | $68.29 |
| Potentially Good Buy | 5% | $63.91 | $65.44 | $64.88 |
| Potentially Strong Buy | 15% | $57.18 | $58.55 | $58.05 |
| Potentially Very Strong Buy | 25% | $47.93 | $51.66 | $51.22 |
| Potentially Ultra-Value Buy | 35% | $43.73 | $44.77 | $44.39 |
| Currently | $45.74 | 32.01% | 33.59% | 33.02% |
| Upside To Fair Value (Not Including Dividends) | 47.08% | 50.59% | 49.31% |
For anyone comfortable with its risk profile, MO is a potentially very strong buy and just 2% above its Ultra Value, Buffett-style “Fat pitch” buy price.
Risk Profile: Why Altria Isn’t Right For Everyone
There are no risk-free companies, and no company is right for everyone. You have to be comfortable with the fundamental risk profile.
What Could Cause MO’s Investment Thesis To Break
- safety falls to 40% or less
- balance sheet collapses (potentially due to very poorly thought out M&A deals)
- failure of the smoke-free future plans (such as PM pulling the iQos agreement and the collapse of its RRP plans)
- growth outlook falls to -0.5% for seven years (8.5% yield in August)
- MO’s role in my portfolio is to deliver long-term 8+% returns with minimal fundamental risk
- Defensive sector return targets: 8+%
- like all non-defensive sectors (anything that’s not REITs, utilities, midstream, healthcare, telecom, consumer staples), I target 10+% long-term return potential for all recommendations
How long it takes for a company’s investment thesis to break depends on the quality of the company.
| Quality |
Years For The Thesis To Break Entirely |
| Below-Average | 1 |
| Average | 2 |
| Above-Average | 3 |
| Blue-Chip | 4 |
| SWAN | 5 |
| Super SWAN | 6 |
| Ultra SWAN | 7 |
| 100% Quality Companies (LOW and MA) | 8 |
These are my personal rule of thumb for when to sell a stock if the investment thesis has broken.
MO is highly unlikely to suffer such catastrophic declines in fundamentals.
MO’s Risk Profile Summary
Investors in tobacco companies should have the stomach for fat-tail risk, particularly those holding shares in a single-market pure play like Altria. Overall, we believe the risk of a significant adverse event is lower than it was one or two decades ago, but the shifting sands of regulation have created some new risks to Altria’s business model in recent years and our uncertainty rating is medium.
Litigation risk still remains, but adverse judgments have been manageable recently. While it is almost impossible to forecast the magnitude of any awards against the tobacco industry, we expect payouts to be within Altria’s annual free cash flow.
The FDA regulates the tobacco industry in the U.S. The recent ban on flavored nicotine liquids demonstrates the FDA is willing to take significant steps to prevent the uptake of nicotine products by new consumers. The menthol cigarette category has had the sword of Damocles hanging over it for several years, although prohibition is yet to come to fruition. We estimate that 20% of Altria’s revenue and operating profit is generated in the menthol category, although it is likely that most menthol volume would switch to non-menthol in the event of a ban. The potential for limits on the nicotine levels in cigarettes is a relatively new risk, with the FDA announcing in the summer of 2017 that it will investigate the potential for nicotine control. We do not believe such controls are a foregone conclusion, however, because it could have unforeseen consequences such as increasing cigarette volumes.
The social impact of tobacco products is rated as a severe risk in Sustainalytics’ ESG risk rating of Altria. We assume a mid-single-digit volume decline rate in the cigarette industry, but we flex this assumption in our scenario analysis to reflect the risk that the decline rate could accelerate. Although the externalities of smoking have largely been internalized, the risk remains of increased taxation and/or operating costs.– Morningstar (emphasis added).
MO’s Risk Profile Includes
- regulatory risk (plain packaging laws, menthol ban, nicotine level regulation, reduced risk product taxation)
- smoke-free transition execution: 1-year setback in iQos rollout due to BTI patent lawsuit; if PM decides to end that agreement, MO would have a harder time achieving its smoke-free future plans
- margin compression risk: RRPs could have lower margins than legacy products
- M&A execution risk (Juul and Cronos investments thus far have not gone well)
- labor retention risk (tightest job market in over 50 years)
One of MO’s biggest risks is that it doesn’t scale up reduced-risk product sales as quickly as its peers.
- PM plans 50% of sales from RRPs by 2025
- analysts expect just 14% from MO
- MO’s smoke-free future plans are very dependent on the success of iQos in the US
- IQOS’s US launch has been pushed back by 1 year due to BTI’s lawsuit
- analysts still expect PM to honor its iQos licensing deal with MO but the risk of PM going it alone isn’t zero
MO could buy Swedish Match to neutralize the threat, pushing its net debt/EBITDA to 3.2X.
Acquisitions are a riskier strategy for RRPs, as Altria has learned with JUUL.
How do we quantify, monitor, and track such a complex risk profile? By doing what big institutions do.
Long-Term Risk Analysis: How Large Institutions Measure Total Risk
- see the risk section of this video to get an in-depth view (and link to two reports) of how DK and big institutions measure long-term risk management by companies
MO Long-Term Risk Management Consensus
| Rating Agency | Industry Percentile |
Rating Agency Classification |
| MSCI 37 Metric Model | 58.0% |
BBB, Average, Positive Trend |
| Morningstar/Sustainalytics 20 Metric Model | 55.6% |
24.0/100 Medium Risk |
| Reuters’/Refinitiv 500+ Metric Model | 98.3% |
Above-Average, Stable Trend |
| S&P 1,000+ Metric Model | 36.0% |
Below-Average, Negative Trend |
| FactSet | 30.0% |
Below-Average, Positive Trend |
| Morningstar Global Percentile (All 15,000 Rated Companies) | 60.6% | Very Good |
| Consensus | 56% |
Medium Risk, Average Risk-Management, Stable Trend |
(Sources: MSCI, Morningstar, S&P, FactSet)
MO’s Long-Term Risk Management Is The 326th Best In The Master List (35th Percentile)
| Classification | Average Consensus LT Risk-Management Industry Percentile |
Risk-Management Rating |
| S&P Global (SPGI) #1 Risk Management In The Master List | 94 | Exceptional |
| Strong ESG Stocks | 78 |
Good – Bordering On Very Good |
| Foreign Dividend Stocks | 75 | Good |
| Ultra SWANs | 71 | Good |
| Low Volatility Stocks | 68 | Above-Average |
| Dividend Aristocrats | 67 | Above-Average |
| Dividend Kings | 63 | Above-Average |
| Master List average | 62 | Above-Average |
| Hyper-Growth stocks | 61 | Above-Average |
| Monthly Dividend Stocks | 60 | Above-Average |
| Dividend Champions | 57 | Average |
| Altria | 56 | Average |
(Source: DK Research Terminal)
MO’s risk-management consensus is in the bottom 35% of the world’s highest quality companies and similar to that of such other blue-chips as:
- Realty Income (O): Ultra SWAN dividend aristocrat
- Chevron (CVX): dividend aristocrat
- General Dynamics (GD): dividend aristocrat
- Raytheon (RTX): dividend champion
- Broadcom (AVGO)
- Norfolk Southern (NSC)
The bottom line is that all companies have risks, and MO is average at managing theirs.
How We Monitor MO’s Risk Profile
- 19 analysts
- 3 credit rating agencies
- 5 total risk rating agencies
- 24 experts who collectively know this business better than anyone other than management
- and the bond market for real-time fundamental risk assessments when news breaks
When the facts change, I change my mind. What do you do, sir?” – John Maynard Keynes
There are no sacred cows at iREIT or Dividend Kings. Wherever the fundamentals lead, we always follow. That’s the essence of disciplined financial science, the math behind retiring rich and staying rich in retirement.
Bottom Line: Buy Altria Before August 26th, Before Everyone Else Does
You might think that a fat dividend hike from one of the highest yielding blue-chips in the world would lead to a nice healthy pop in the stock price. Altria’s fundamentals certainly justify that.
But remember that luck is 33X as powerful as fundamentals in the short-term, and only in the long-term are fundamentals 33X as powerful as luck.
In 2014 MO soared 17% after its August dividend hike, and in 2013 it jumped 10% within three months.
But in 2020, it fell 12% after its annual hike, and in 2018 it fell 9%.
I’m not a market timer, and I’m NOT saying that you should buy MO because it’s a great way to earn a quick double-digit gain.
I am saying that if you buy it today, you’re potentially locking in a very safe 8.5% yield and 13.2% long-term return potential. Even if the PE never rises above 9.2 again, those are the returns you’ll earn on an 8.5% yielding investment growing at 4.7% per year over the long-term.
And while the future is never certain, for any company, MO is one of the most predictable and stable businesses on earth. Outside of the pandemic, it hasn’t missed two-year earnings forecasts in a decade and the only year of negative growth was -2% in 2003.
MO has a solid long-term plan to transition to a smoke-free future in which the bond market has such confidence that they are willing to lend money to MO out to 2061. This is a company that’s build to last and will likely outlive us all.
This is why I’m highly confident that Altria today represents a potentially rich retirement dream dividend king.
For year after year, decade after decade, Altria has been delivering the dividend goods for high-yield income investors. That includes 17% annual returns through decades of regulatory trials and tribulations and existential threats that were even more severe than it faces today.
While there are no guarantees on Wall Street, there are 80% confidence “fat pitches,” and Altria most certainly represents one of those.
That’s why I bought some more before its 53rd consecutive annual dividend hike, and you might want to do the same.
Buy Altria today for a very safe 8.5% yield, and your retirement will thank you.
Be the first to comment