

BTCUSD: Grinding above $40K Support
Bitcoin is currently struggling to keep itself above the $40k support and the price is oscillating between the Fibonacci levels of $41472 and 100-day moving average of $42834. It remains in accumulation mode in the London trading session. BTC bullish sentiment was seen at the opening of this week when it touched a high of $44304. Long-term outlook for bitcoin appears bullish and the short-term decline currently reinforces a mild bearish trend formation.
- The relative strength index (14-day) and ultimate oscillator are both indicating a SELL at the current market levels of $41745.
- A short-term correction below $40000 is expected before the continuation of the bullish trend.
- Simple and exponential moving averages indicate a strong SELL.
- Average true range (14-day) indicates high volatility.
Bitcoin Short-Term Bearish Formations
Bitcoin saw a mixed start this week and there is no sign of a bullish momentum. The 100 day moving average is indicating a strong SELL.
The immediate targets would be breaching the classic support levels at $41243 and further moving towards the next major support located at $35819.
Bitcoin is witnessing increased volatility after China banned all crypto transactions during the previous weekly closing on Friday. The support that is holding this week could be broken and bitcoin could start a further decline this week pushing below the psychological support level of $40000.
In the last 24hrs, BTCUSD has dropped by -4.76% (+2087$) and has a 24hr trading volume of USD 31.47 billion.
Bitcoin Sell-Off Continues
Bitcoin is facing selling pressure after the China ban and the trading volumes are high at the Asian exchanges today.
Also, many crypto currency exchanges are closing their Chinese accounts, leading to a withdrawal of funds in the US dollars and putting a selling pressure on BTCUSD.
Technical Indicators:
Relative strength index (14-day): at 32.442 with a SELL
Ultimate oscillator: at 40.38 with a SELL
Moving averages convergence divergence (12,26): at -370.10 with a SELL
Price of rate change ROC: at -2.31 indicating a SELL
XRPUSD – Ripple Below Pivot and MA
Ripple is currently moving below its pivot point at 0.93015 and its 100-day moving average of 0.9444. After witnessing a bullish opening this week with the XRPUSD touching an intraday high at 0.9814 in the Asian trading session on Monday, the pair is back to bearish divergence as indicated by the Relative strength index of 14 days. XRPUSD is now moving below the 200 hourly exponential moving average. Ripple would need to cross the major resistance located at 0.9548.
- Ripple is indicating a bearish divergence with the commodity channel index of 14 days.
- Selling pressure is seen above 0.9500 levels.
- Staying below both the 100 hourly simple and exponential moving averages.
- The pair is expected to fall with a breakdown of support levels at 0.8655.
Ripple Continues Bearish Channel
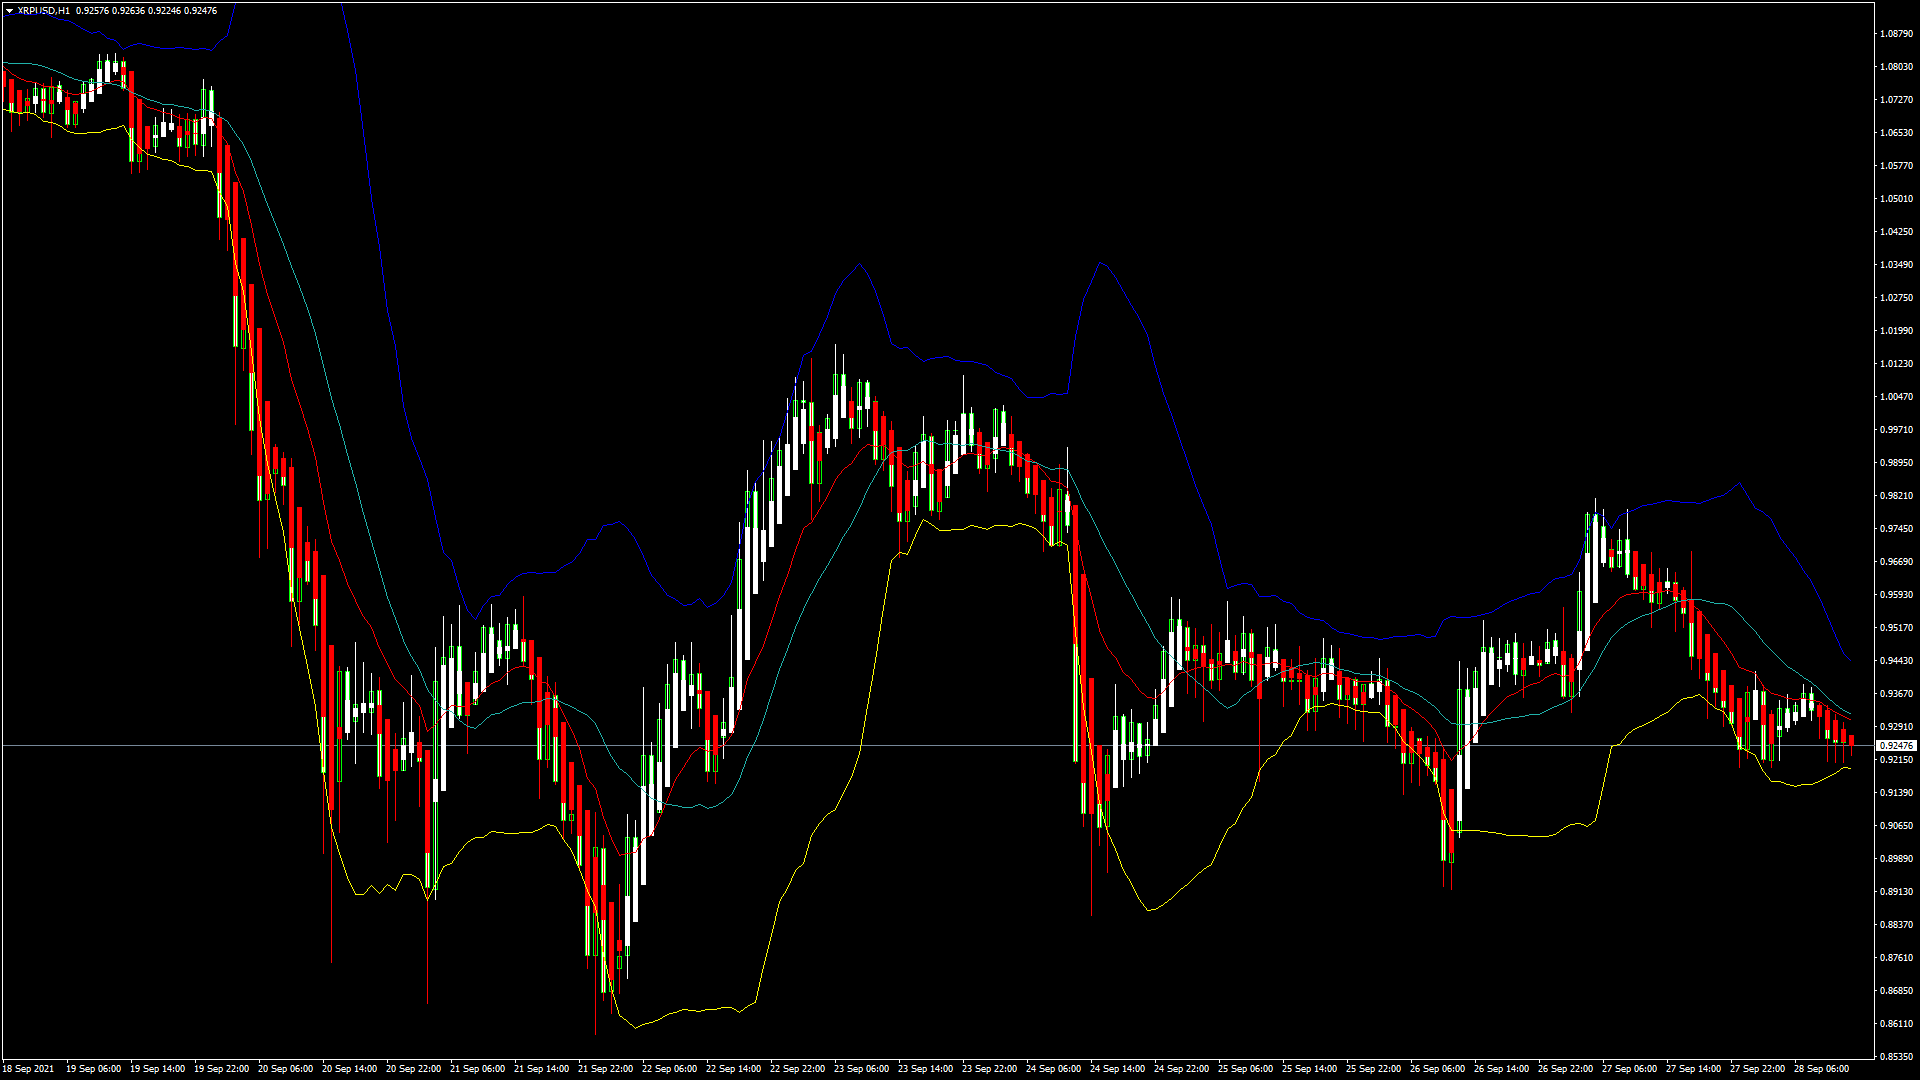
Ripple is moving close to testing the classic support levels of 0.9250 and a further decline could start if the price breaks this today. The volatility in the Ripple is lower today and, after the cancellation of the bullish trend yesterday, we can see further corrections towards the 0.9110 levels.
XRP has lost -4.13% with a price change of -$0.03978 in the past 24hrs and has a trading volume of 2.66 billion USD.
The Week Ahead
Ripple started the week on a bullish tone but failed to break the major resistance located at 0.9548. The price is now ranging between the Fibonacci levels of 0.9161 and 100 hourly moving average of 0.9444.
Once the ban on crypto currency transactions was imposed by the Peoples Bank of China, we can now observe a low demand for Ripple which is primarily being used to settle the bank-to-bank transactions in real time. Since the ban came into effect, the market liquidity has been on a decline, and the number of XRP transactions is going down by the hour.
This week XRPUSD is expected to close below 0.9050. The bearish trend is expected to continue in the week.
Technical Indicators:
Moving averages convergence divergence (12,26): at -0.004 indicating a SELL.
100 hourly moving average: at 0.9444 indicating a STRONG SELL.
Ultimate oscillator: at 47.61 indicating a SELL.
Relative strength indicator (14-day): at 44.40 indicating a SELL.

Be the first to comment