

British Pound, GBP/USD, GBP/JPY Talking Points:
- It was a big start to the week for the British Pound, with both GBP/USD and GBP/JPY finding resistance at interesting technical areas on their respective charts.
- GBP/USD put in yet another resistance inflection off of the 1.4000 psychological level.
- The analysis contained in article relies on price action and chart formations. To learn more about price action or chart patterns, check out our DailyFX Education section.
We’re only halfway through the week and already, it’s been a big outing for the British Pound. GBP/USD put in a strong jump on Monday as the pair pushed up to the same 1.4000 level that’s rebuked multiple advances over the past couple of months. GBP/JPY put in a strong bullish reaction off of a key support area, but a large portion of that has already been priced-out. And in EUR/GBP, the pair put in a trend-side move as GBP-strength showed through to help push the pair to a fresh weekly low.
GBP/USD Tries to Get Back into Bullish Trend
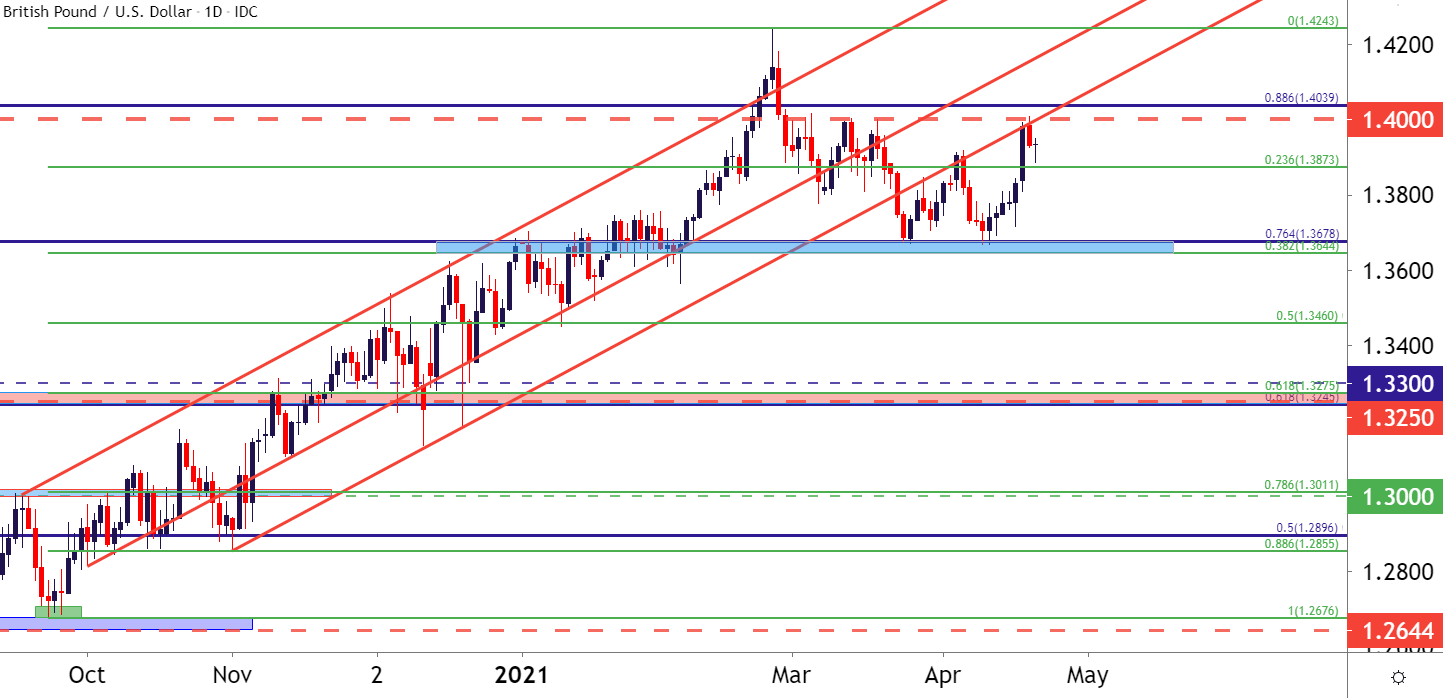
Coming into the month of March, GBP/USD was one of the cleaner major pairs, sticking inside of a bullish trend channel for much of the prior five months. That channel broke in late March, however, as US Dollar strength ran aggressively into the end of Q1.
But support showed up just a little lower, from the confluent Fibonacci levels around 1.3644-1.3678. This zone was tested a couple of weeks later, and that second inflection brought out the bulls with each day last week seeing gains. That continued through this week’s open with price action jumping up to the confluent area around the 1.4000 handle.
The underside of the bullish channel projected to right around that 1.4000 spot, and that came in to hold the highs on Monday and Tuesday.
To learn more about psychological levels, join us in DailyFX Education
GBP/USD Daily Price Chart
Chart prepared by James Stanley; GBPUSD on Tradingview
On a shorter-term basis, the search for higher-low support continues. I had looked at this in yesterday’s webinar, plotting for such potential around the 1.3873 Fibonacci level. From the four-hour chart below, it’s not yet evident that the low is in; but if 3873 can’t hold the lows, there’s a deeper area of support potential around the 1.3800 level.

Recommended by James Stanley
Get Your Free Top Trading Opportunities Forecast
GBP/USD Four-Hour Price Chart
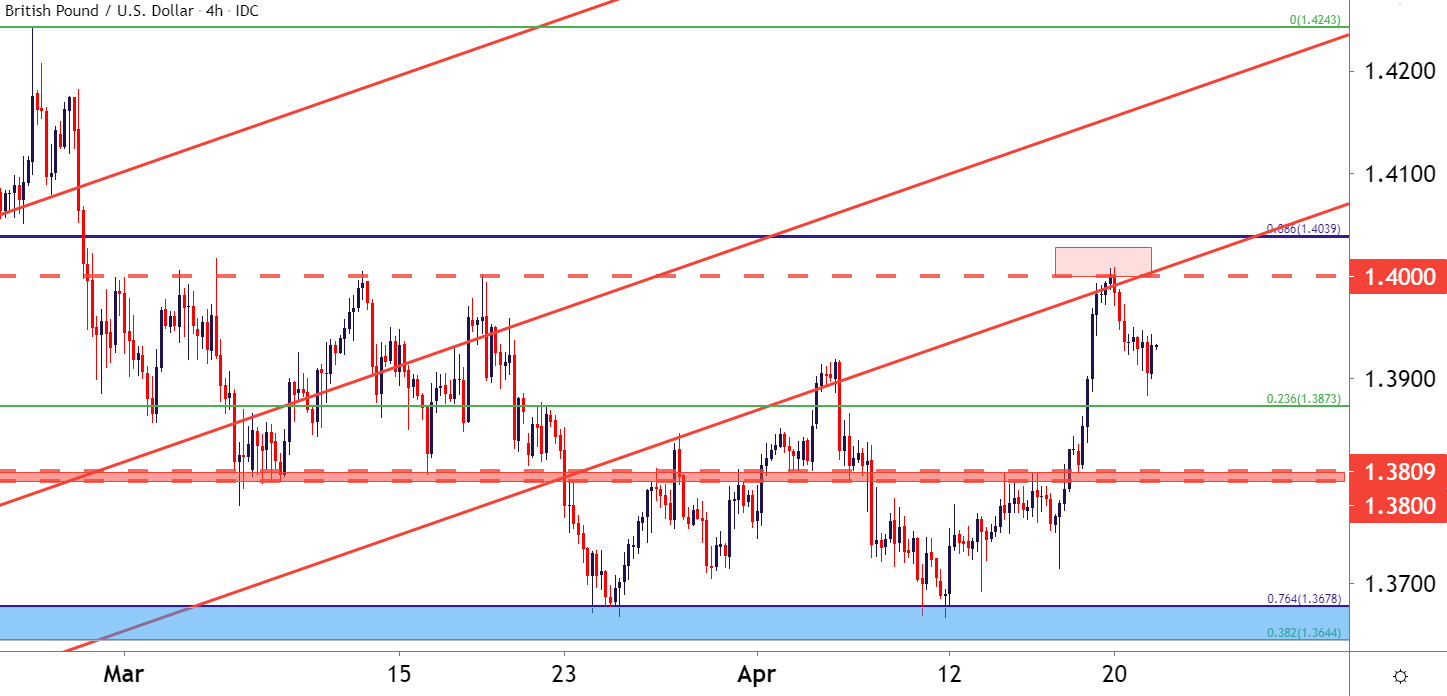
Chart prepared by James Stanley; GBPUSD on Tradingview
GBP/JPY Sticking to the Channel
That early-week flare of strength in Sterling helped GBP/JPY come back to life, as well. The formerly high-flying trend began to shake in mid-March, but the pair set a fresh two-year-high around the start of Q2. Prices quickly pulled back to the 150.00 psychological level, where a bit of grind developed until price action began to bump-higher earlier this week.
That bullish bump caught resistance on the mid-line, after which prices pulled back to support around the 150.00 handle.
GBP/JPY Four-Hour Price Chart
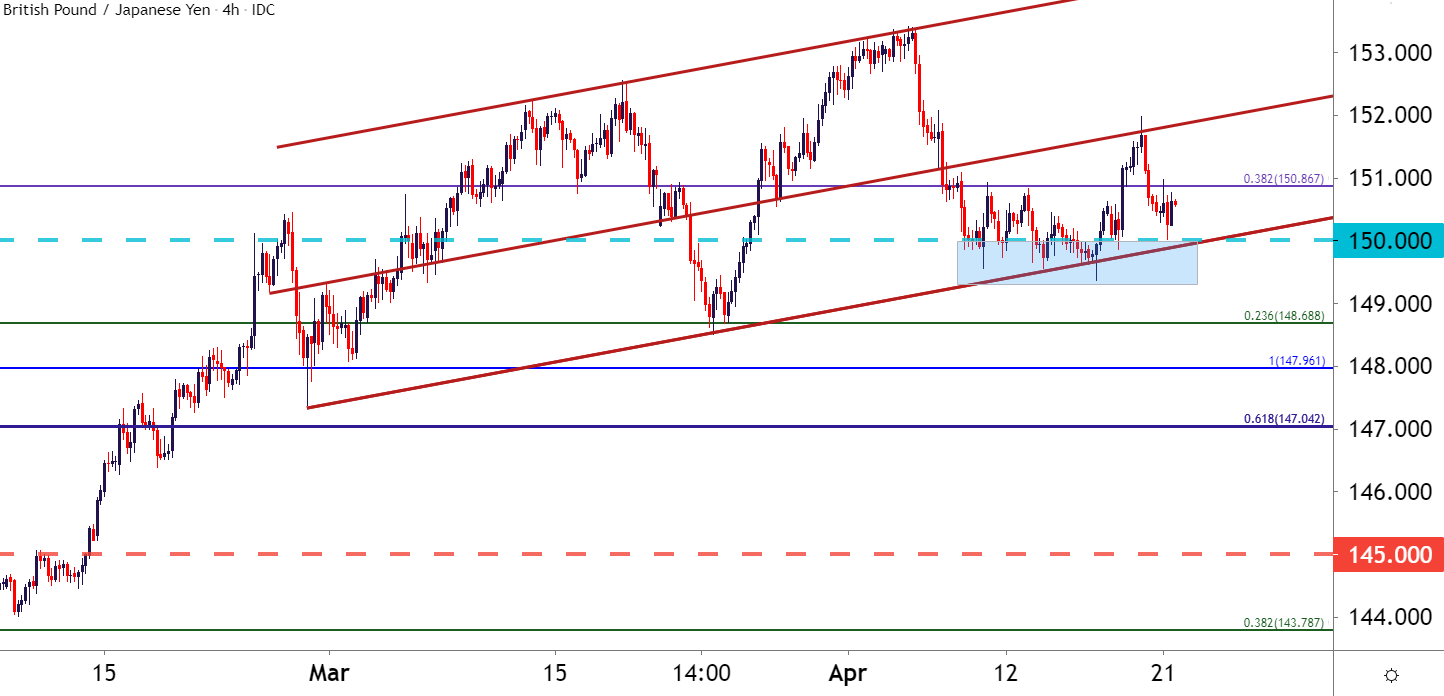
Chart prepared by James Stanley; GBPJPY on Tradingview
— Written by James Stanley, Strategist for DailyFX.com
Contact and follow James on Twitter: @JStanleyFX
Be the first to comment