

British Pound, Sterling, GBP, GBP/USD, GBP/JPY, EUR/GBP Talking Points:
- It’s been a surprising run of strength for GBP so far in the New Year.
- GBP/JPY continues to breakout as GBP/USD has recently joined the party. EUR/GBP has taken out a key spot on the chart as GBP-strength continues to outpace the Euro.
- The analysis contained in article relies on price action and chart formations. To learn more about price action or chart patterns, check out our DailyFX Education section.
We’re now half-way through the first quarter of 2021 and it’s been a fairly surprising show of strength so far in the British Pound. The currency is currently trading at a two-year-high against the US Dollar, and earlier this morning made a fast run at the 1.4000 level but fell just short. That strength has also been on full display against both the Japanese Yen and the Euro, with each of GBP/JPY and EUR/GBP continuing to break in the direction of Sterling strength.
GBP/USD Breaks Out from Wedge
Coming into February, GBP/USD had built in to a very clear rising wedge formation, with resistance holding at a key spot on the chart. With USD-strength continuing to hold, and with GBP/USD bulls thwarted at confluent resistance for more than a couple of weeks, it looked as though GBP/USD might soon turn-lower, as rising wedges are often approached with the aim of bearish reversals.
But last week saw a strong bullish response as GBP/USD price action flew through that resistance; and that continued to run into this week as the pair made a fast march towards the psychological 1.4000 handle.

Recommended by James Stanley
Check out our British Pound Guide
GBP/USD Daily Price Chart

Chart prepared by James Stanley; GBPUSD on Tradingview
On a shorter-term basis, that bullish breakout retains healthy construction as shown by a continued series of higher-highs and lows. Price action has pulled back for a test of support around prior resistance, from around 1.3866. A bit lower is another zone of possible higher-low support for bullish trend continuation, and this plots from 1.3759-1.3773, and below that is the big zone of prior resistance which hasn’t really shown much for support yet, and this plots from 1.3621-1.3714. That area could be of particular interest for longer-term trend scenarios, and it may not come into play until after a 1.4000 test shows around the psychological level.
To learn more about psychological levels, check out DailyFX Education
GBP/USD Four-Hour Price Chart
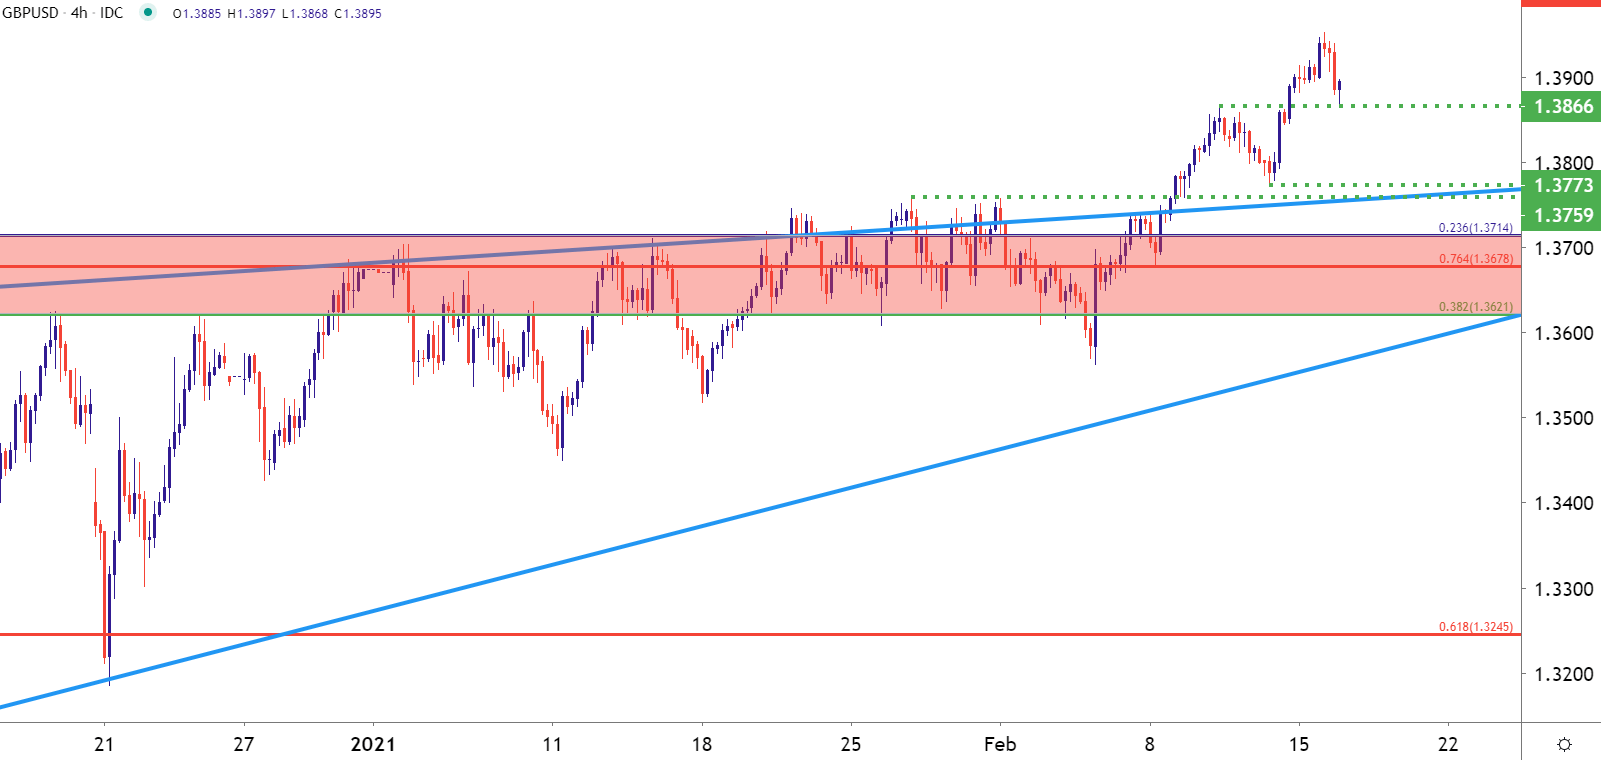
Chart prepared by James Stanley; GBPUSD on Tradingview
GBP/JPY Breaks Out
A recent ramp of Sterling strength combined with a very weak Japanese Yen has led to a one-sided move in the GBP/JPY pair of recent, with the pair bumping up to a fresh yearly-high.
Coming into 2021, GBP/JPY had spent the bulk of last year digesting into a symmetrical triangle, often a signal of digestion ahead of a really big move.
To read more about the symmetrical triangle, check out DailyFX Education
That triangle began to give way in the New Year, and buyers really took hold around mid-January. Prices have crossed another watermark today by testing above the 147.00 level, but the concern at this point would be just how overbought the pair has become. Daily RSI on the below chart is at its highest level since September of 2017.
GBP/JPY Daily Price Chart
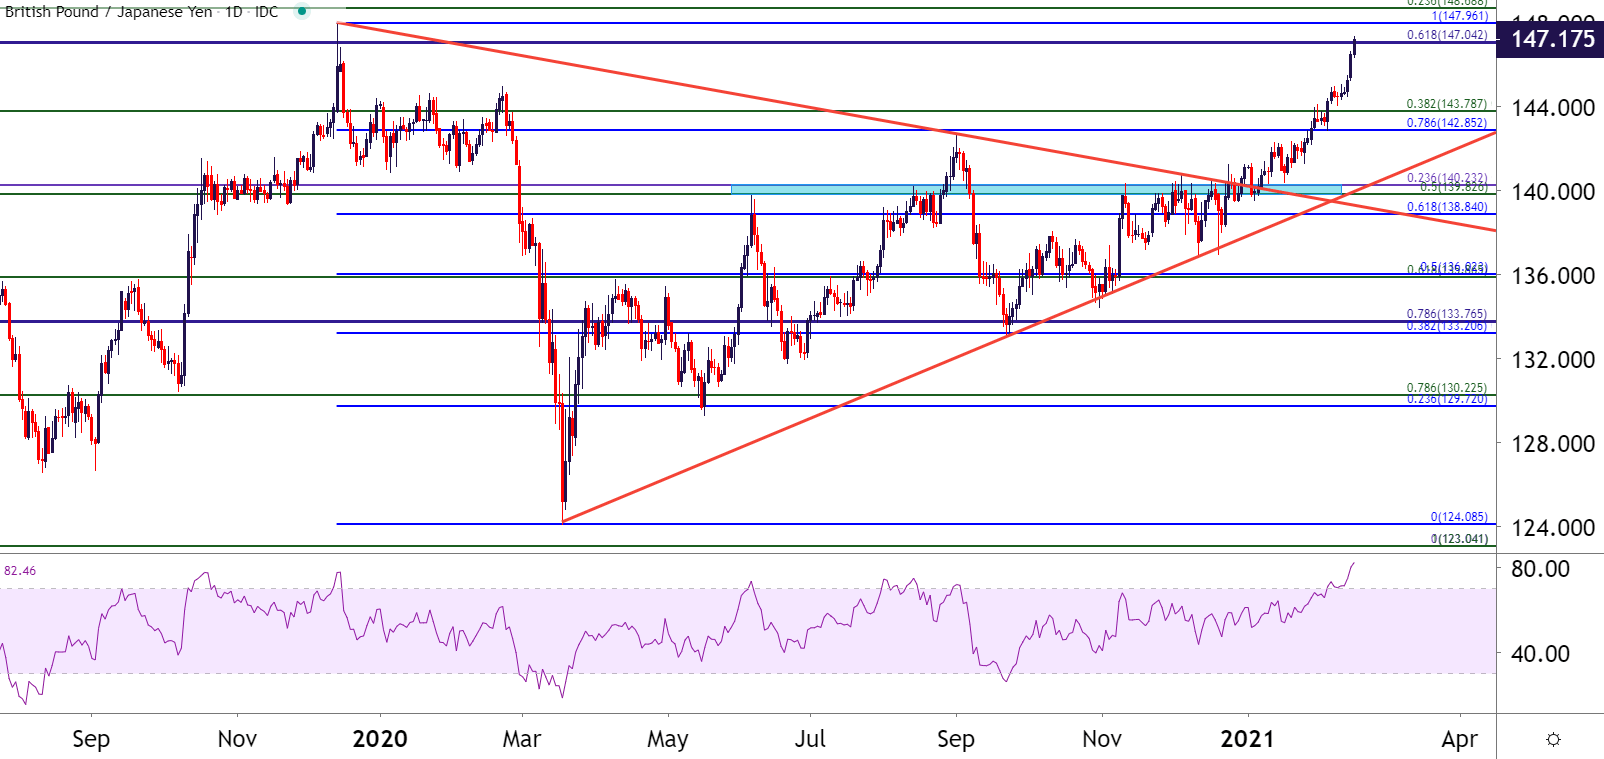
Chart prepared by James Stanley; GBPJPY on Tradingview
On a shorter-term basis, GBP/JPY is relatively far away from any nearby support with the most recent swing-low showing around 146.32. A bit below that is another area of potential support around the 145.00 psychological level.

Recommended by James Stanley
Check out some top ideas from DailyFX for 2021
GBP/JPY Four-Hour Price Chart
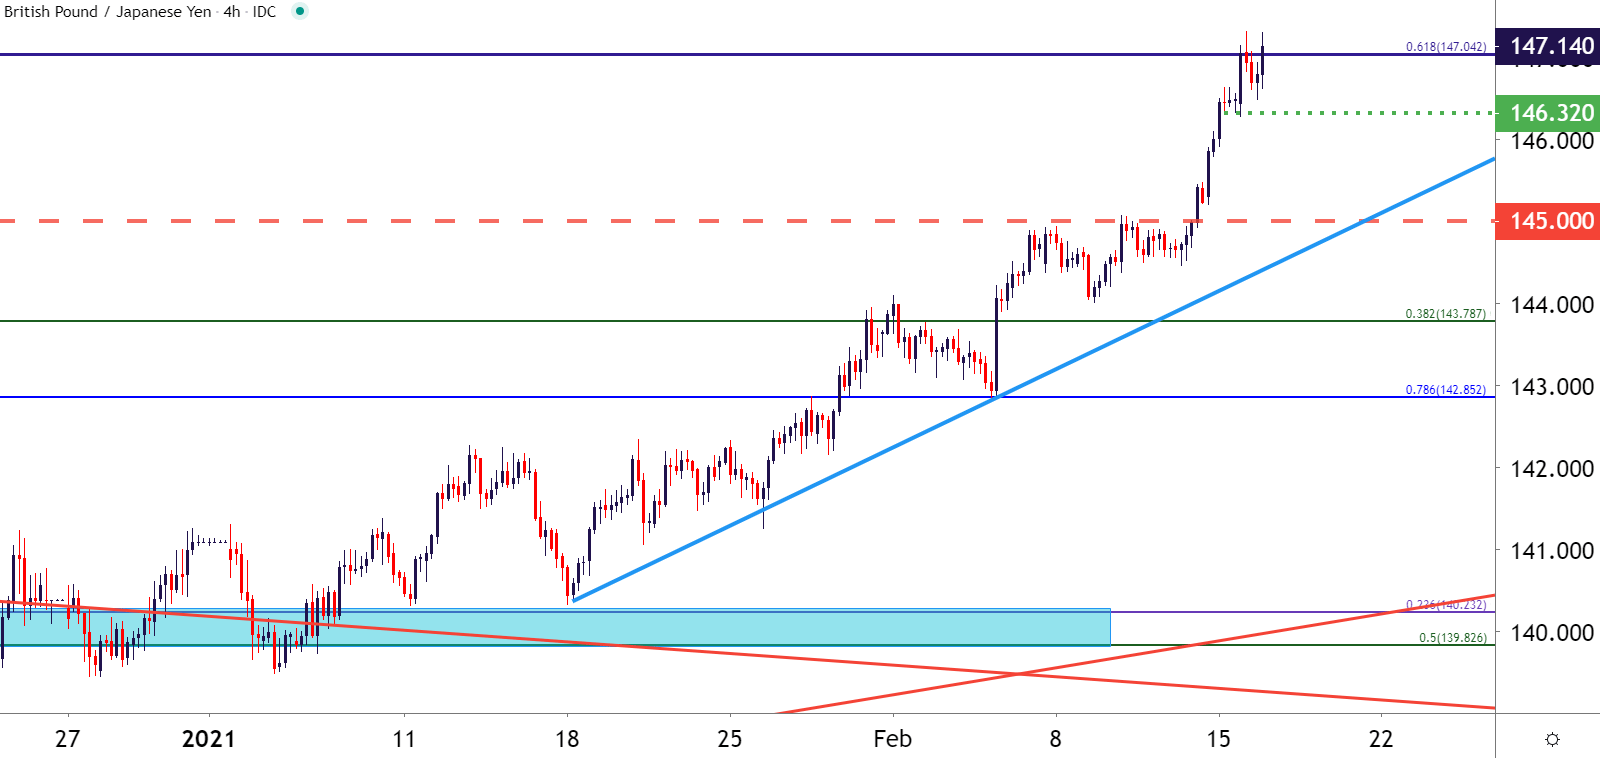
Chart prepared by James Stanley; GBPJPY on Tradingview
EUR/GBP: Sharp Breakdown in 2021
The past couple of months have brought an abnormally directional trend in EUR/GBP as Sterling strength has run-over Euro-weakness since late-December. The pair had found support around the 61.8% retracement of the 2019-2020 major move, but over the past few weeks that’s been taken-out rather aggressively to set a fresh nine-month low.
EUR/GBP Daily Price Chart
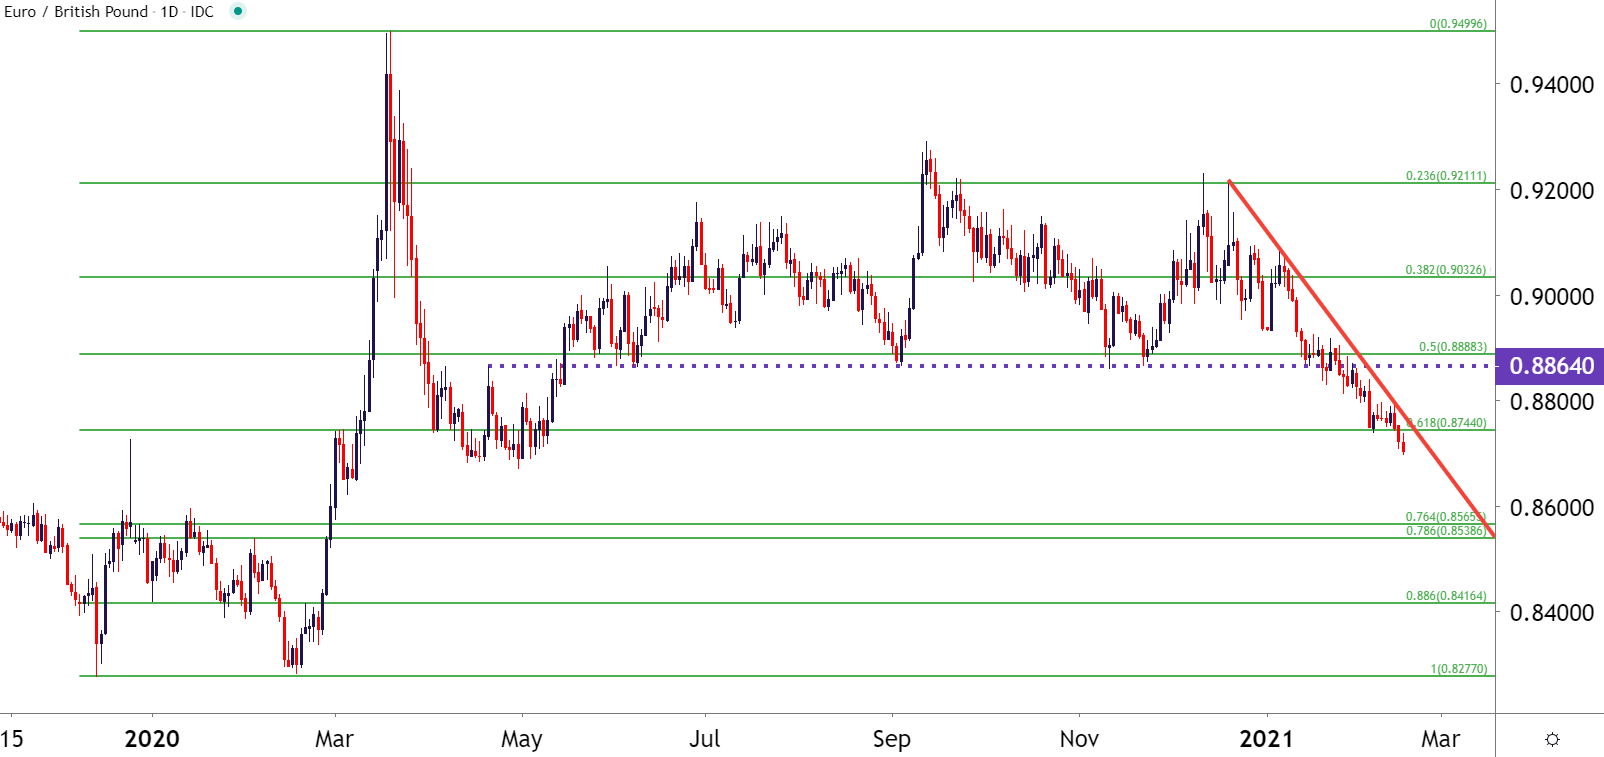
Chart prepared by James Stanley; EUR/GBP on Tradingview
— Written by James Stanley, Strategist for DailyFX.com
Contact and follow James on Twitter: @JStanleyFX
Be the first to comment