

British Pound (GBP) Price Outlook
Sterling traders lightened their positions yesterday in the wake of the Bank of England meeting with hawks left disappointed that the central bank continued to look through current inflationary pressures. Going into the meeting, Sterling traders were long and these positions were soon washed out although the effect on most GBP pairs was minimal. The central bank did note that price pressures were rising and that inflation was expected to exceed 3% ‘for a temporary period’, while bank staff revised up their UK Q2 GDP forecast by 1.5% since the May Report. All told, marginally hawkish but not enough to keep Sterling at its recent levels.
GBP/USD Drops as BoE Disappoints Calls for Hawkish Surprise
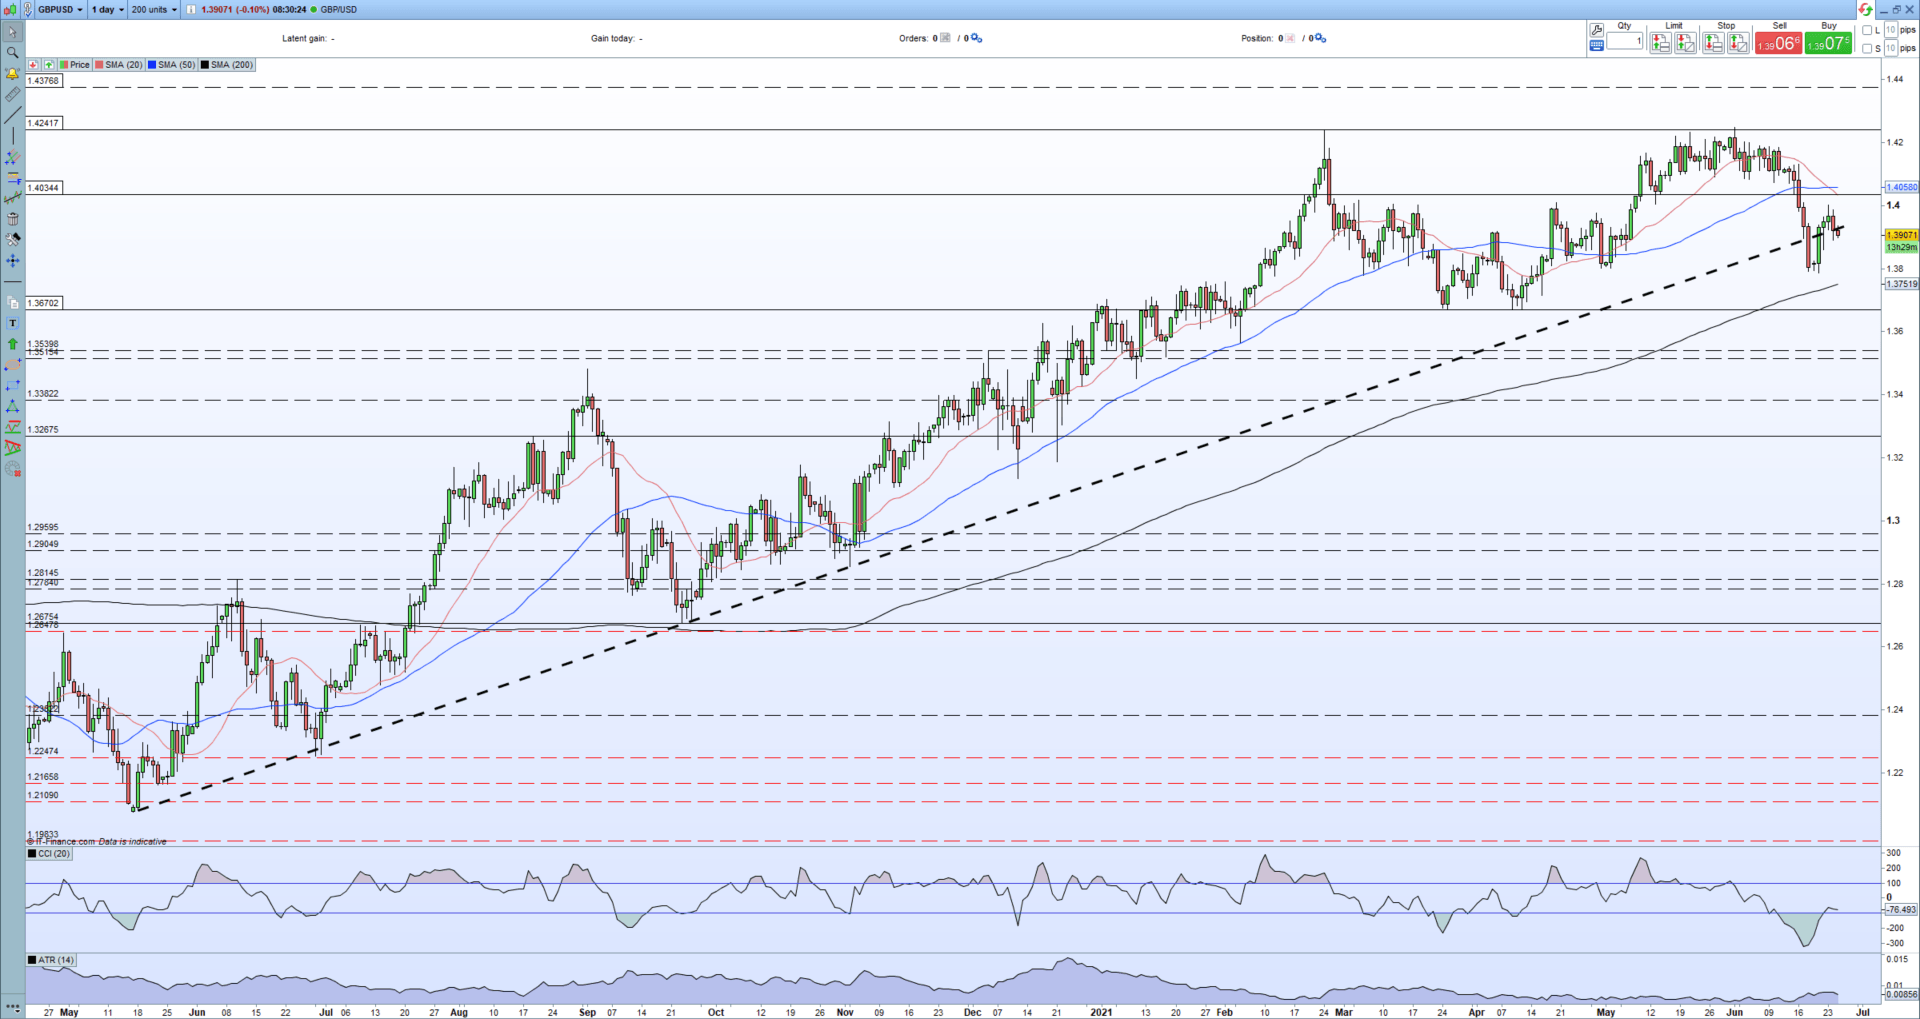
The daily chart shows GBP/USD now trying to regain the medium-term bullish trendline that has kept the pair moving higher since mid-May 2020. The next driver for GBP/USD will come from the right-hand side of the pair, with the latest look at US inflation later in the session. The core PCE figures, released at 12.30 GMT, are expected to show inflation running hot on a y/y basis – 3.4% exp vs. 3.1% last month – while later in the afternoon, Michigan Consumer Sentiment is also expected to pick up further – 86.5 vs. 82.9 last month. The inflation figure has the ability to move the US dollar on either a beat or miss and should be watched closely.
GBP/USD will remain in a holding pattern ahead of the US data with the pair trading around the multi-month trendline. The pair have moved out of oversold territory, adding some stability, but the 20-day sma has broken below the 50-day sma this week, highlighting short-term weakness. It may be difficult for GBP/USD to reclaim the recent uptrend unless there is a big miss on today’s US data, and a period of consolidation is looking more likely for the next few weeks.
GBP/USD Daily Price Chart (April 2020 – June 25, 2021)
Retail trader data show 53.38% of traders are net-long with the ratio of traders long to short at 1.15 to 1. The number of traders net-long is 6.20% higher than yesterday and 12.08% lower from last week, while the number of traders net-short is 1.90% lower than yesterday and 23.84% higher from last week.
We typically take a contrarian view to crowd sentiment, and the fact traders are net-long suggests GBP/USD prices may continue to fall. Positioning is more net-long than yesterday but less net-long from last week. The combination of current sentiment and recent changes gives us a further mixed GBP/USD trading bias.
Traders of all levels and abilities will find something to help them make more informed decisions in the new and improved DailyFX Trading Education Centre
What is your view on Sterling– bullish or bearish?? You can let us know via the form at the end of this piece or you can contact the author via Twitter @nickcawley1.
Be the first to comment