

British Pound (GBP) Price Outlook
- Positive Retail sales and PMI releases.
- GBP/USD may nudge higher ahead of US data releases.

Recommended by Nick Cawley
How to Trade GBP/USD
Data released earlier in the session should help to boost the value of the British Pound and halt the recent slide lower. Retail sales figures for March beat expectations with ease with the year-on-year figure coming in at 7.2% compared to market expectations of 3.5% and a prior month’s reading of -3.6%. While retail data numbers can be volatile, today’s release will add fuel to the economic recovery story.
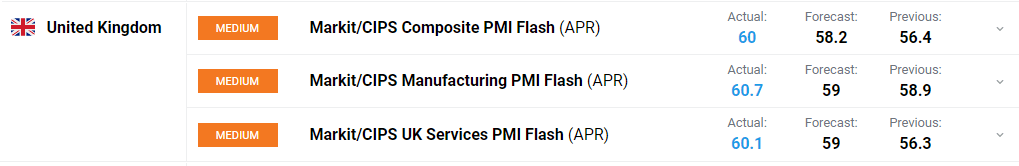
The latest UK PMI data (April) also paint a positive picture for the UK with companies reporting a ‘surge in demand for both goods and services as the economy opens up from lockdowns and the encouraging vaccine roll-out adds to a brighter outlook’ according to IHS Markit chief business economist Chris Williamson. The Composite PMI hit an 89-month high of 60, the Services reading hit an 80-month high of 60.1, while the Manufacturing index hit a 321-month high of 60.7.

Recommended by Nick Cawley
Download our new Q2 GDP Forecast
GBP/USD currently trades around 1.3875 and may look to push higher ahead of the US open and the US PMI release. Recent US economic prints continue to beat expectations as the US economic pick-up gathers pace. Next week there is a crowded economic and event calendar, with the latest Fed decision and the first look at US Q1 GDP the standouts. Any further positive beats in the US next week may put the brakes on any GBP/USD rally.
For all market-moving economic data and events see the DailyFX Economic Calendar.
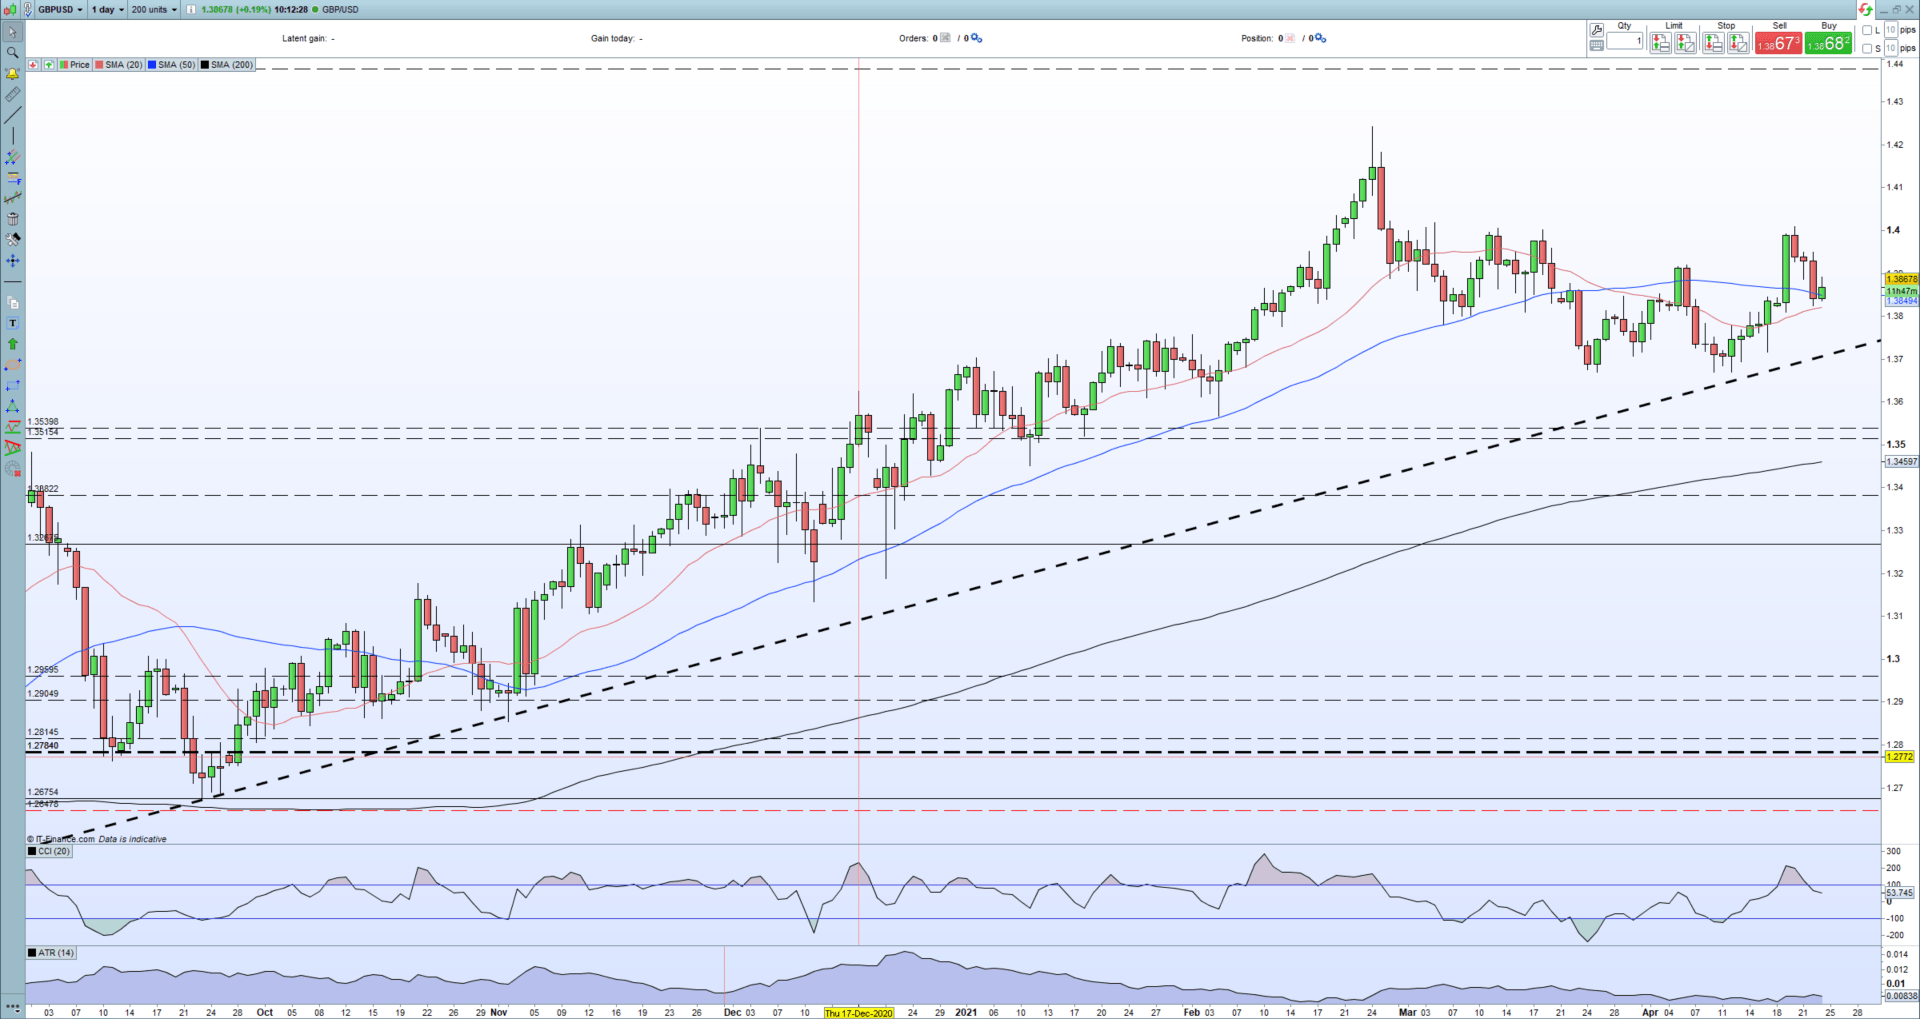
The recent double-bottom pattern on the daily chart around 1.3670 is likely to hold, aided by the medium-term uptrend, while cable is also getting some short-term support from the 20-day simple moving average. A break above a cluster of recent highs around 1.4000 will likely need a strong driver for a convincing breakout.
GBP/USD Daily Price Chart (September 2020 – April 23, 2021)
| Change in | Longs | Shorts | OI |
| Daily | 13% | -16% | -2% |
| Weekly | -12% | 12% | -3% |
Retail trader data show 56.34% of traders are net-long with the ratio of traders long to short at 1.29 to 1. The number of traders net-long is 14.00% higher than yesterday and 15.77% lower from last week, while the number of traders net-short is 17.66% lower than yesterday and 6.89% higher from last week.
We typically take a contrarian view to crowd sentiment, and the fact traders are net-long suggests GBP/USD prices may continue to fall. Positioning is more net-long than yesterday but less net-long from last week. The combination of current sentiment and recent changes gives us a further mixed GBP/USD trading bias.
Traders of all levels and abilities will find something to help them make more informed decisions in the new and improved DailyFX Trading Education Centre
What is your view on GBP/USD – bullish or bearish?? You can let us know via the form at the end of this piece or you can contact the author via Twitter @nickcawley1.
Be the first to comment