

ersler/iStock via Getty Images
Thesis and Background
Many income investors are drawn to British American Tobacco (NYSE:BTI) and Philip Morris (NYSE:PM) for good reasons. They both provide generous dividends. And the dividends are supported by stable profits.
The thesis of this article is that although both are attractive dividend stocks, our view is that BTI is better (and we hold BTI but not PM ourselves). The remainder of this article will detail our considerations:
A) BTI provides safer income in the long term. Both BTI and PM have been stable dividend stocks boasting a long history of dividend payments and increase. However, in relative terms, BTI provides safer dividends in terms of lower payout ratios and thicker dividend cushion ratios.
B) BTI provides more favorable odds for price appreciation. In selecting dividend stocks, we also look for a margin of safety due to valuation or a catalyst in the near term. And you will also see that both BTI and PM are quite reasonably valued. But BTI provides a thicker margin of safety both in absolute and relative terms.
C) Lastly, we also feel that BTI’s future is laden with less drama (compared to PM’s active acquisitions and uncertainties surrounding the iQOS). For dividends, a boring future is a good future in our minds. These considerations make BTI more of a conservative investment and PM more of a higher-risk-higher-return investment – in relative terms against each other.
The remainder of this article will focus on the above aspects and won’t dive into their noncombustible and alternative products. Readers interested in our take on those perspectives can see our earlier articles.
Superb profitability and dividend safety
Both BTI and PM currently offer an attractive dividend yield of about 6.8% and 4.8%, respectively. Dividends from both companies are supported by superior and consistent profitability as you can see from the following chart. Their profitability is quite similar among themselves and also compares quite favorably against their peer MO. Take the net income margin as an example. Both feature a net margin of around 26% to 29%. To put things under perspective, the average profit margin for the overall economy fluctuates around 8% and rarely goes above 10%. Of course, this is an average across all business sectors. Nonetheless, as a rule of thumb, 10% is a very healthy profit margin and 20% is a very high margin.
Seeking Alpha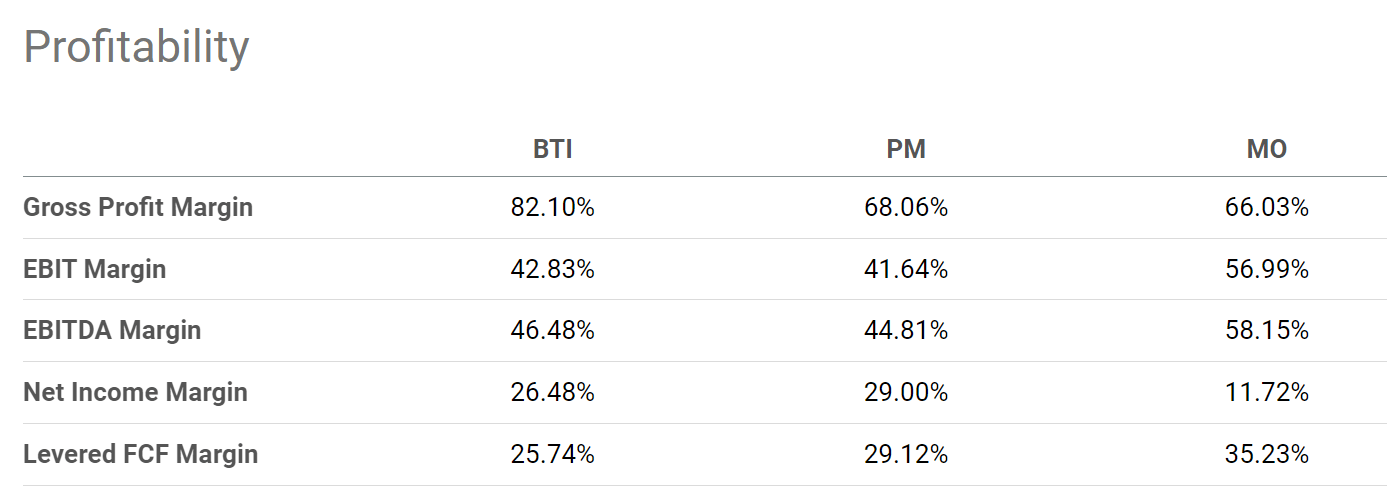
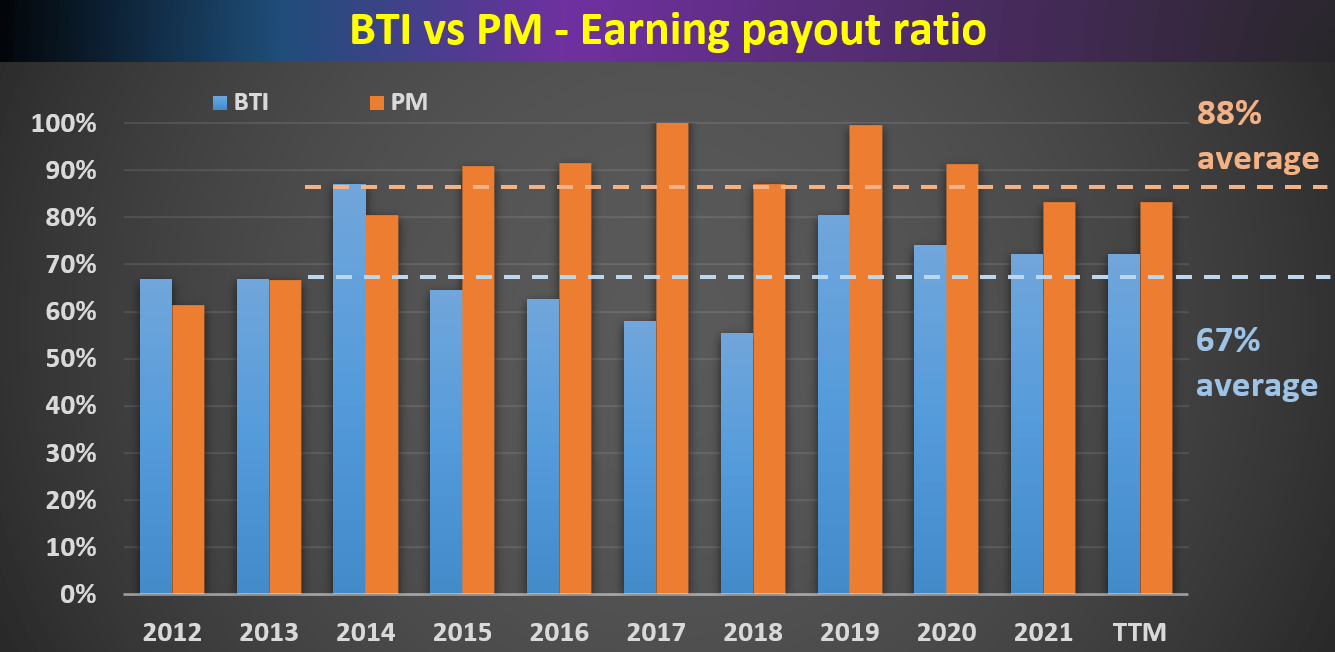
And for dividend investors, I am sure all of us know all the typical metrics to gauge dividend safety such as payout ratio in terms of earnings, payout ratio in terms of cash flow, et al. The following chart shows BTI and PM’s payout ratio in terms of cash flow and earnings. As seen, both BTI and PM have been doing a consistent job of managing their dividend payout in the past.
Also, you can see, overall BTI’s payout ratios are a lower than PM, both in terms of cash payout ratio (52% on average vs 71%) and earnings (67% vs 88%).
Author based on Seeking Alpha data Author based on Seeking Alpha data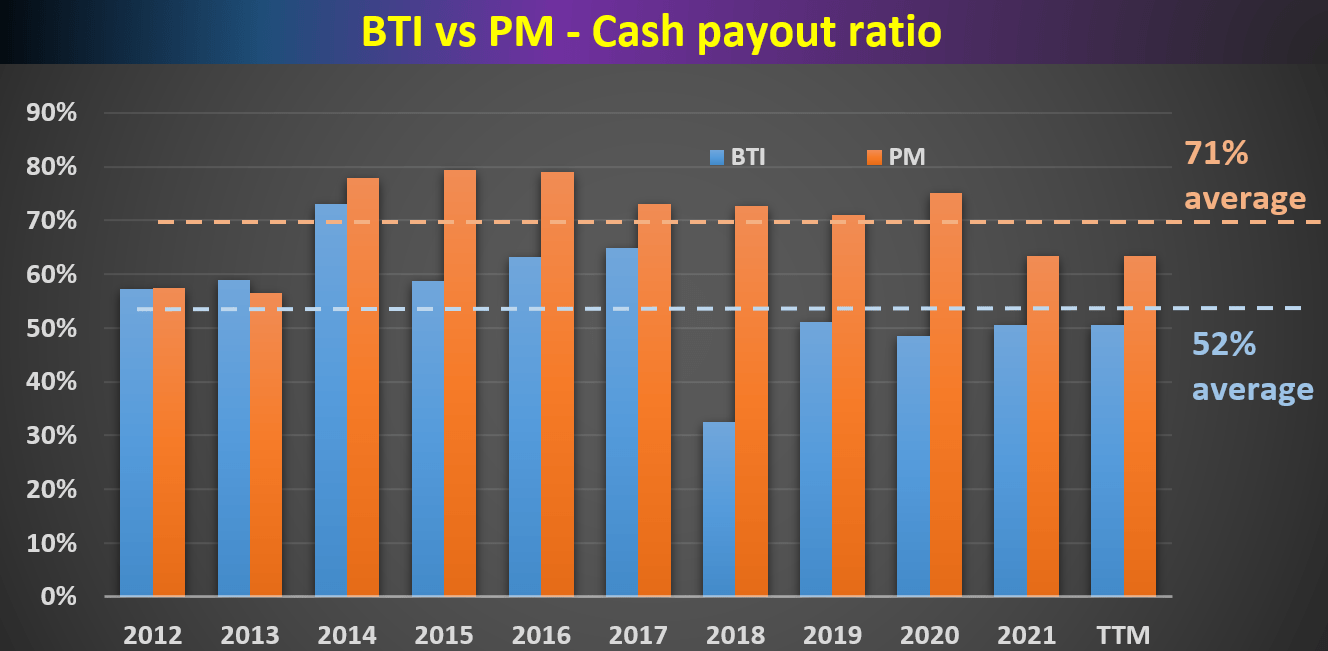
Dividend cushion ratios
The above pay-out ratios we commonly quote enjoy simplicity, and we also like to go a step further for a more comprehensive assessment of dividend safety. As detailed in my earlier article here, the major limitations of the above simple payout ratios are twofold:
- The simple payout ratio ignores the current asset that a firm has on its balance sheet. Obviously, for two firms with the same earning power, the one with more cash sitting on its balance sheet should have a higher level of dividend safety.
- The simple payout ratio also ignores the upcoming financial obligations. Again, obviously, for two firms with the same earning power, the one with a lower level of obligations (pension, debt, CAPEX expenses, et al) should have a higher level of dividend safety.
The above simple payout ratios ignore all these important pieces. For a more advanced analysis of dividends stocks, we find the so-called dividend cushion ratio an effective tool. A detailed description of the concept can be found in Brian M Nelson’s book entitled Value Trap. And a brief summary is quoted below:
The Dividend Cushion measure is a ratio that sums the existing net cash (total cash less total long-term debt) a company has on hand (on its balance sheet) plus its expected future free cash flows (cash from operations less all capital expenditures) over the next five years and divides that sum by future expected cash dividends (including expected growth in them, where applicable) over the same time period. If the ratio is significantly above 1, the company generally has sufficient financial capacity to pay out its expected future dividends, by our estimates. The higher the ratio, the better, all else equal.
Note that our following analysis made one revision to the above method. Instead of subtracting the total long-term debt, we subtracted the total interest expenses over a past five-year period. The reason for this revision is to adjust the status of businesses such as BTI and PM. Mature businesses like these probably will never have the need to repay all of their debt at once. But it does need to have enough earnings to service its debt (i.e., cover the interest expenses). With this background, the dividend cushion ratios for BTI and PM are calculated and shown below.
As can be seen, BTI has been maintaining an average dividend cushion ratio of 2.0x in recent years. PM’s cushion ratio is a bit lower at 1.4x, but still a healthy level. Both are significantly above 1, confirming their safe and conservative dividend payout in the long term.
Author based on Seeking Alpha data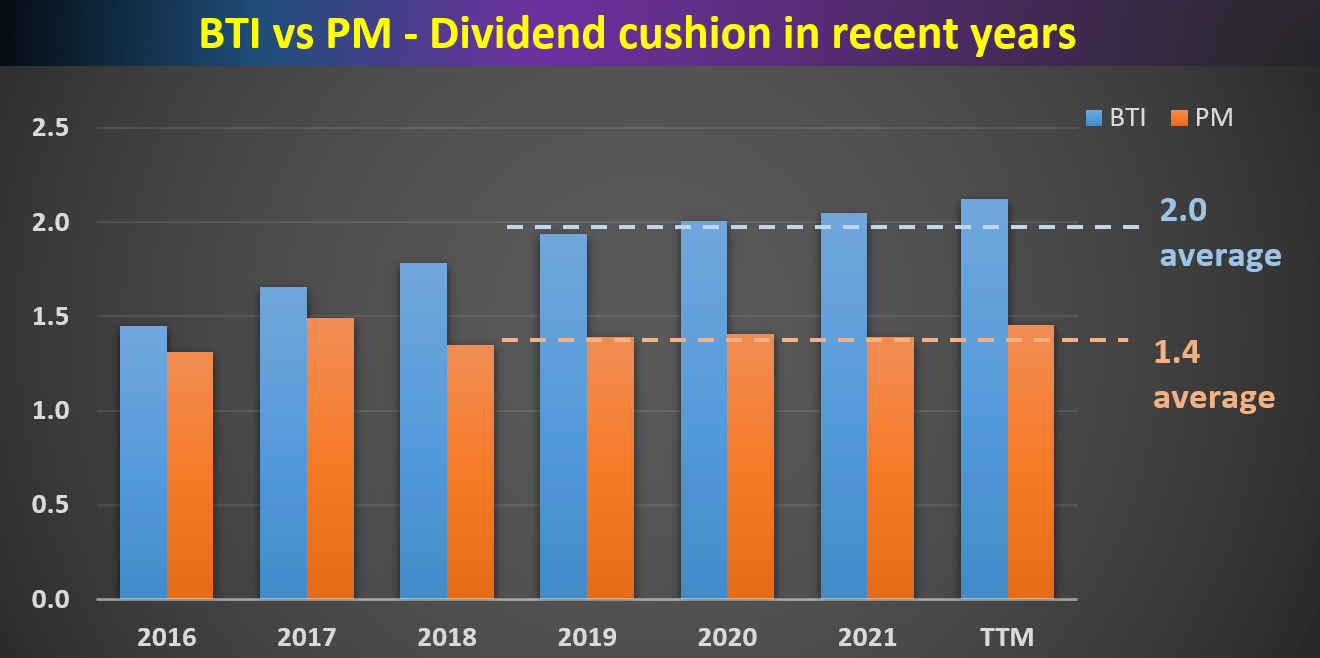
Valuation and Projected Returns
As can be seen from the following numbers in the table, at its current price level, BTI is about significantly undervalued. It is about 22% undervalued based on its historical price to cash flow multiples, and about 18% overvalued based on its historical dividend yield.
For the next 3~5 years, a mid-single-digit annual growth rate is expected (near 5.5%) given its strong ROCE (return on capital employed) of around 80% to 90%. At 80% to 90% ROCE, a modest 5% investment rate would be able to sustain a mid-single-digit organic growth rate. Given its long-term pricing power, adding a bit of an inflation escalator would achieve a 5.5% growth rate conservatively. And the total return in the next 3~5 years is projected to be in a range of 46% (the low-end projection) to about 60% (the high-end projection), translating into a very attractive annual total return in the double-digit range.
Author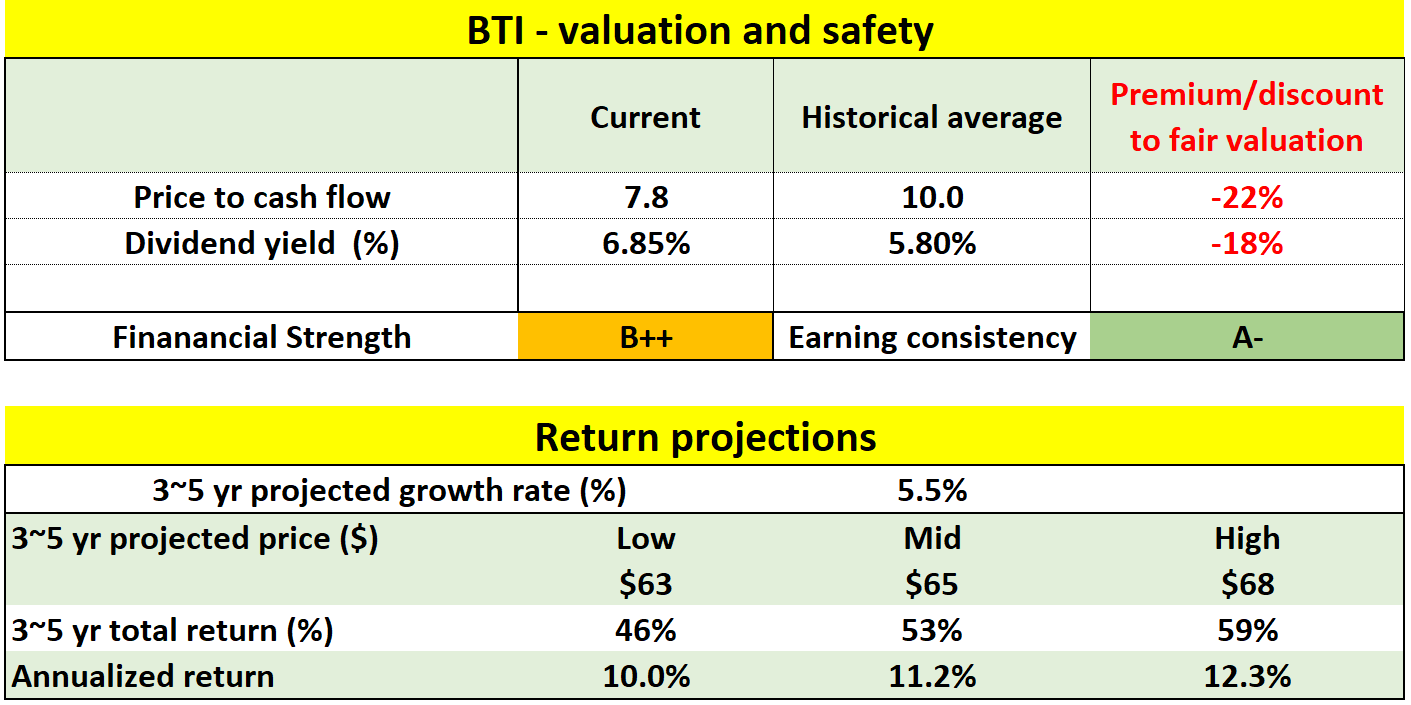
PM’s case is very similar as can be seen from the following table. At its current price level, it is also about fairly valued. For the next 3~5 years, a similar mid-single-digit annual growth rate is also expected (near 5.5%). PM’s ROCE is about 55%. Its reinvestment rate is a bit higher though, around 7.5% to 10%. At 55% ROCE and a 7.5% to 10% reinvestment rate, a mid-single-digit growth rate can also be organically sustained. And again adding a bit of an inflation escalator would achieve a 5.5% growth rate conservatively. And the total return in the next 3~5 years is projected to be in a range of 9% (the low-end projection) to about 20% (the high-end projection), also translating into an annual total return up to the mid-single-digit.
Author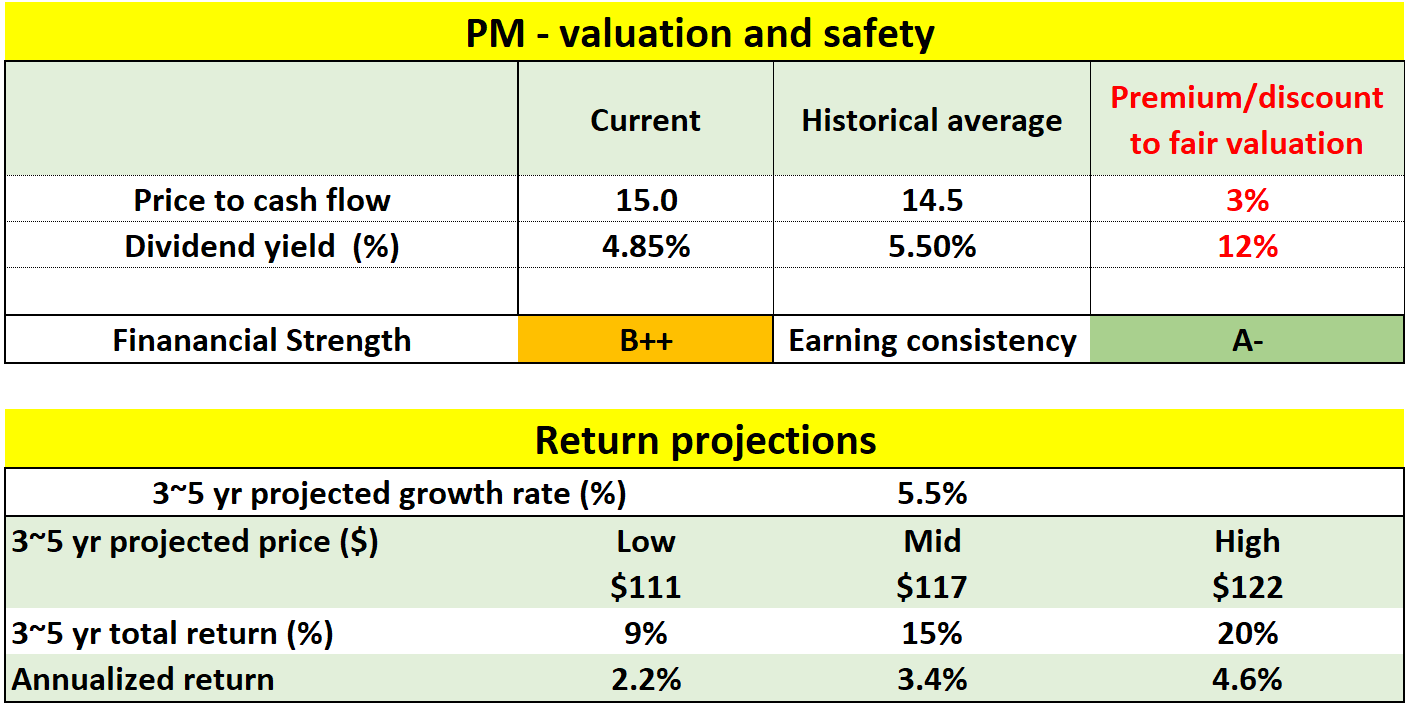
Finally, if you are under-impressed by the above analyses, a consideration against risk-free rates will provide a more complete picture. As risk-free rate serves as agreed gravity for all asset valuation, their valuation cannot be properly interpreted until we set them under the context of risk-free rates.
As can be seen from the next chart, the dividend yields for both stocks started at around 4% at the beginning of the decade. And the dividend yields have been rising stably to the current level of 4.8% for PM and about 6.8% for BTI. So in terms of dividend yield, the valuation of PM has contracted by about 20% over the past decade and by almost 70% for BTI, which is already included in the valuation considerations above.
But interest rates have been in steady decline over the past decade. So as a result, the difference between PM and BTI’s yield and the risk-free rate has widened significantly. And this is the key to understanding the valuation dynamics. Their yield spread relative to the treasury rates started around about 1% at the beginning of the decade as you can see (about 4% average yield minus about 2.5% to 3% treasury rates at that time). And now the yield spread is about 2.1% for PM (4.8% yield minus about 2.7% of treasury rates) and about a whopping 4.1% for BTI (6.8% yield minus about 2.7% of treasury rates).
So in terms of the risk premium, their current valuation is even more compressed than on the surface.
Seeking Alpha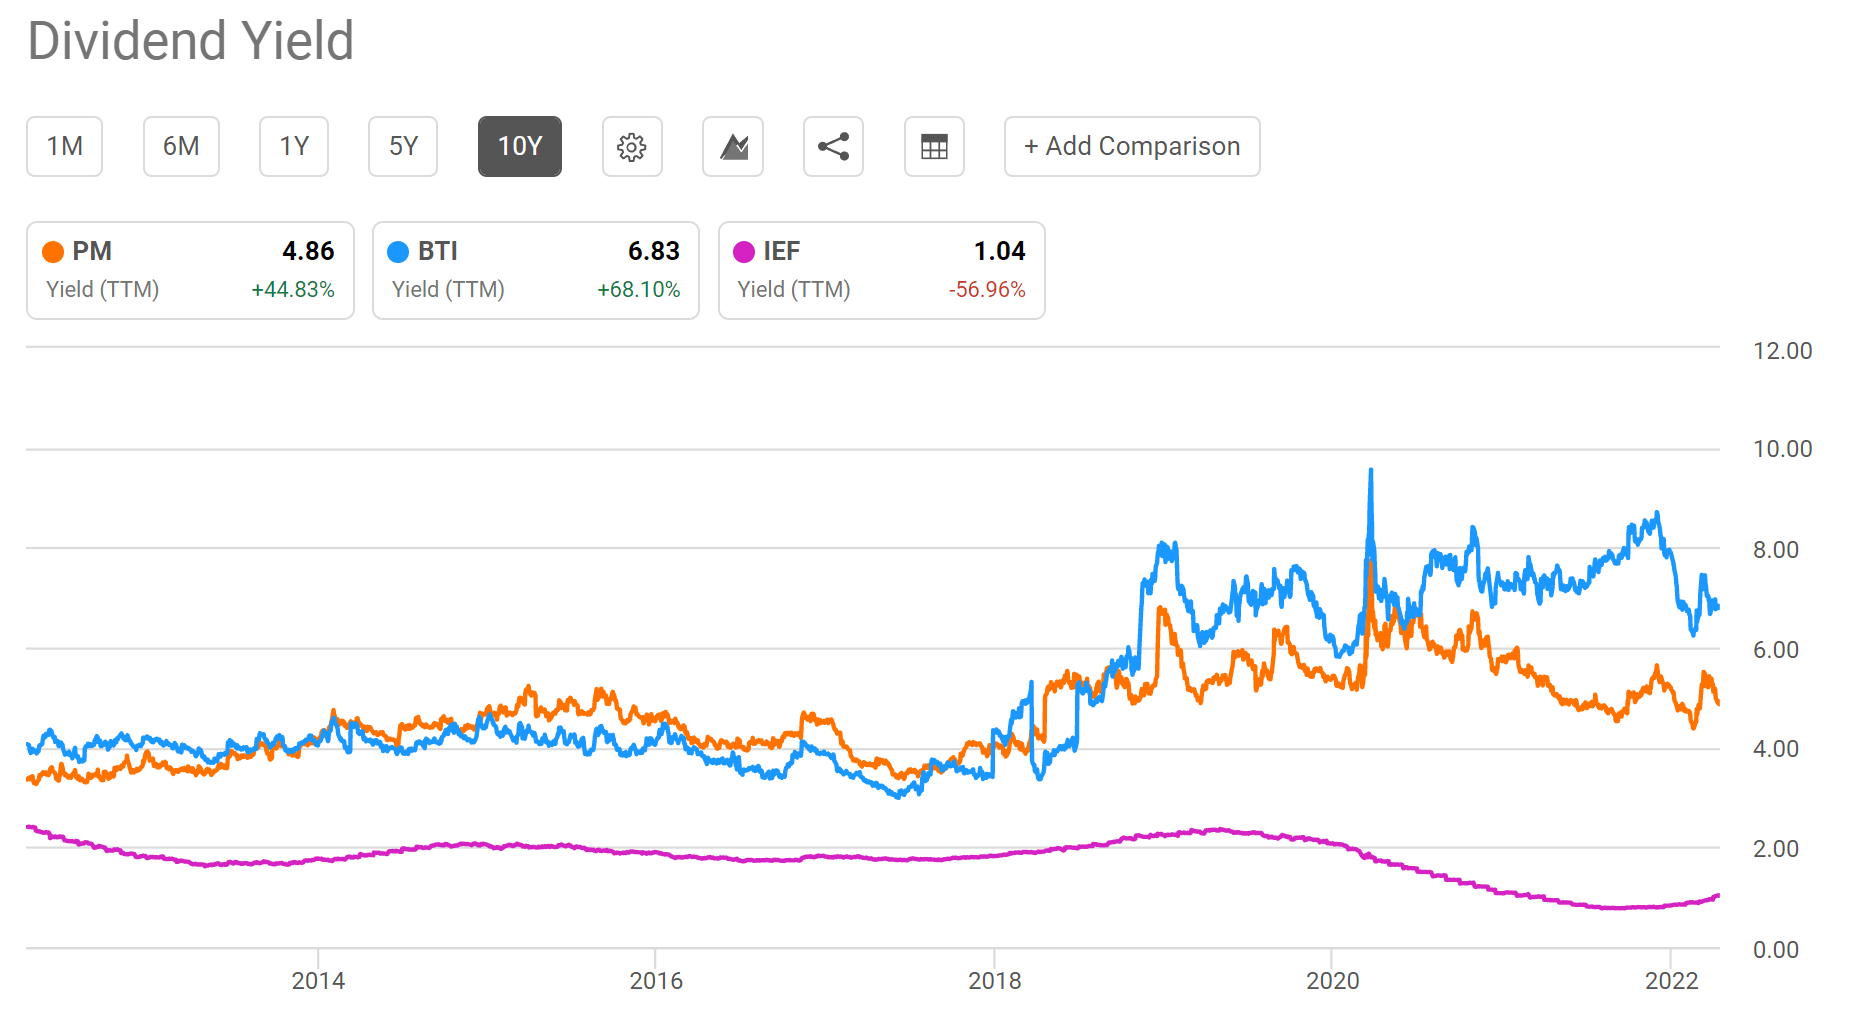
Risks
Both stocks face the secular decline of their smokable products. Both have been constantly facing regulatory pressure in the form of product taxes and advertisement restrictions. And such pressure constantly poses risks. Both have been taking proactive measures to diversify their product offerings. Both have been aggressively investing in noncombustible and more healthy new products. However, the path can be tortuous and the timeline of success remains uncertain at this point.
Both also face macroeconomic risks. The current Russian/Ukraine geopolitical issues pose a major risk. In BTI’s case, it has announced its intention to relinquish ownership of its business in Russia. Details remain unclear, but the impact should be limited as Russia and Ukraine account for about 3% of the company’s total sales. PM also suffers some disruptions of the global supply chain. It is dealing with semiconductor shortages that may prevent it from fully fulfilling consumer demand for its iQOS product.
Conclusion and final thoughts
Both BTI and PM are strong dividend stocks with high dividends, safety, and favorable price appreciation potential. In particular,
- Both stocks are attractive and strong dividend stocks. And both are attractively valued. Especially in terms of their risk premium relative to risk-free rates, their current valuation is even more compressed than on the surface.
- Although we ourselves like BTI better (and also hold BTI but not PM to suit our own investment style). Our considerations are A) in relative terms, BTI provides safer dividends in terms of lower payout ratios and thicker dividend cushion ratio, and B) BTI valuation also provides a thicker margin of safety both in absolute and relative terms. Overall, we feel BTI to be more of a conservative investment and PM more of a higher-risk-higher-return investment – in relative terms against each other.
Be the first to comment