

NeonShot
Thesis
The following chart shows the positions of Ray Dalio’s Bridgewater Associates according to the latest 13F disclosure filed in Q1 of 2022. As you can see, The Procter & Gamble Company (NYSE:PG) is his largest single holding now, representing 4.4% of his total portfolio (a massive $22B portfolio). Furthermore, the position has seen a sizable increase of more than 31% compared to the last filing. Besides such a substantial increase on the leading stock in the consumer staples space, he also increased his stakes in other staple stocks including Coca-Cola (KO), PepsiCo (PEP), Costco (COST), and Walmart (WMT), et al. The increases are all in the 30% to 40% range compared to the last filing.
I totally share Dalio’s view about these stocks under the current inflationary conditions. All the above stocks have demonstrated strong pricing power in the long term to fight inflation. And moreover, they are also all paying safe and generous dividends currently to add another tooth against inflation.
Although, in the next section, you will that all these stocks are included in any standard consumer stable fund, such as the Consumer Staples Select Sector SPDR ETF (NYSEARCA:XLP). So, it behooves us to ask why not just own this fund?
The remainder of this article shares my thoughts on the question using his largest holding of PG as an example. You will see that PG provides far superior profitability over XLP yet is for sales at a lower valuation. Its return on capital employed is about 3x higher than XLP, but its valuation is at a small discount of 4% in terms of P/E and a whopping 28% in terms of price/cash flow ratios. All of these add to a much more favorable long-term return potential (my projection is in the upper single-digit around 7.5%), not only higher than XLP (about 5%) but also better than the overall market (around 6%).
Source: stockcircle.com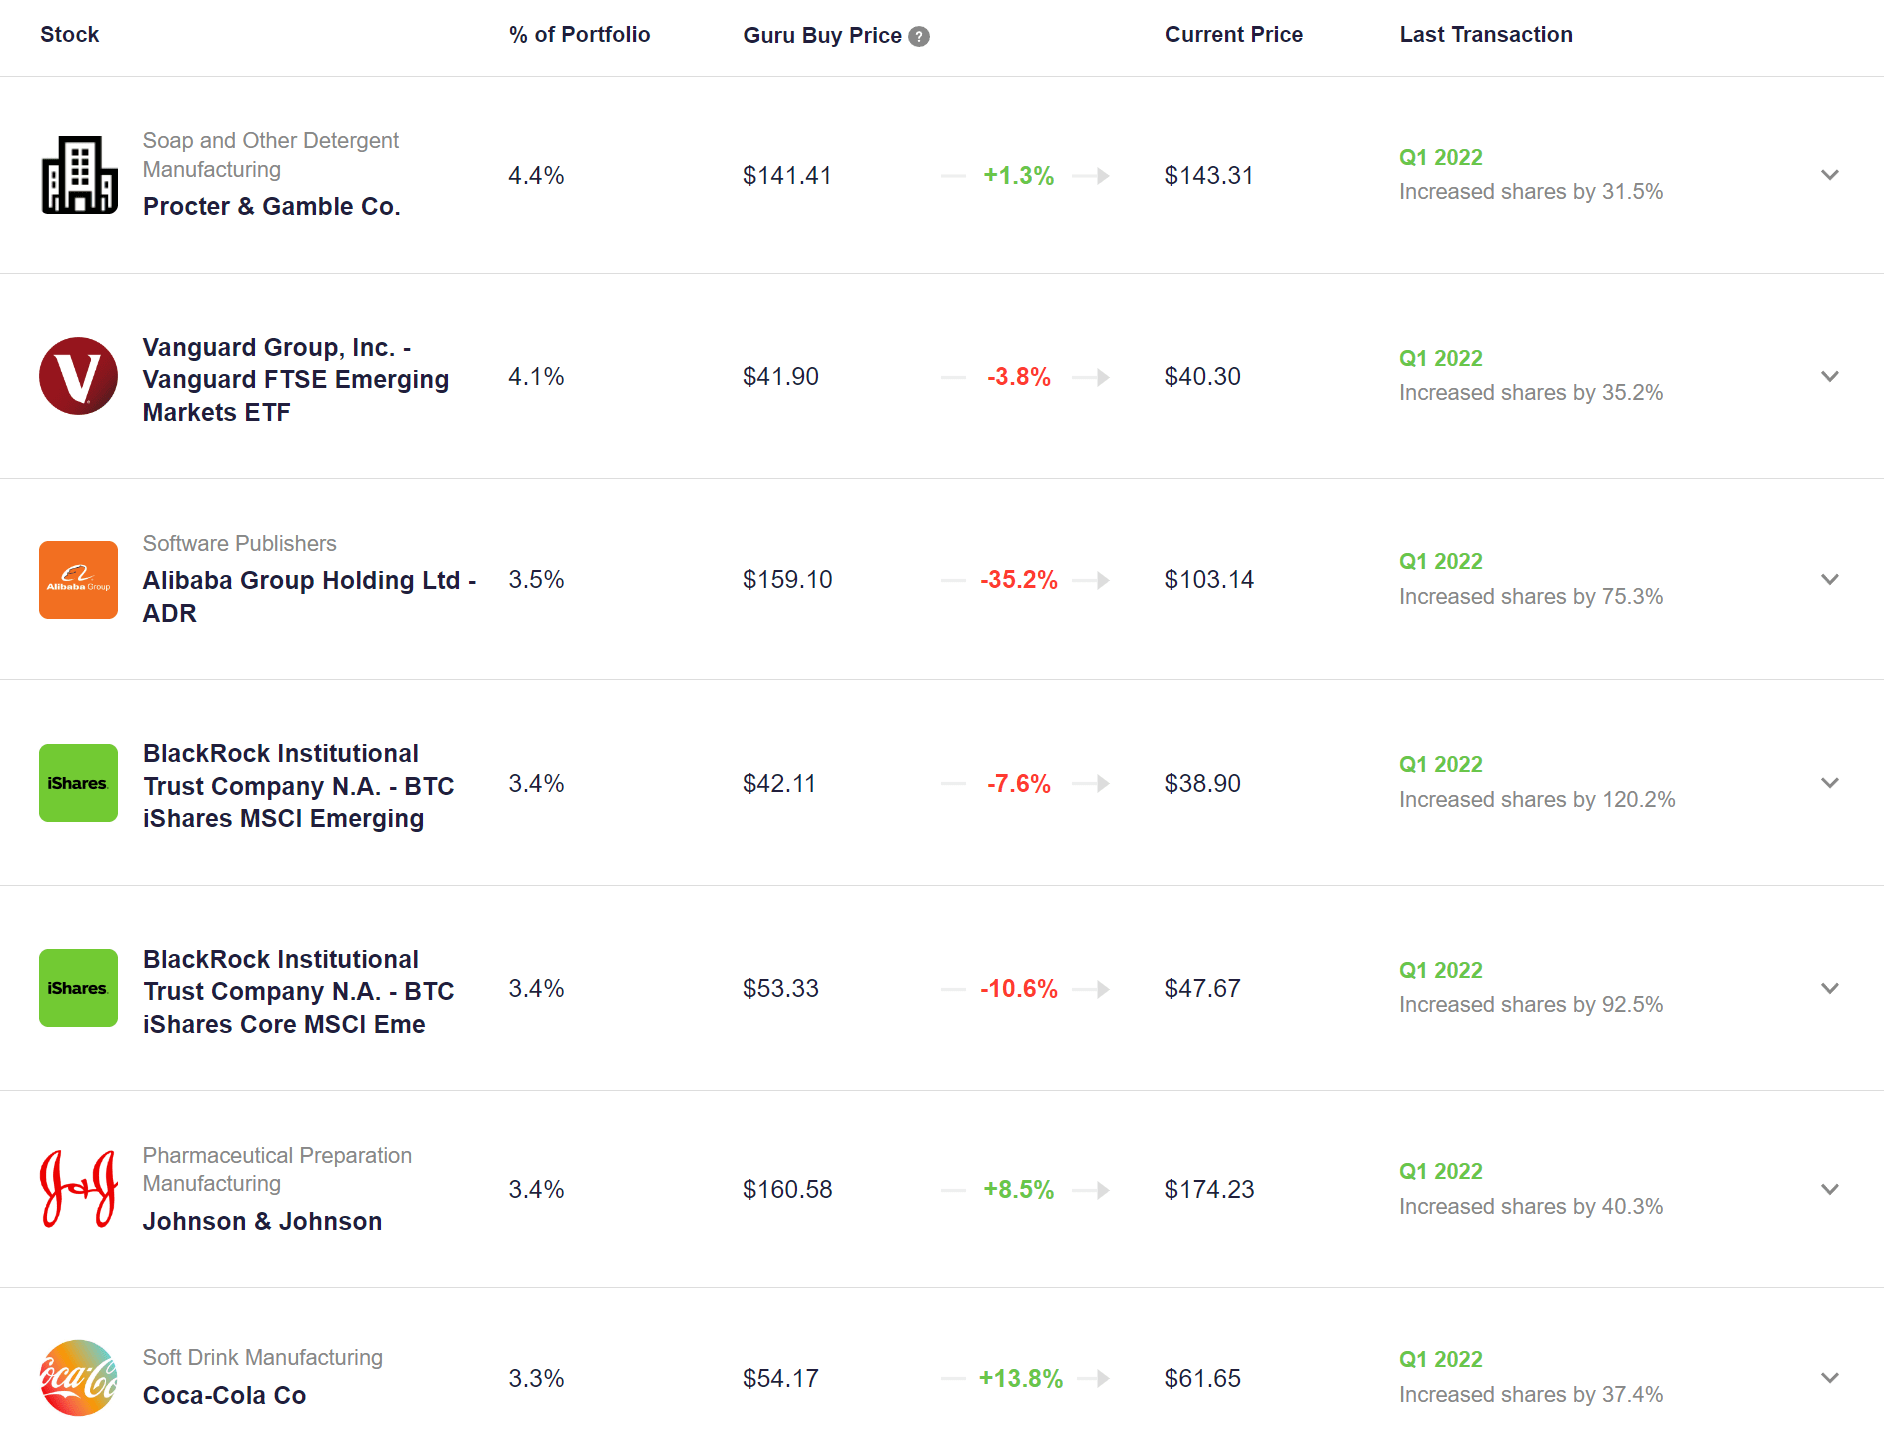
PG and XLP: basic information
XLP is one of the most popular ETF funds in the consumer staples space. It holds a total of 33 stocks, and PG is its largest holding, representing more than 15.5% of the total assets. As aforementioned, its other largest holdings include KO, PEP, COST, WMT, et al, which are not only all in Ray Dalio’s portfolio but also saw an increased stake between 30% to 40% compared to the last filing.
Yahoo Finance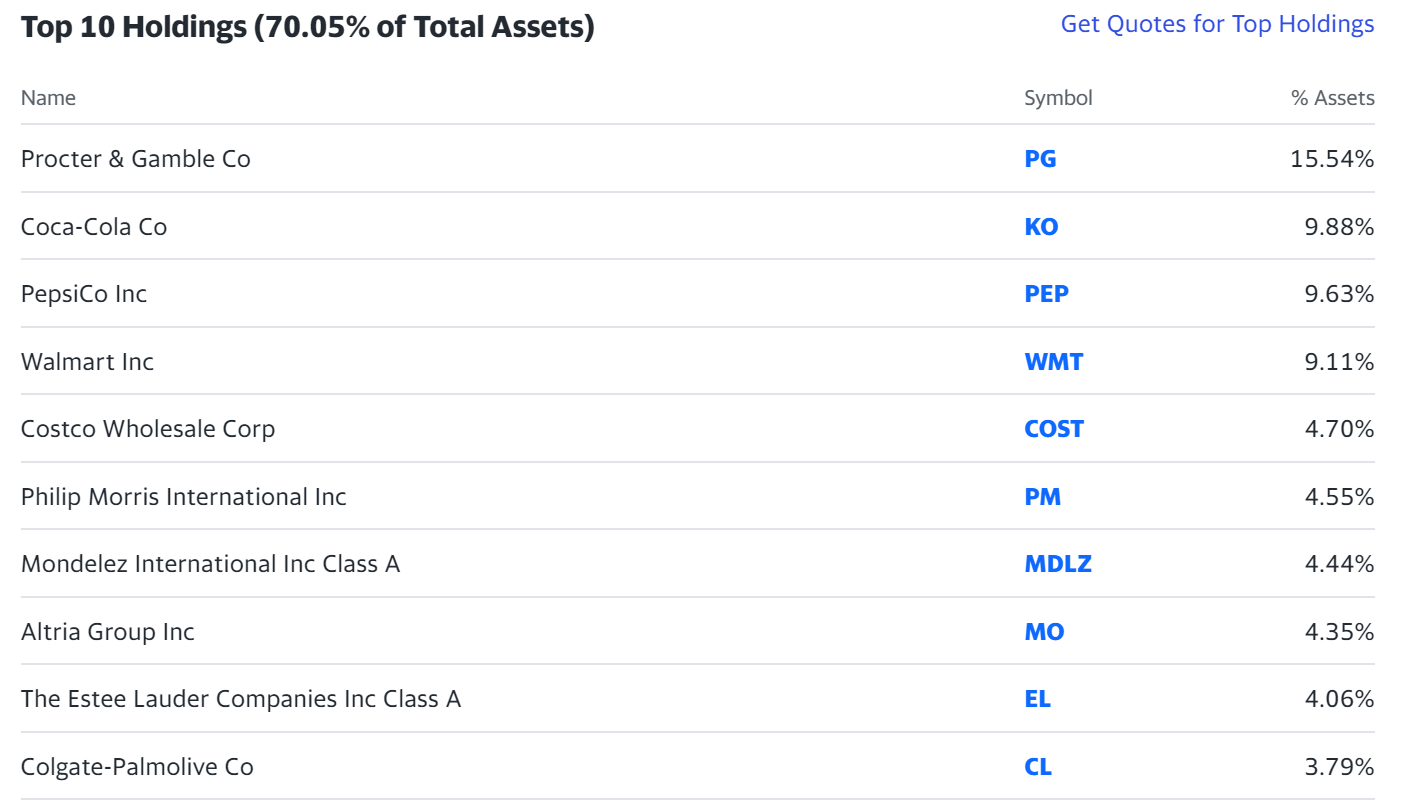
Specific to PG, as you can see from the following chart, it has delivered far superior performance in the long run than XLP. Since 2000, when the fund was launched, PG has delivered an annual return of 7.7% compared to about a 6.7% from XLP, an alpha of about 1% per year. And note that my above independent projection for PG’s return is about 7.5% going forward, not that far from the long-term historical performance. Although my projection for XLP is only about 5% under the current conditions, leading to a larger projected alpha. Also note that PG, besides outperforming XLP, also outperformed the overall market represented by the S&P 500 (whose CAGR is also about 6.7%). My forecast for the overall market’s return going forward is a bit lower at 6%.
Also note that PG, as a single stock, has suffered higher price volatility than the XLP fund. It has suffered a standard deviation of 17%, compared to XLP’s 12%. Its worst year performance was 27%, compared to XLP’s 20%. And its maximum drawdown was 48%, compared to XLP’s 32%. However, as a single stock, PG actually suffered LOWER volatility than the overall S&P 500 in terms of worst year performance (27% vs 37%) and maximum drawdown (48% vs 51%). This is a strong demonstration of the resilience of PG (and also other high-quality stocks) during turbulent times. Our core investment philosophy is precisely built on this observation: holding fewer but well-understood stocks not only delivers outperformance but also reduces risks. Adding more inferior holdings does the opposite. The notation that more holdings equal better/safer diversification is simply false and an illusion.
Portfolio Visualizer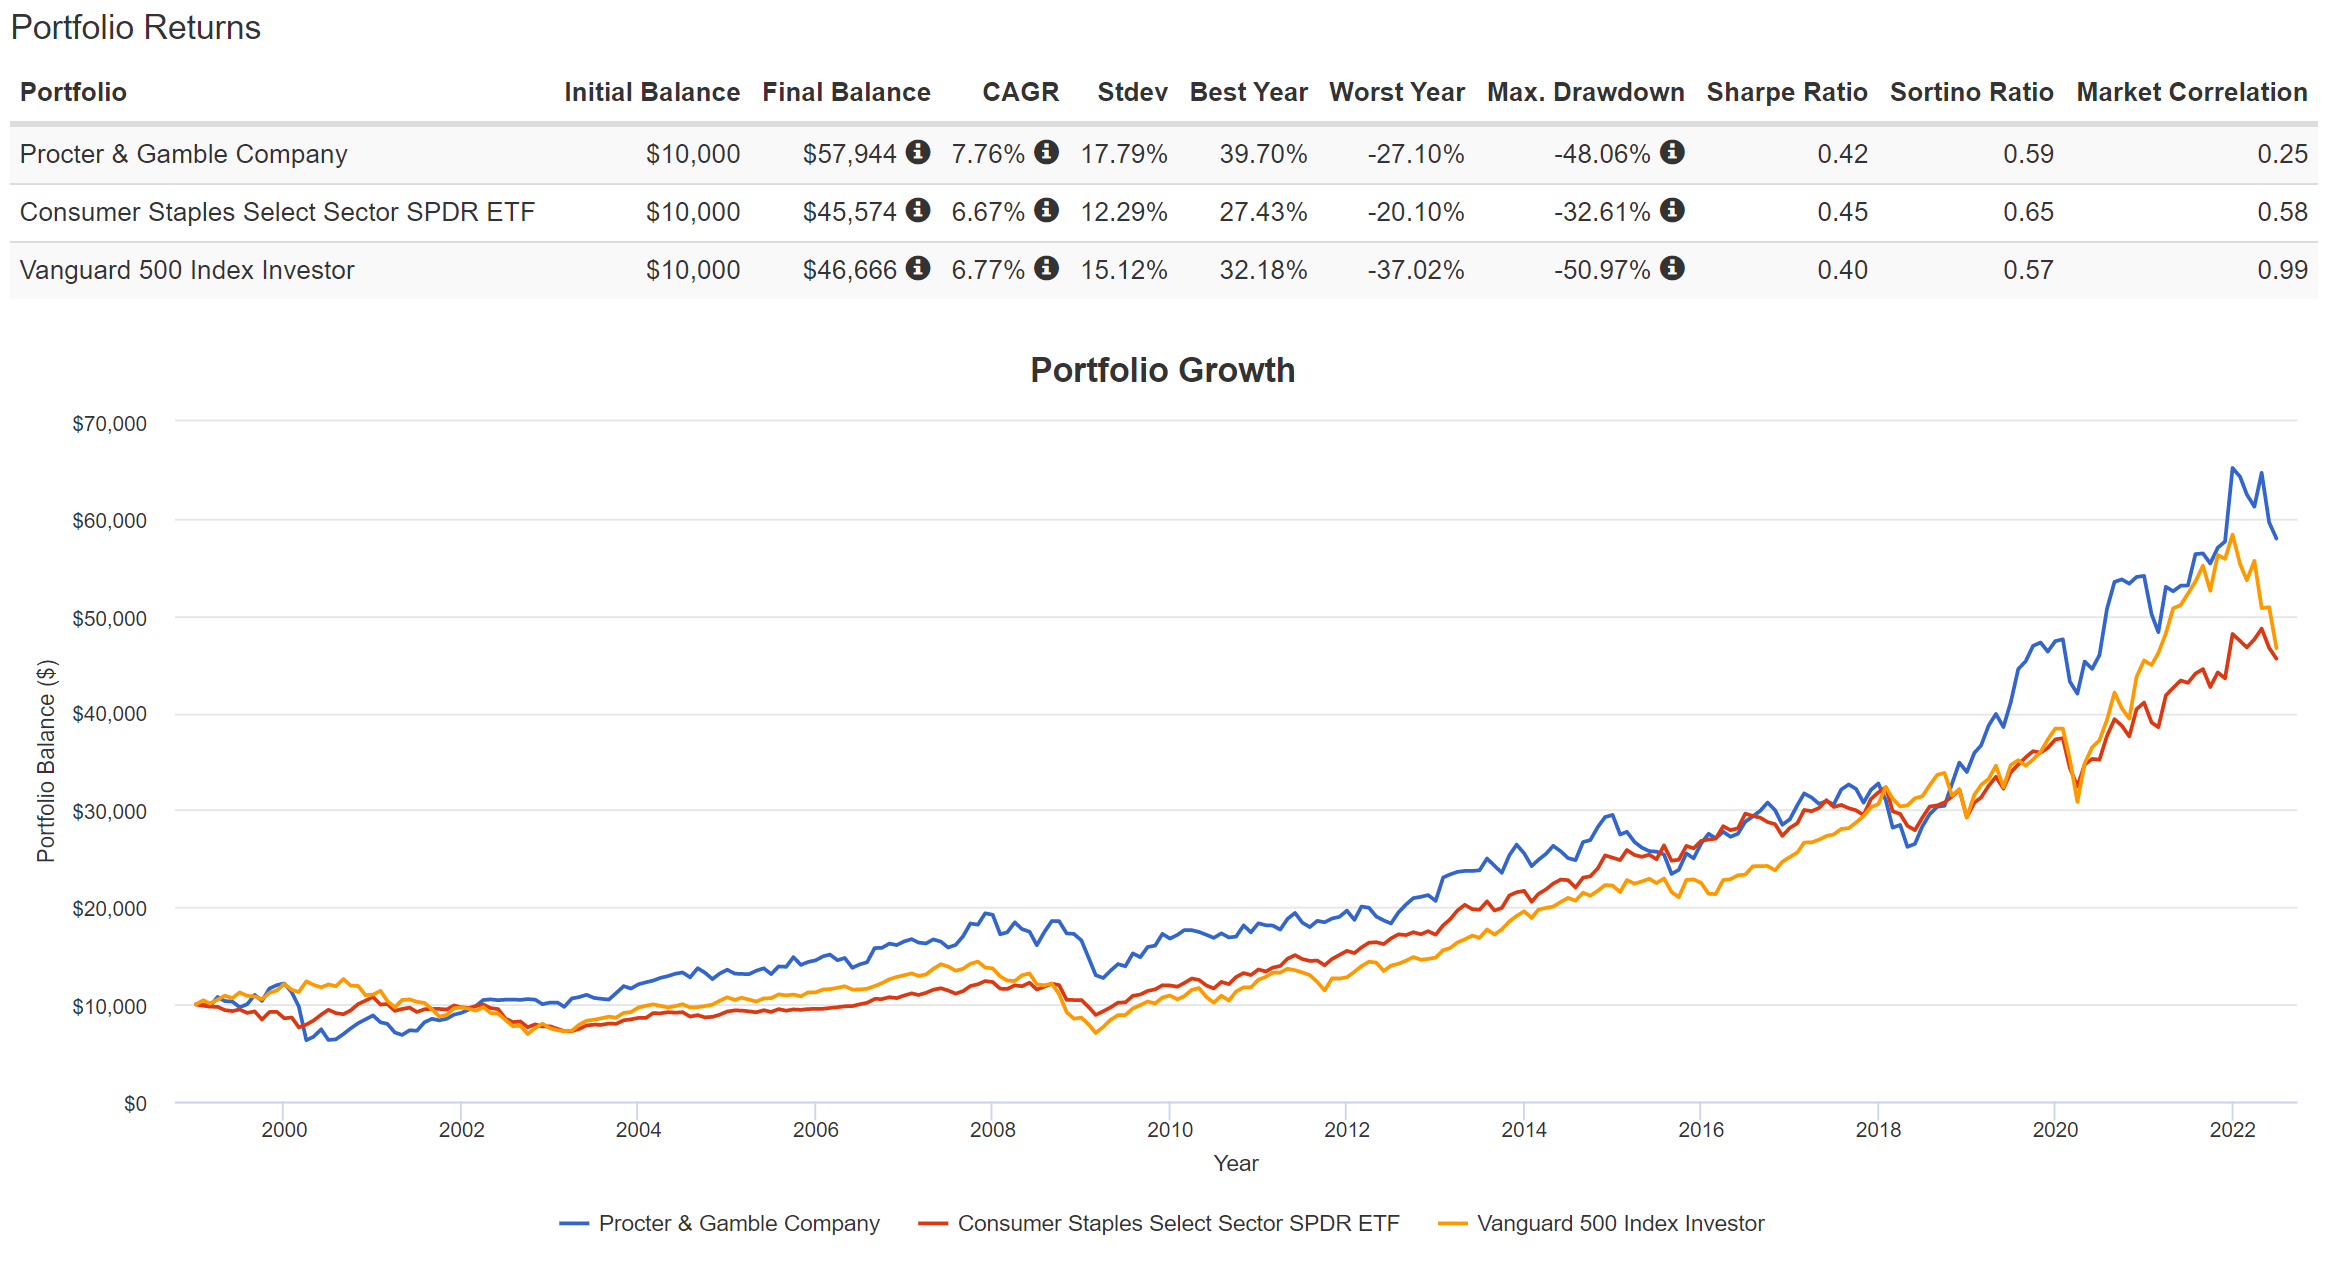
PG’s superior profitability but lower valuation
As you can see from the following chart, compared to XLP, PG deliver far superior profitability yet is for sale at a significant discount.
The chart is made from data obtained after the market closed on July 18 from Yahoo Finance or Seeking Alpha. Particularly, PG’s operating margin of 17.5% and ROCE (return on capital employed) of 61% are both about 3 times higher than the consumer staple sector represented by XLP. Yet, PG is valued at 24.55x P/E (not cheap as to be detailed later) and 20.0x price to cash flow, while XLP is valued at 25.5x P/E and 15.7x price to cash flow. The valuation discount is about 4% in terms of P/E multiples and 28% in terms of price to cash flow multiples.
Author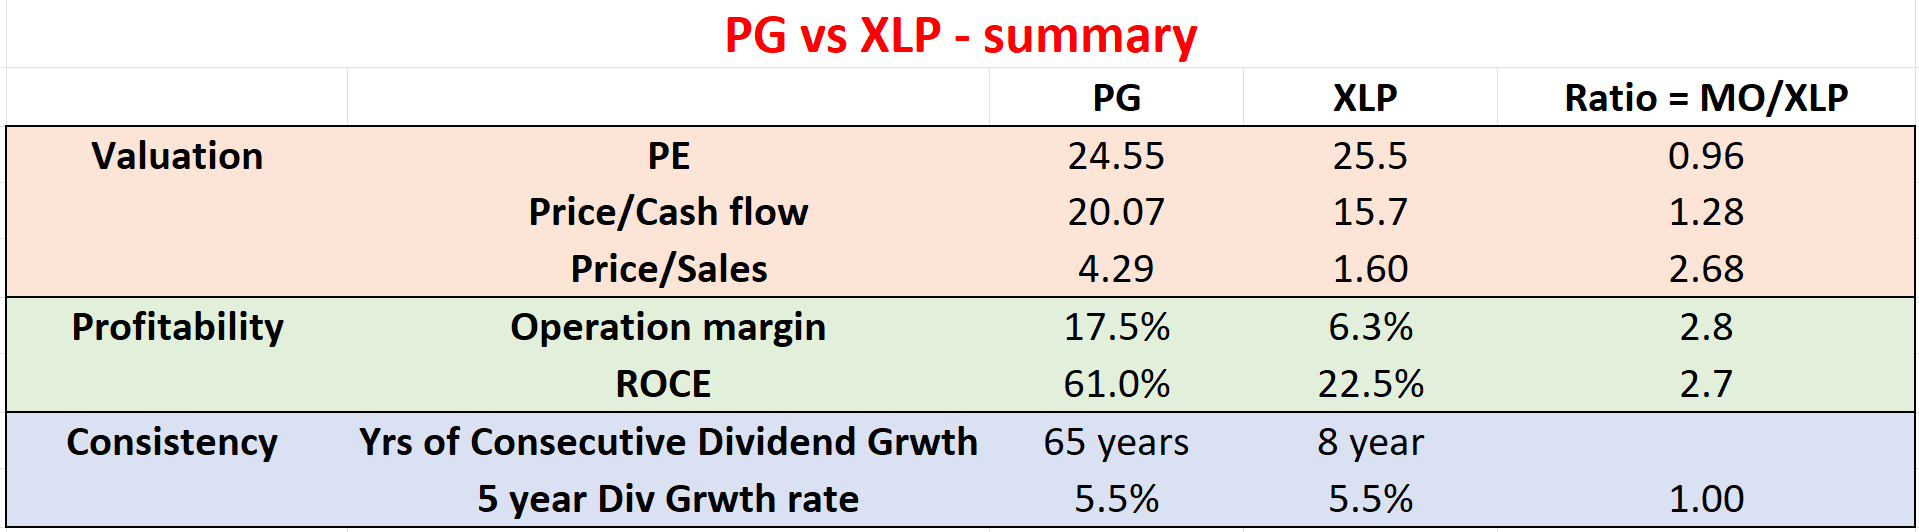
The following chart zooms in on the profitability comparison in terms of ROCE more closely. The ROCE here is calculated using PG’s annual financials for the past 10 years. As can be seen, the ROCE of PG is on average about 61%. it started the decade with a ROCE of around 50% from 2011 to 2014. Since then, its ROCE has been consistently expanding and now hovers above 80% in recent years. Its current ROCE is not only far above the long-term average of 61% but is also more competitive than all the FAAMG stocks except AAPL.
In contrast, XLP’s profitability is less impressive (though healthy). Using the equity as an approximation for the sector capital employed, its ROE is about 22.5%. It is a healthy level and on par with the overall economy – there is no reason why it should deviate too far from the overall economy given its staple nature. But it is nowhere near PG’s current level of 88% or the long-term average of 61%.
Author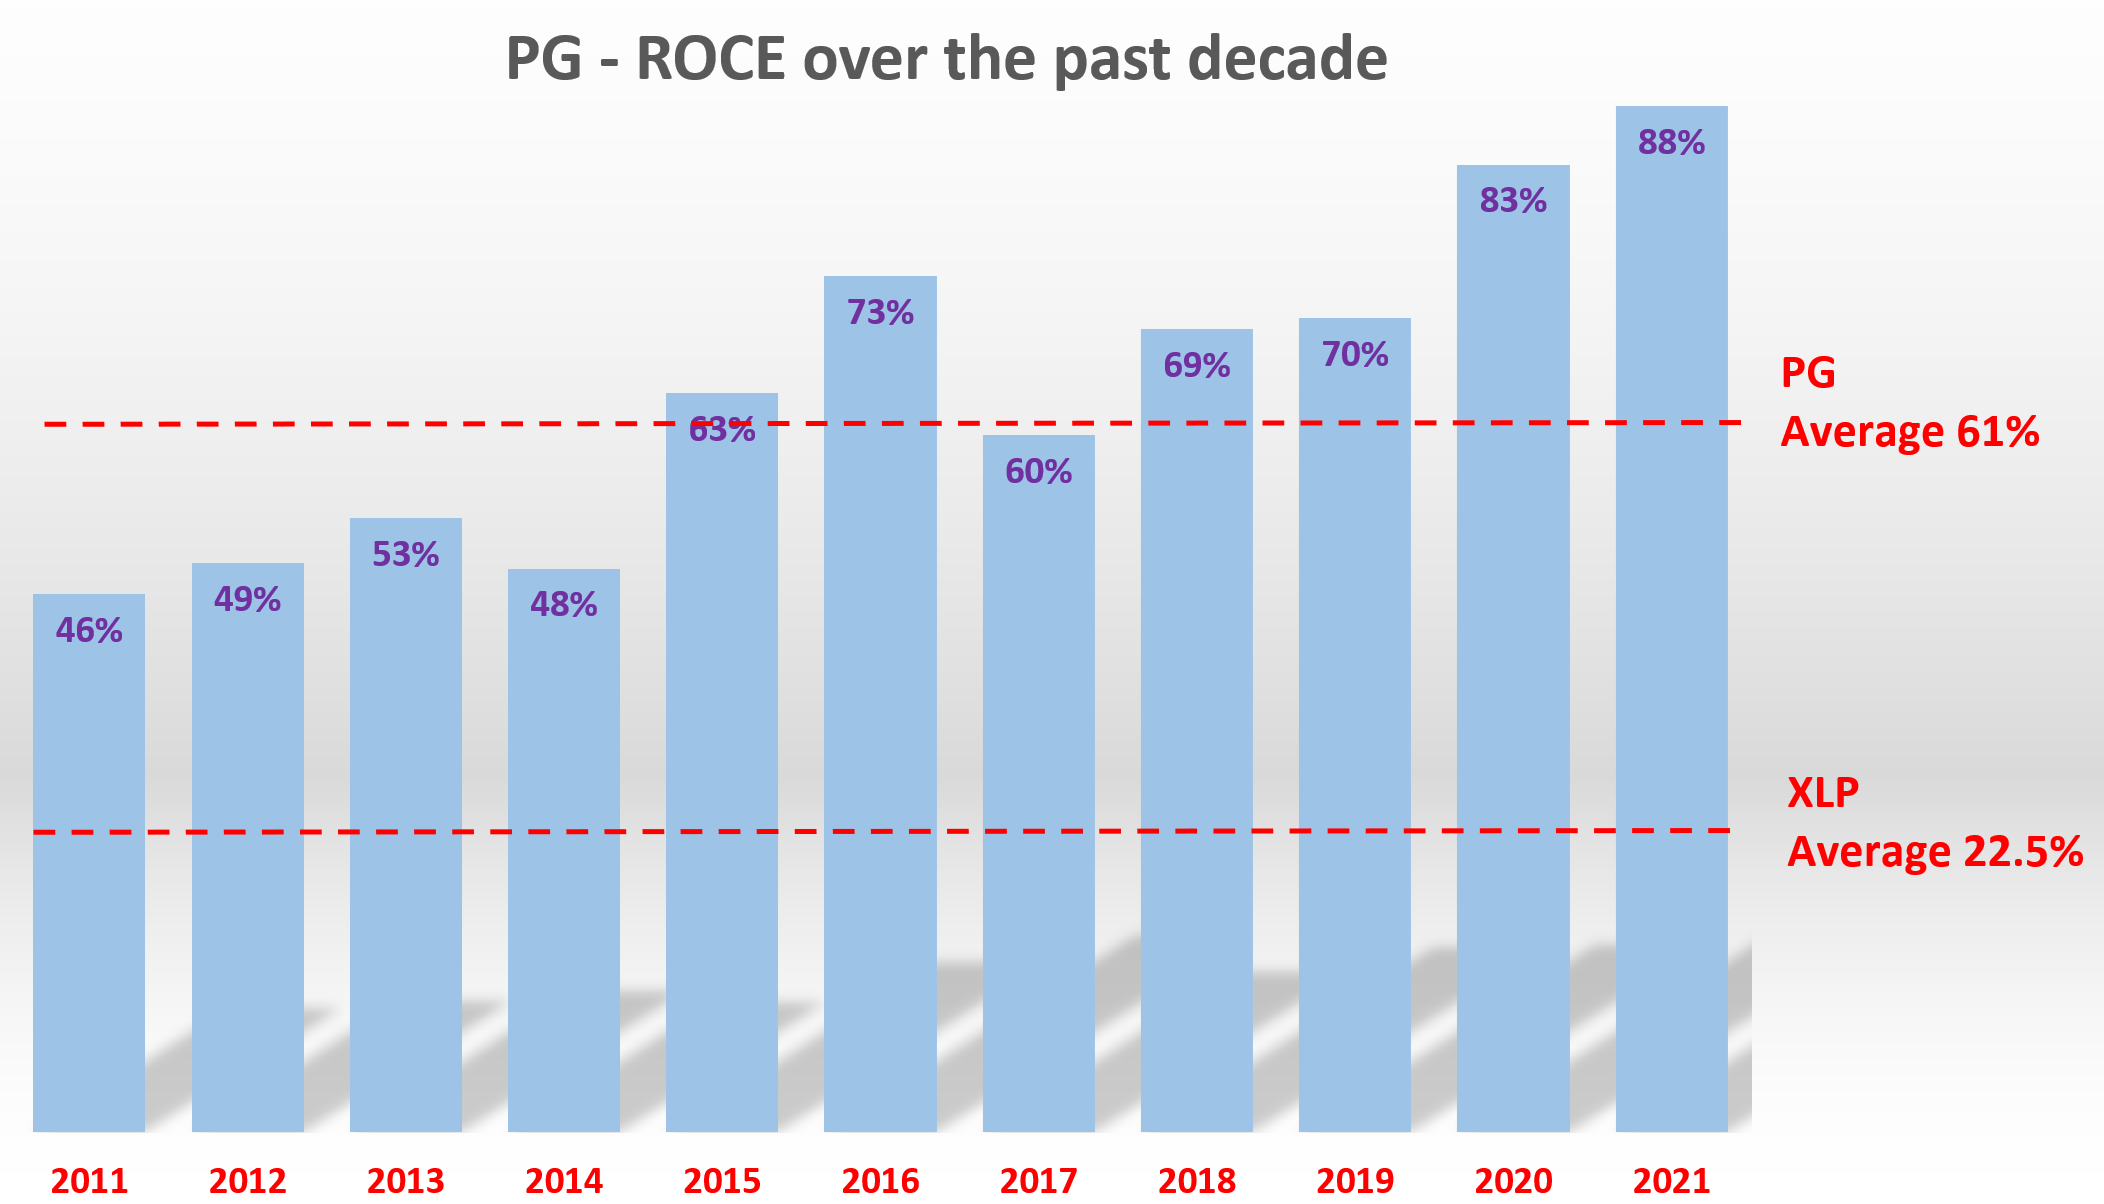
PG and XLP: inflation and dividends
As aforementioned, I totally share Dalio’s view about leading staple stocks like PG under the current inflationary conditions.
PG, thanks to the noticeable superiority in its products, is likely to be much more resilient to inflationary pressure. As its CEO Andre Schulten commented below using the example of Tides and Ariel for cold water washing (abridged and emphases added by me):
Superior offerings delivered with superior execution drive market growth. This drives value creation for our retail partners and builds market share for P&G brands. Noticeable superiority is perhaps the most important in the inflationary environment we are potentially facing. A great example is the formula innovation we’ve launched on Tide and Ariel laundry detergents to enable superior cleaning performance in cold water washing.
All told, the business has provided healthy growth guidance. The growth forecast is sufficient to combat probably the worst inflation projection. To wit, organic sales are projected to grow +6% to +7%, and all-in sales are projected to grow by +4% to +5%. In terms of the bottom line, it has confirmed its all-in EPS growth in the +6% to +9%.
PG earnings report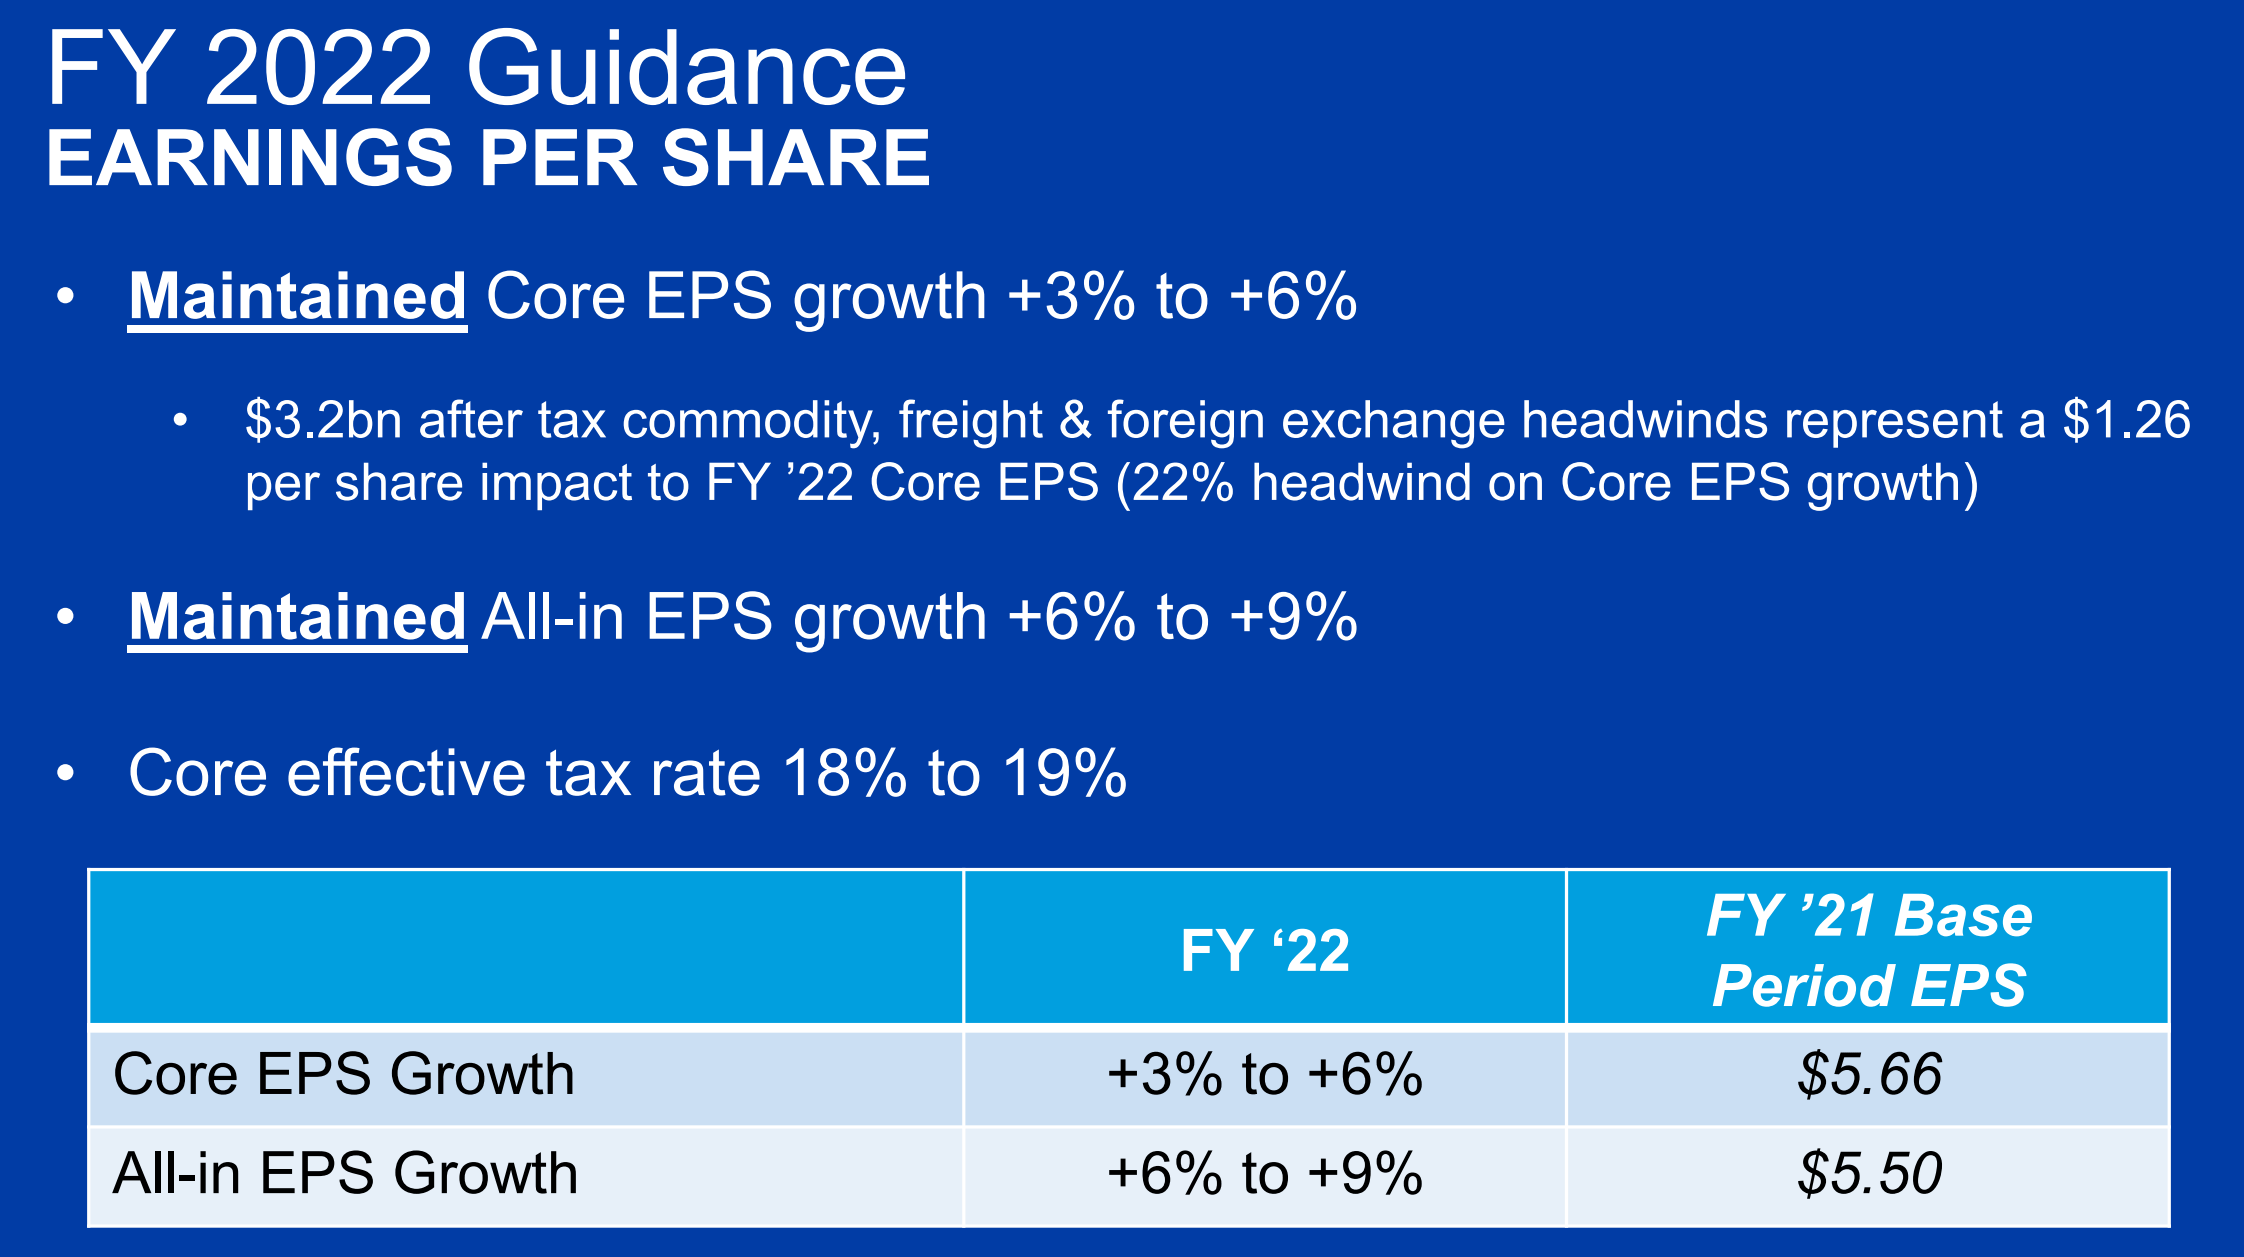
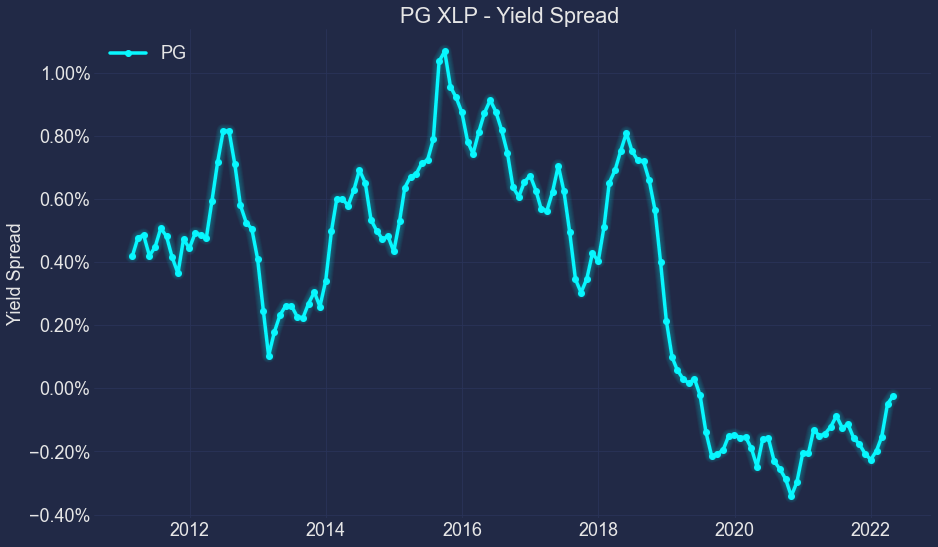
Now, dividends. PG has been paying a much higher dividend yield than XLP historically as you can see from the chart below, on average by about 0.5%. However, due to its price performance, PG currently pays a dividend yield that is on par with XLP (2.46% vs 2.49%). The current yield spread is therefore essentially 0. To put things into a broader perspective, the second chart shows the yield spread between PG and XLP over a longer timeframe. As you can see, the current yield spread is near the lowest level in a decade, a potential risk in our view and the primary reason why we ourselves will stay on the sideline (to be elaborated on in the risk section at the end).
Although, PG’s total yield, once share repurchases are included, is considerably higher. It just increased its direct share repurchase to about $10B. At its current market cap, this would add about 3% to the total yield.
Author Author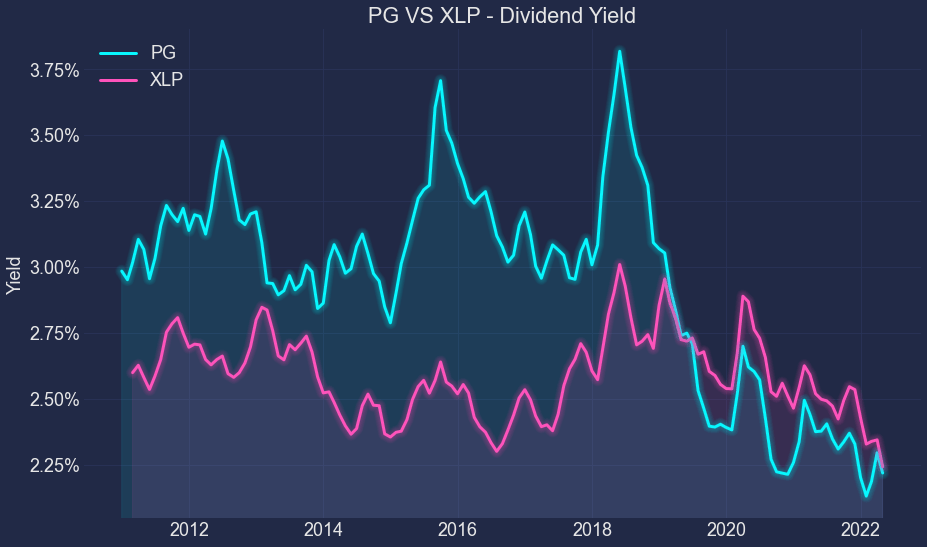
PG and XLP: projected returns
The chart below (our investment roadmap) summarizes my projected returns for PG and XLP. A bit of background on the roadmap. We use it in all our investment decisions to keep us thinking like business owners, not stock traders. As detailed in our earlier article:
- The long-term ROI for a business owner is simply determined by two things: A) the price paid to buy the business and B) the quality of the business. More specifically, part A is determined by the owner’s earning yield (“OEY”) when we purchased the business. And that is why PE is the first dimension in our roadmap. Part B is determined by the quality of the business and that is why ROCE, the most important metric for profitability, is the second dimension in our roadmap.
- Now, the long-term growth rate is governed by ROCE and the Reinvestment Rate. These are the two most important growth engines, and they mutually enhance each other. High ROCE means every $1 reinvested can lead to a higher growth rate, which leads to more future profits and more flexible capital allocation to fuel further growth, and so on. So to summarize:
- Longer-Term ROI = valuation + quality = OEY + Growth Rate = OEY + ROCE*Reinvestment Rate
At its current price levels, the OEY (owners earning yield) from PG is ~4.0%. Note that here I used the FW GAAP EPS guidance as an approximation for the owners’ earnings. The perpetual growth rate is projected to be about 3.0% for PG by assuming a 5% reinvestment rate and 61% average ROCE (perpetual growth rate = ROCE * reinvestment rate = 61% * 5% = 3.1%).
As a result, the total expected return in the long term is about 7.1%, with the majority of it coming from OEY. As aforementioned, it is more attractive than XLP’s ~5% projection (about 3.9% from OEY and about 2.9% from growth). Note these are real returns. And nominal returns will be higher than these projections by whatever the inflation is (and again, PG will have stronger pricing power than the average sector here). Also, note that XLP’s projected return is also lower than the overall market due to its higher valuation. When ROCEs are similar (both in the 20% range), the long-term return will be solely determined by the OEY at the entry point.
Author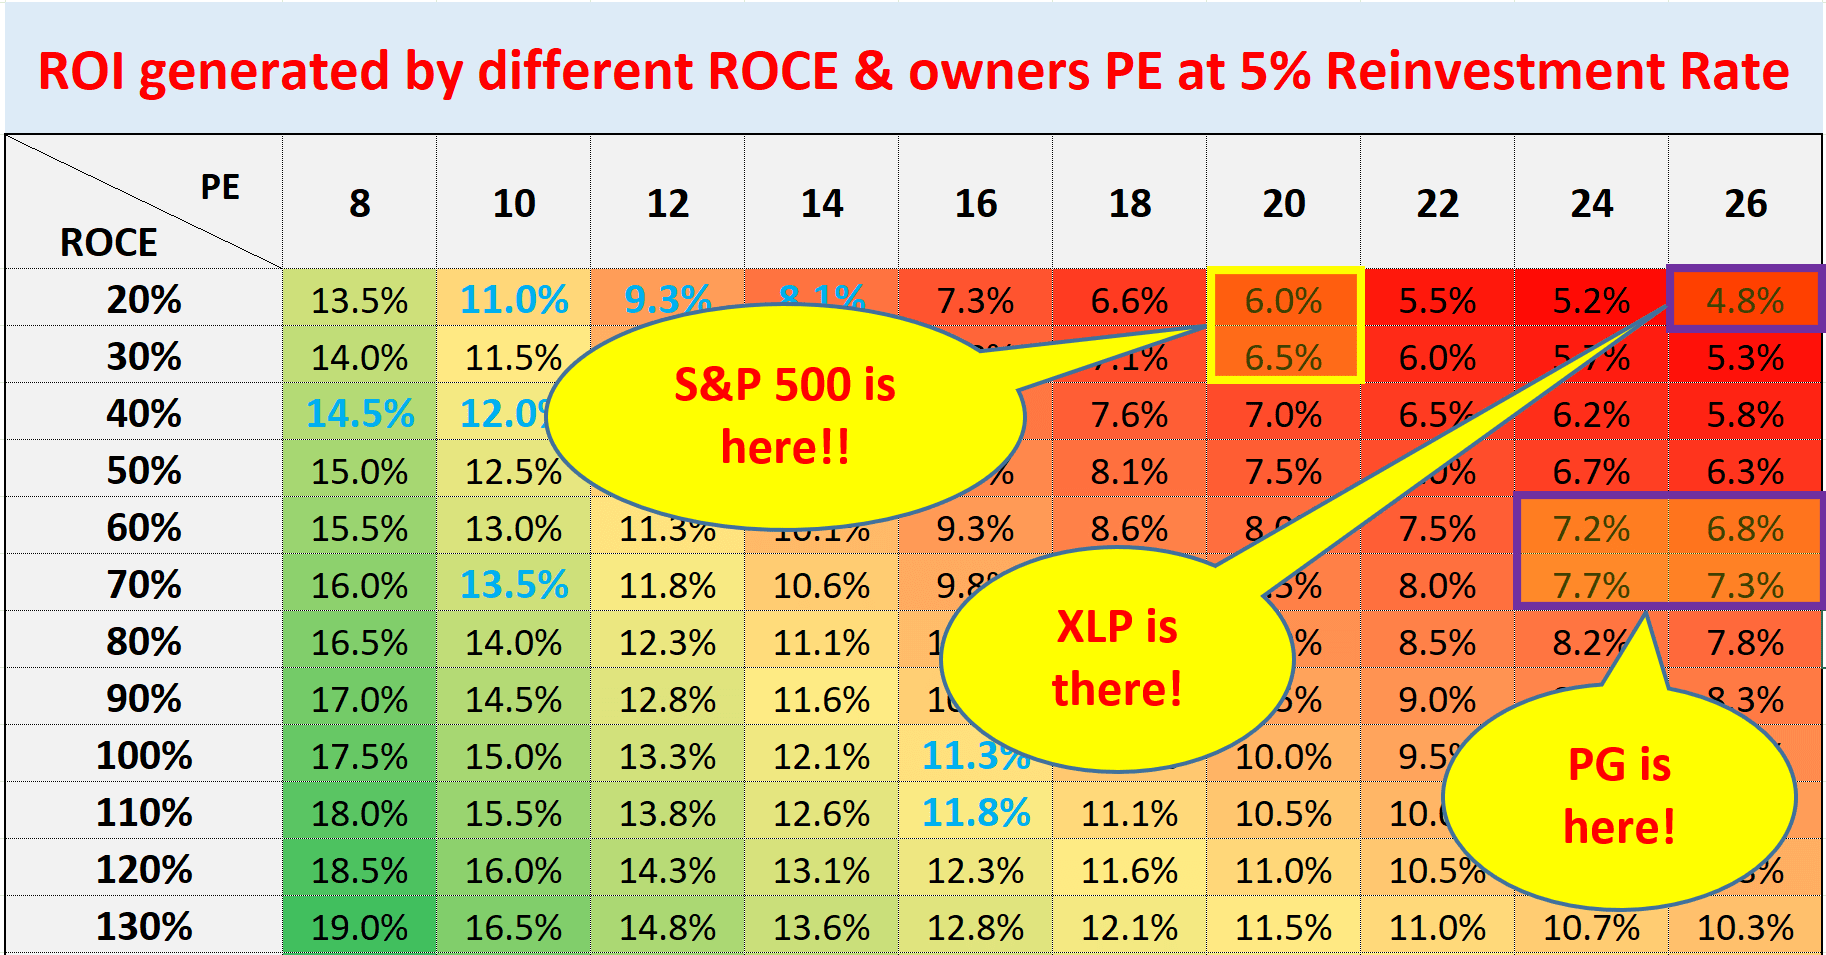
Summary and risks
In summary, I totally share Dalio’s view on high-quality staple stocks like PG under the current inflationary conditions. The same analysis and conclusions can be extended to other of his major staple positions such as WMT, COST, PEP, et al. Many of these stocks offer profit superiority but are not demanding premier valuation under their current conditions. In PG’s case, its ROCE now hovers above 80% in recent years, compared to XLP’s 22.5%. Yet, PG is for sales at a lower valuation than XLP. As such, I expect favorable odds for PG to outperform XLP and I expect the alpha to be about 2% per annum compared to 1% observed in the past since 2000.
Finally, risks. First, as aforementioned, neither PG nor XLP is cheap. Our sector dashboard below shows that, in terms of risk premium relative to risk-free rates, the consumer staples sector is now in the middle range of all sectors (you can see the full dashboard here). It features a small positive dividend yield Z-score of 0.27 (a good sign) but a quite negative yield spread Z-score of -0.9 (which is a bad sign).
To add to the valuation risks, the overall market is at an elevated valuation itself. It features a very narrow positive dividend yield Z-score of 0.13 and again a quite negative yield spread Z-score of -0.83 (both obtained by simply averaging all the sectors in the dashboard). And PG itself features a yield spread relative to both the overall market and XLP near the thinnest level in a decade.
Author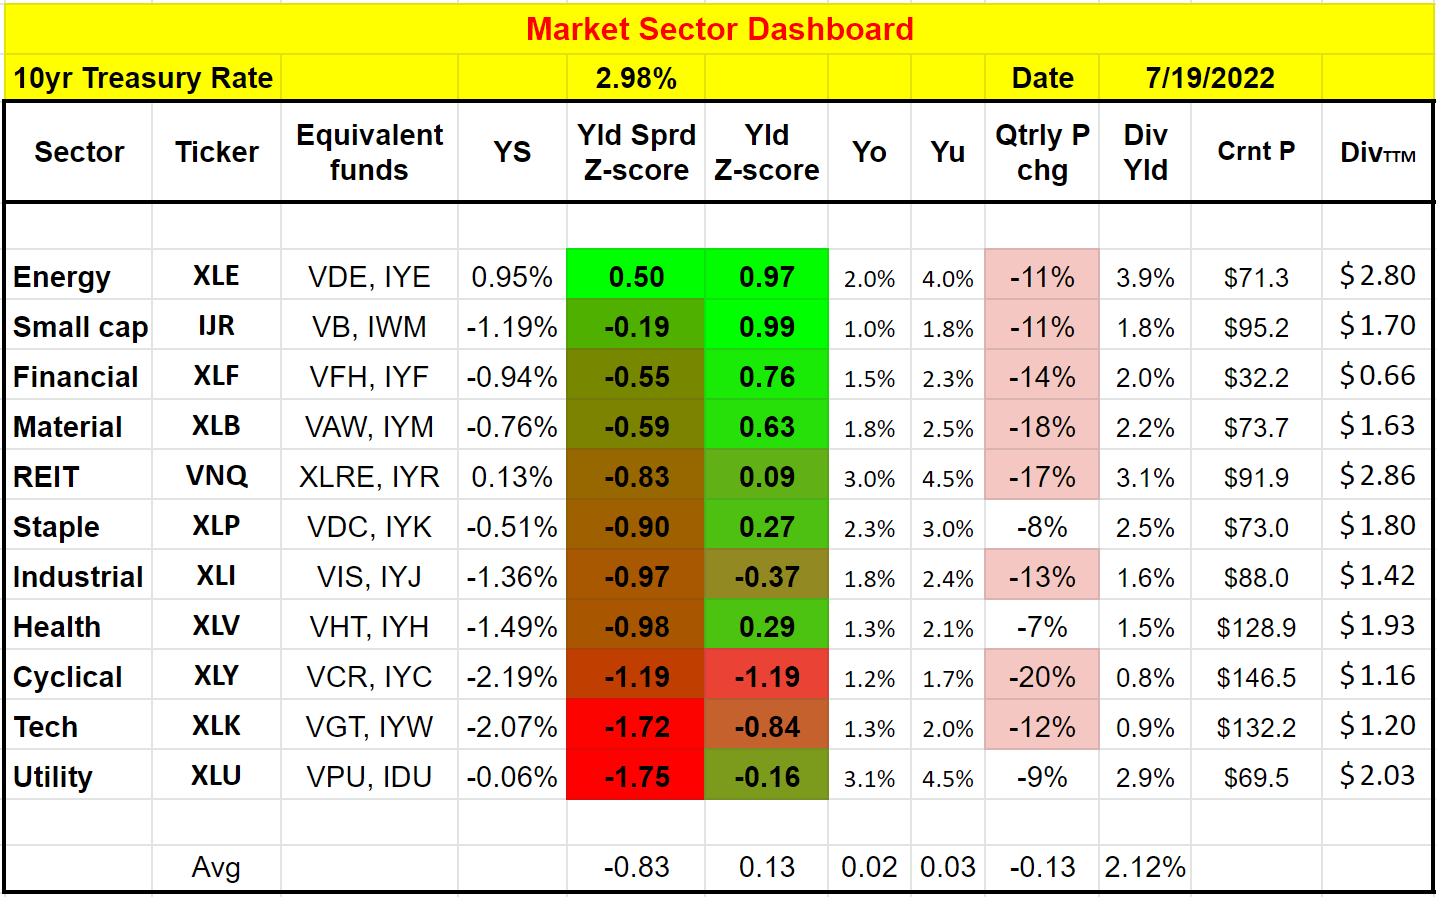
Be the first to comment