

Oil Price Talking Points
The price of oil climbs to a fresh yearly high ($69.40) even though the Organization of the Petroleum Exporting Countries (OPEC) stay on track to gradually restore production, and crude may continue to exhibit a bullish trend as it extends the series of higher highs and lows from the start of the month.
Oil Price Forecast: Break of March High Negates Double Top Formation
The recent rally in the price of oil removes the threat of a double-top formation as it clears the March high ($67.98), and crude may approach the 2018 high ($76.90) as recent data prints coming out of the US instill an improved outlook for consumption.
Fresh figures from the Energy Information Administration (EIA) show crude inventories narrowing for the second straight week, with US stockpiles falling 5.08M in the week ending May 28 versus forecasts for a 2.443M decline.
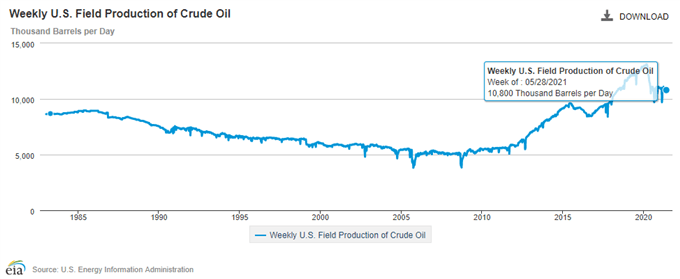
At the same time, a deeper look at the report shows US weekly field production slipping to 10,800K from 11,000K during the same period to mark the first slowdown since April, and the data prints may encourage OPEC and its allies to lay out a new production adjustment table at the next Joint Ministerial Monitoring Committee (JMMC) meeting on July 1 as the group acknowledges the “ongoing strengthening of market fundamentals, with oil demand showing clear signs of improvement.”
It seems as though OPEC and its allies will continue to push production towards pre-pandemic levels as US output remains at its lowest level since 2018, and the steady approach in re-balancing the energy market may keep the price of oil afloat as the most recent Monthly Oil Market Report (MOMR) forecasts world oil demand in 2021 to “increase by 6.0 mb/d, unchanged from last month’s estimate, to average 96.5 mb/d.”
With that said, the price of oil may approach the 2018 high ($76.90) as the break above the March high ($67.98) removes the threat of a double top formation, and looming developments in the Relative Strength Index (RSI) may show the bullish momentum gathering pace as the indicator approaches overbought territory.
Oil Price Daily Chart
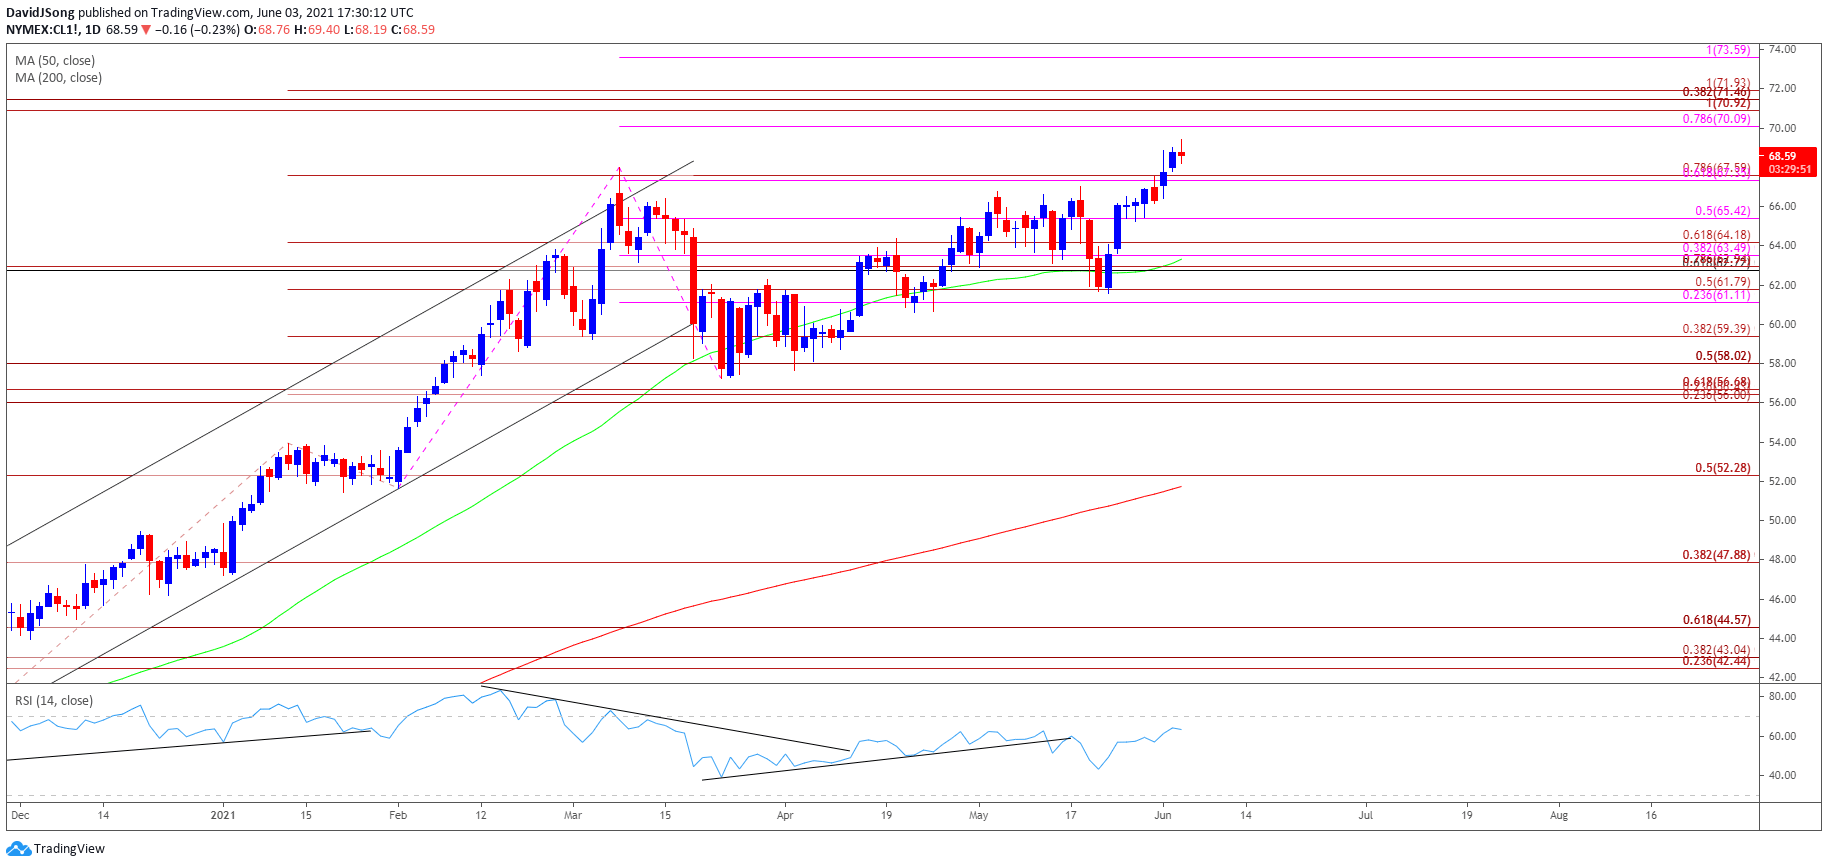
Source: Trading View
- Keep in mind, crude broke out of the range bound price action from the third quarter of 2020 as it established an upward trending channel, with the price of oil taking out the 2019 high ($66.60) as both the 50-Day SMA ($63.33) and 200-Day SMA ($51.74)established a positive slope.
- The price of oil may continue to exhibit a bullish trend as the recent rally removes the threat of a double-top formation, with the break above the March high ($67.98) bringing the Fibonacci overlap around $70.10 (78.6% expansion) to $70.90 (100% expansion) on the radar as crude extends the series of higher highs and lows from the start of the month.
- Next area of interest comes in around $71.50 (38.2% expansion) to $71.90 (100% expansion) followed by the $74.60 (100% expansion) region.
- Will keep a close eye on the Relative Strength Index (RSI) as it climbs towards overbought territory, with a move above 70 in the indicator likely to be accompanied by higher oil prices like the behavior seen in February.
— Written by David Song, Currency Strategist
Follow me on Twitter at @DavidJSong
Be the first to comment