

Vera Bracha
Medical device stocks have struggled in 2022. The iShares U.S. Medical Devices ETF (IHI) is down 27% total return this year while the S&P 500 ETF (SPY) is off just 20%. The broader Health Care sector (XLV) has produced alpha with just a 9.2% YTD drop.
One of IHI’s biggest components has an earnings report this week and has outperformed. Will the relative strength continue? Let’s investigate.
BSX Beating IHI & XLV Handily In 2022
Stockcharts.com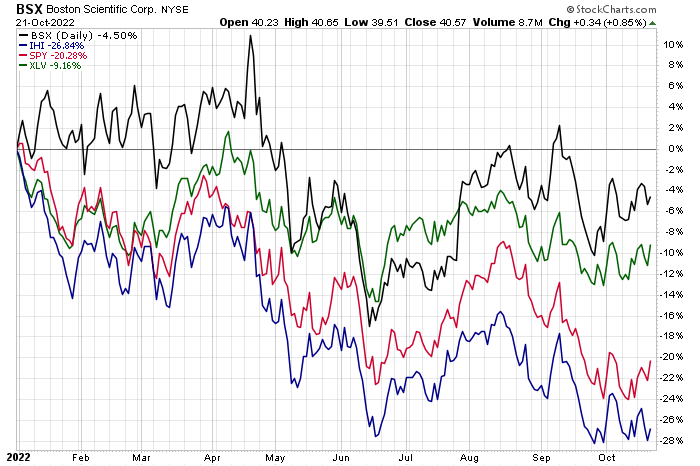
Top Earnings This Week
Wall Street Horizon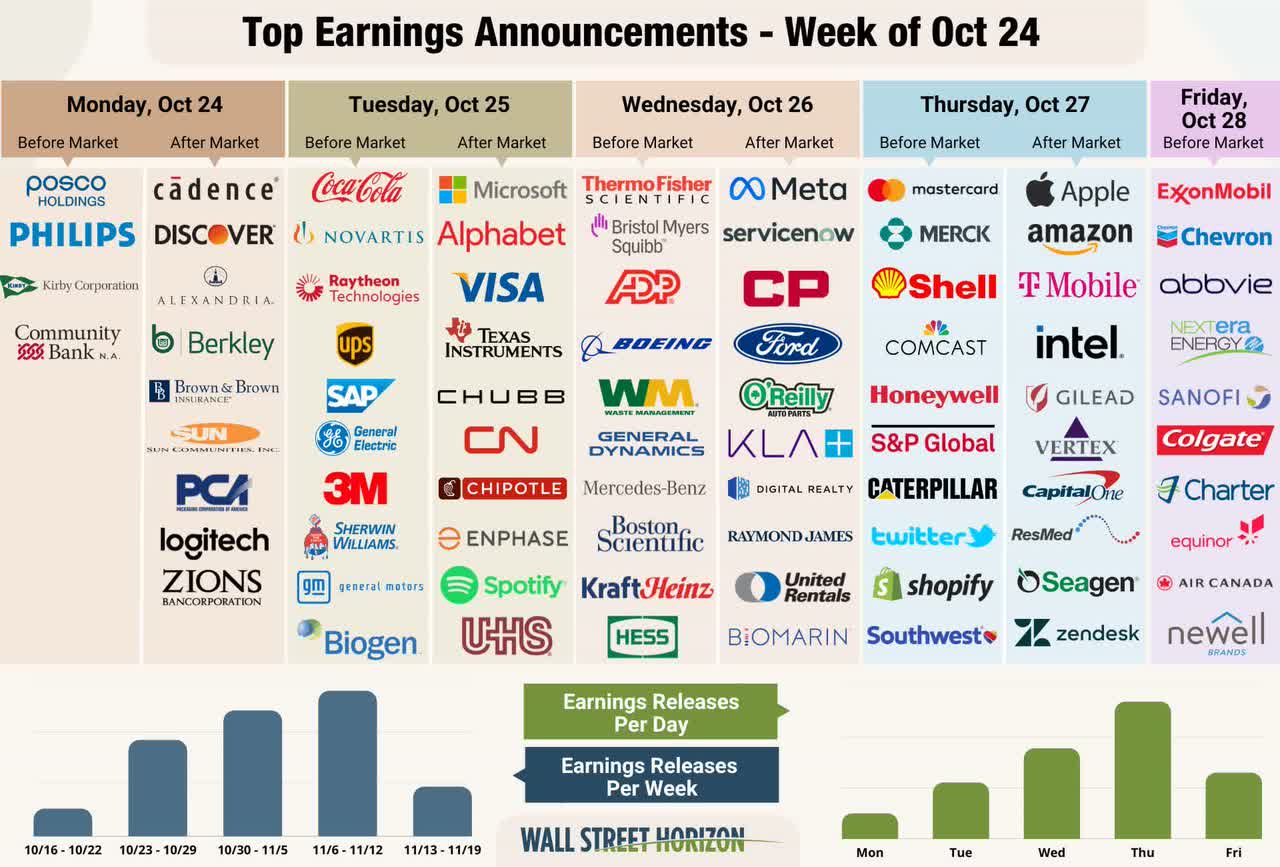
According to Bank of America Global Research, Boston Scientific (NYSE:BSX) develops, manufactures, and markets medical devices that are used in interventional cardiology, peripheral interventions, vascular surgery, electrophysiology, neurovascular intervention, oncology, endoscopy, urology, gynecology, and neuromodulation.
The Massachusetts-based $58.1 billion market cap Health Care Equipment & Supplies industry company within the Health Care sector trades at a high 70.4 trailing 12-month GAAP price-to-earnings ratio and does not pay a dividend, according to The Wall Street Journal.
The firm has a solid revenue stream which should help buffer against rising costs. There are also some upside growth opportunities as a result of some recent acquisitions. The hope for the bulls is that those solid foundations turn accretive to earnings by next year and in 2024.
Downside risks include declining growth from its key Watchman device should competition grow. Moreover, supply chain disruptions linger which could, alongside general inflation trends, increase costs and pressure margins.
On valuation, BofA analysts see earnings rising at a solid and steady clip through 2024. The Bloomberg consensus forecast is slightly more optimistic, too. Meanwhile, the company’s operating and GAAP P/E ratios turn attractive given the low-volatility earnings growth.
Seeking Alpha notes that the stock’s forward PEG ratio is 2.0 which does not scream cheap, but it’s reasonable. Its EV/EBITDA multiple is above the market’s, but not excessive. Finally, BSX sports low to moderate free cash flow. Overall, I continue to like the valuation.
BSX: Earnings, Valuation, Free Cash Flow Forecasts
BofA Global Research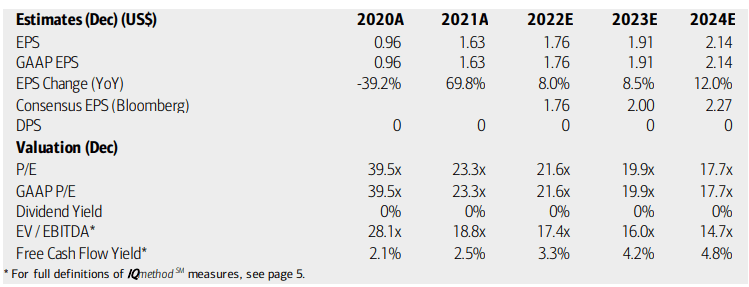
Looking ahead, data from Wall Street Horizon show a confirmed Q3 earnings date of Wednesday, Oct. 26 BMO with a conference call immediately after results hit the tape. You can listen live here. The corporate event calendar is light aside from the earnings report.
Corporate Event Calendar
Wall Street Horizon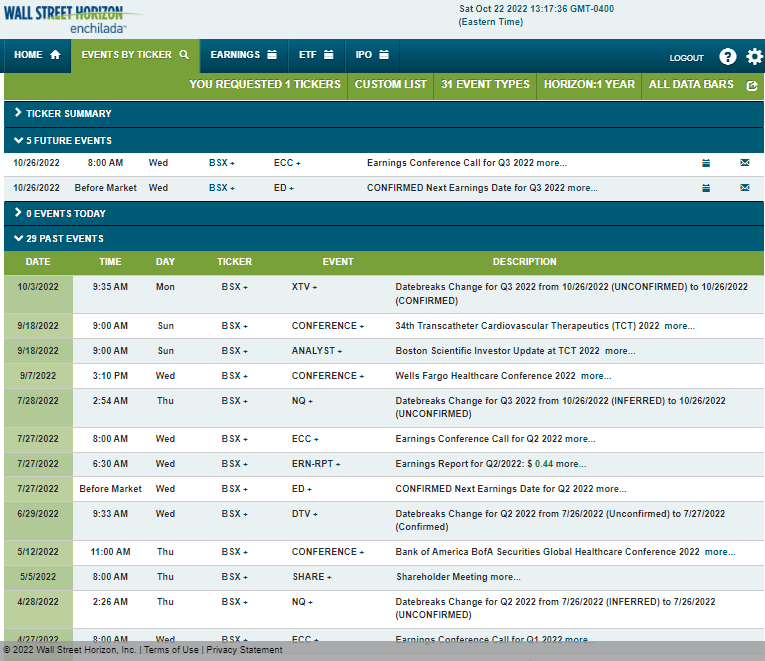
The Options Angle
Data from Option Research & Technology Services (ORATS) show a consensus EPS forecast of $0.44 per share, which would be a modest increase from $0.41 reported in the same quarter a year ago. BSX has a strong earnings beat rate history, topping analysts’ estimates in each of the previous six quarters. Since it last reported back in July, there has been one analyst upgrade of the stock and a single downgrade.
In terms of stock price movement expectations, the options market has priced in a small 4.4% earnings-related share price swing after Wednesday morning’s report using the nearest-expiring at-the-money options. That’s about in line with past reports. Overall, nothing jumps out to me regarding options activity ahead of Wednesday. Let’s see what the chart has to say.
BSX: A Solid EPS Beat Rate History, Shares Seen Moving Slightly Post-Earnings
ORATS
The Technical Take
BSX is just fractionally lower for the year, outpacing the broad market. Additionally, the stock is well off its June low, which cannot be said for the S&P 500. That relative strength is a bullish factor. Still, the stock has simply traded sideways since its July earnings report. I see resistance in the $42 to $44 range which happens to show a high volume-by-price figure (indicator on the left side of the chart).
The stock also had bearish divergence in September when price made a new high, but the RSI indicator had a lower high. That pattern resolved itself with a gap fill in September. I think the stage is set for a move higher, but I would like to see shares climb above $44. I lean bullish on the chart due to its relative strength.
BSX: Sideways Is Good In 2022
Stockcharts.com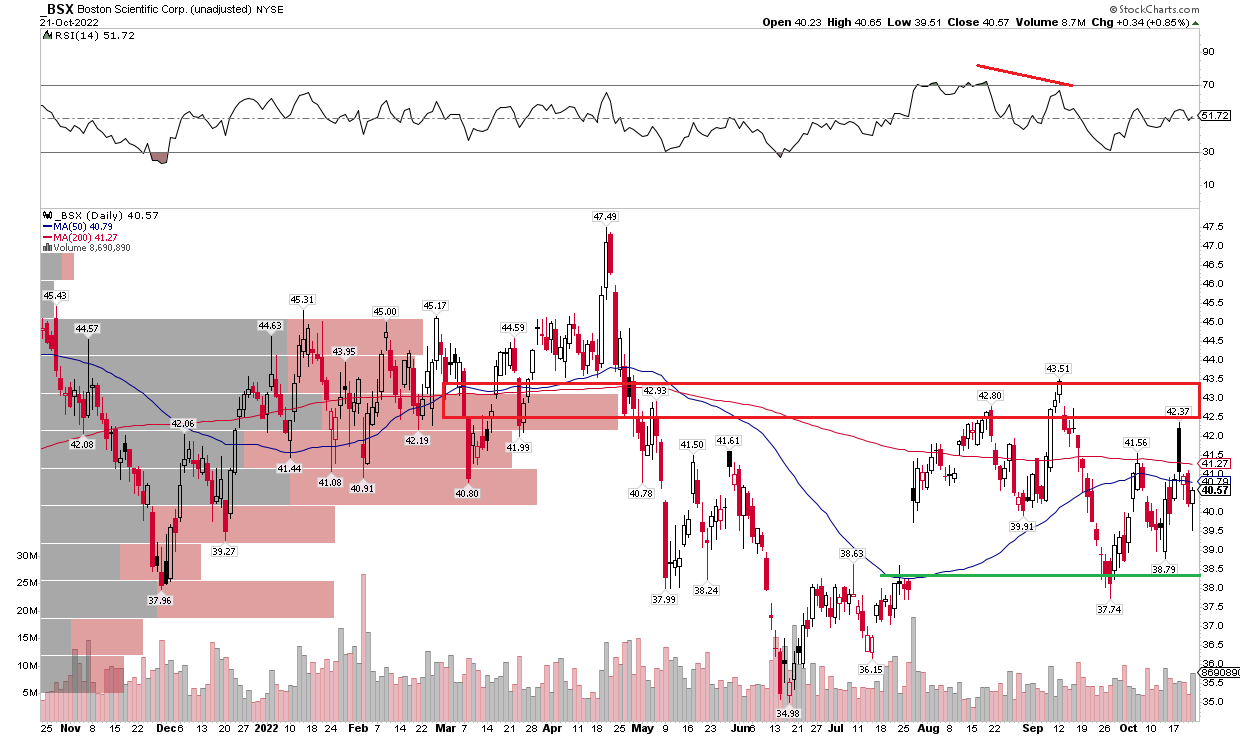
The Bottom Line
BSX continues to have a reasonable valuation and positive relative price trends. The fundamentals and technicals suggest a soft ‘buy’ recommendation still.
Be the first to comment