

BrianAJackson/iStock via Getty Images
It’s been a rough nine-month stretch for the Retail Sector (XRT), which is down 40% from its highs, significantly underperforming the S&P 500 (SPY). This is partially attributed to the near-insurmountable comps the group was up against coming into H1 2022, benefiting from wardrobe refreshes post-lockdown and the benefit of government stimulus. One name that’s been hit especially hard that came off a phenomenal year is Boot Barn (NYSE:BOOT), which has found itself 56% from its highs and downgraded back to small-cap status after its violent decline.
Unfortunately, the company’s fiscal Q1 2023 report didn’t help the stock, with the decent sales performance overshadowed by a weaker than expected guide for the remainder of the year. However, with Boot Barn tilting less towards discretionary (work boots, workwear) than some of its peers, the stock looks better positioned to weather a recessionary environment. Meanwhile, the stock is now becoming attractively valued, trading at just ~10.4x FY2023 earnings estimates. Given this superior positioning and strong unit growth rates, I would view any pullbacks below $54.50 as buying opportunities.
Boot Barn (Company Website)
Just over eight months ago, I wrote on Boot Barn, noting that the stock’s near-parabolic ascent was an opportunity to sell positions into strength above $128.00 per share. The reason? BOOT was the most overbought since its IPO debut, with previous instances seeing a median 1-year forward drawdown of 52%, and it was trading at a lofty valuation of 26x forward earnings. Since then, the stock has returned to reality, declining 55% from its highs and massively underperforming the S&P 500. For investors who were patient and waited on the sidelines for a larger margin of safety, this deep correction appears to be getting long in the tooth. Let’s take a closer look below:
BOOT – Technical Chart November 2021 (TC2000.com, Seeking Alpha Premium )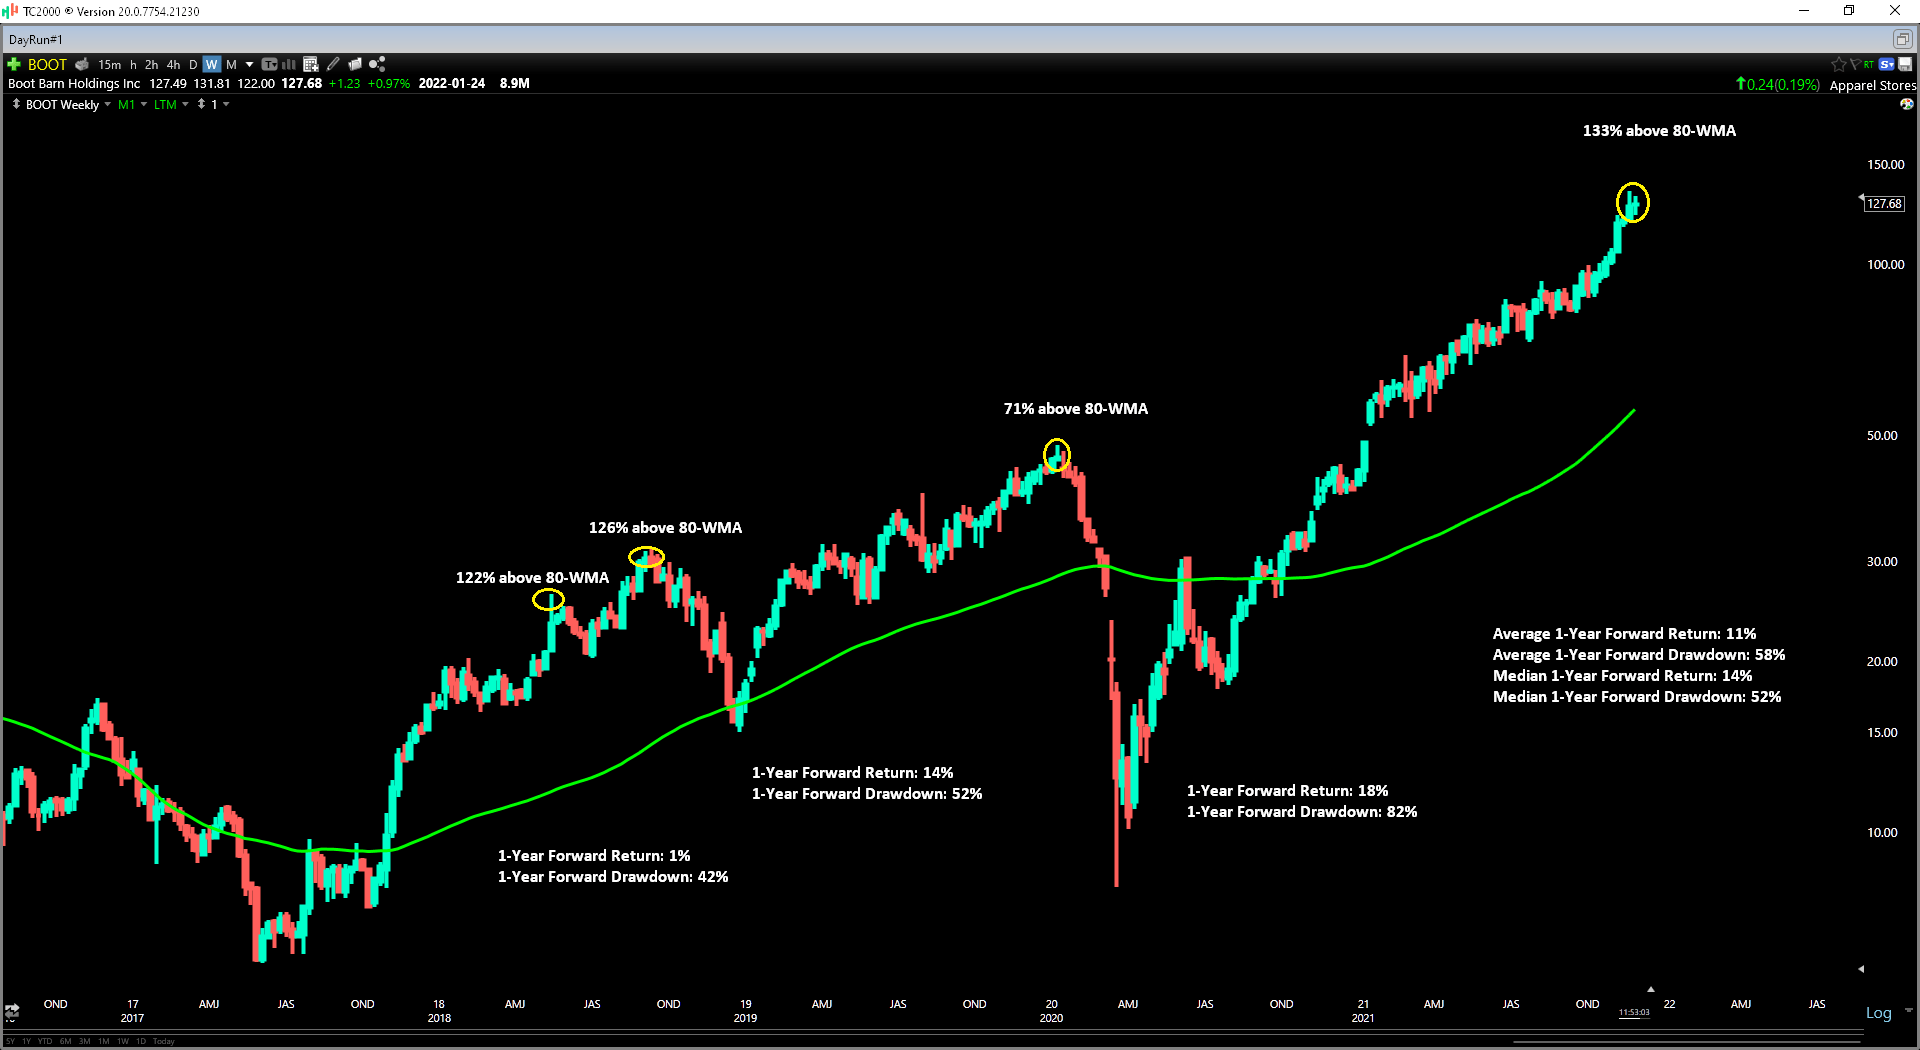
Q1 2023 Results
Boot Barn released its fiscal Q1 2023 results last week, reporting quarterly revenue of $365.9 million, a 19% increase year-over-year. These solid results lapped 65% growth in the year-ago period, driven by 10% same-store sales growth and double-digit unit growth. On a 3-year basis, the company reported a phenomenal 97% sales growth rate, and an increase in transactions in Q1 helped sales with continued growth in new customers. As importantly, Boot Barn enjoyed continued merchandise margin expansion, fueled by full-priced selling and continued exclusive brand penetration.
Boot Barn – Quarterly Revenue (Company Filings, Author’s Chart)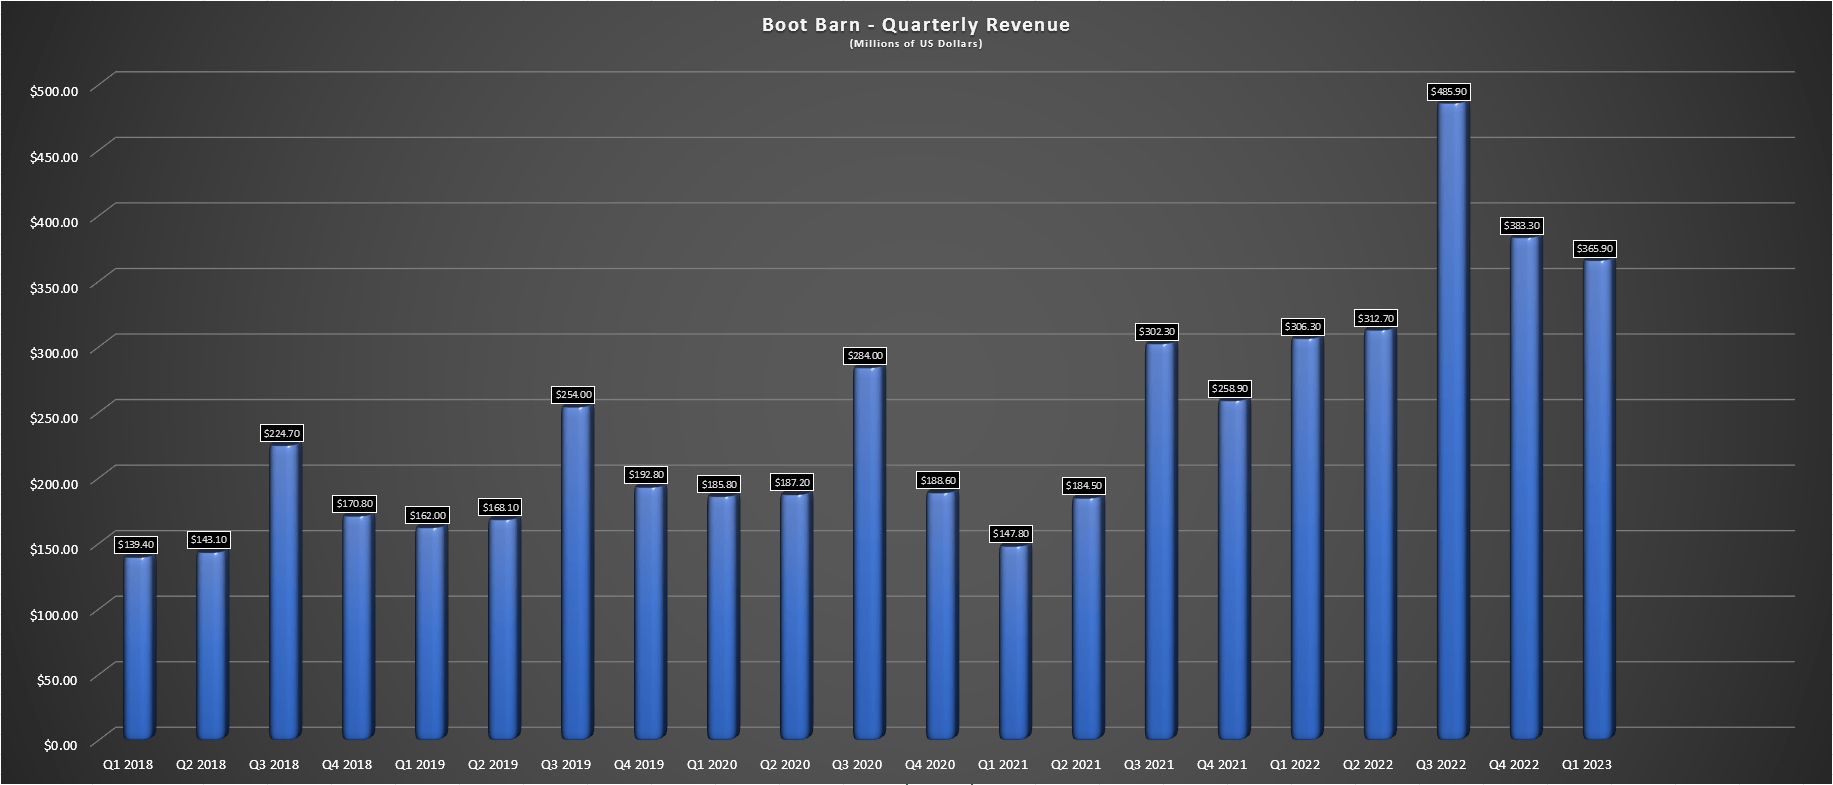
Given the solid sales performance and unit growth, investors might have expected the stock to be up sharply on the report. However, the impressive sales performance was overshadowed by the deceleration in sales heading into fiscal Q2 (June 25th through late July), which showed comp sales sliding 730 basis points on a sequential basis to 0.6%. This prompted the company to reel in its previous FY2023 guidance, adjusting its sales estimates from $1.74 billion to $1.69 billion and its same-store sales forecasts from 4.8% to “flat to 2%” for the year. Meanwhile, annual EPS is forecasted at $6.10 at the mid-point, down from $6.41 previously, despite a slightly lower share count assumption.
While this update certainly isn’t ideal, and there might be some worries about marking down items if sales trends remain flat to negative, there is a silver lining. This is that the company defines 87% of its inventory as functional, with just 13% of its inventory being fashion (ladies boots/apparel), which is the segment that saw the most deceleration. This suggests that markdowns shouldn’t be a huge concern, and even if mom and pop retailers in the industry do turn to promotions to help shed some inventory, Boot Barn does not plan to shift to a more promotional posture and chase sales.
Boot Barn – Exclusive Brand Sales (Company Presentation)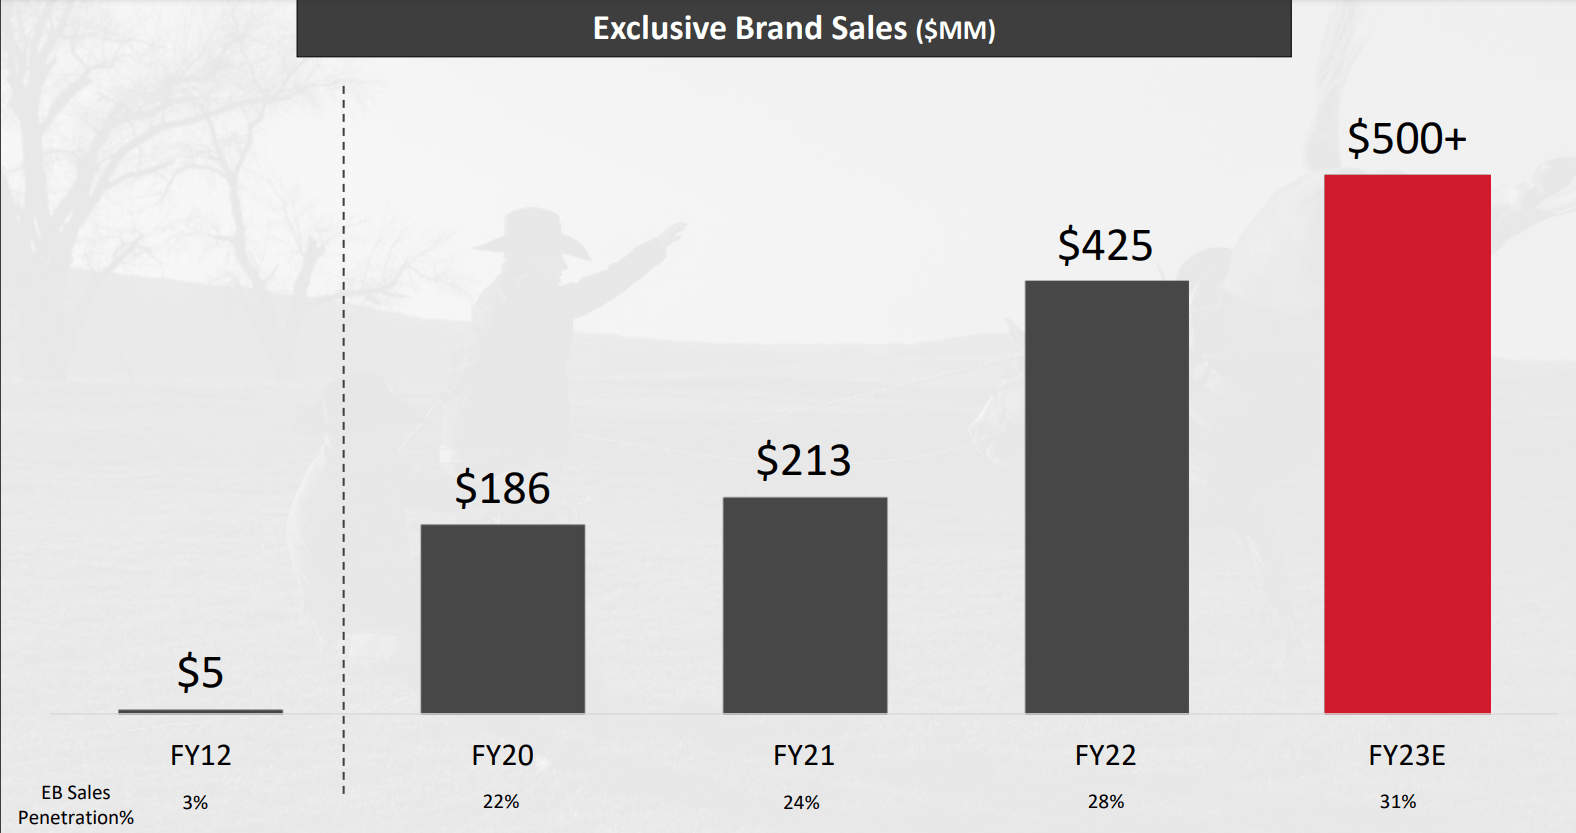
Boot Barn also noted that it hadn’t seen any real sign of trading down so far, potentially because its more affluent customers have maintained their shopping frequency vs. its less affluent customer base. So, while the dip in transactions might be concerning some investors, which would seem to confirm that the consumer is not as strong as previously expected, Boot Barn appears more insulated than its peers to hold onto its earnings gains. This is due to continued exclusive brand penetration (carrying higher margins), a less discretionary tilt than some of its peers, and industry-leading unit growth rates (40 stores in FY2023 alone). Let’s take a look at its earnings trend below:
Earnings Trend
Boot Barn has one of the most impressive earnings trends in the Retail Sector, seeing its annual earnings per share [EPS] grow from $0.70 in FY2015 to $6.18 in FY2022. This was driven by industry-leading same-store sales growth and strong unit growth and translated to an incredible ~36.5% compound annual EPS growth rate in the period. However, with some margin give-back expected in FY2023 and a sharp deceleration in sales growth, annual EPS is expected to decline to $5.95 based on current estimates, a nearly 4% decline year-over-year.
Boot Barn – Earnings Trend (YCharts.com, Author’s Chart, FactSet)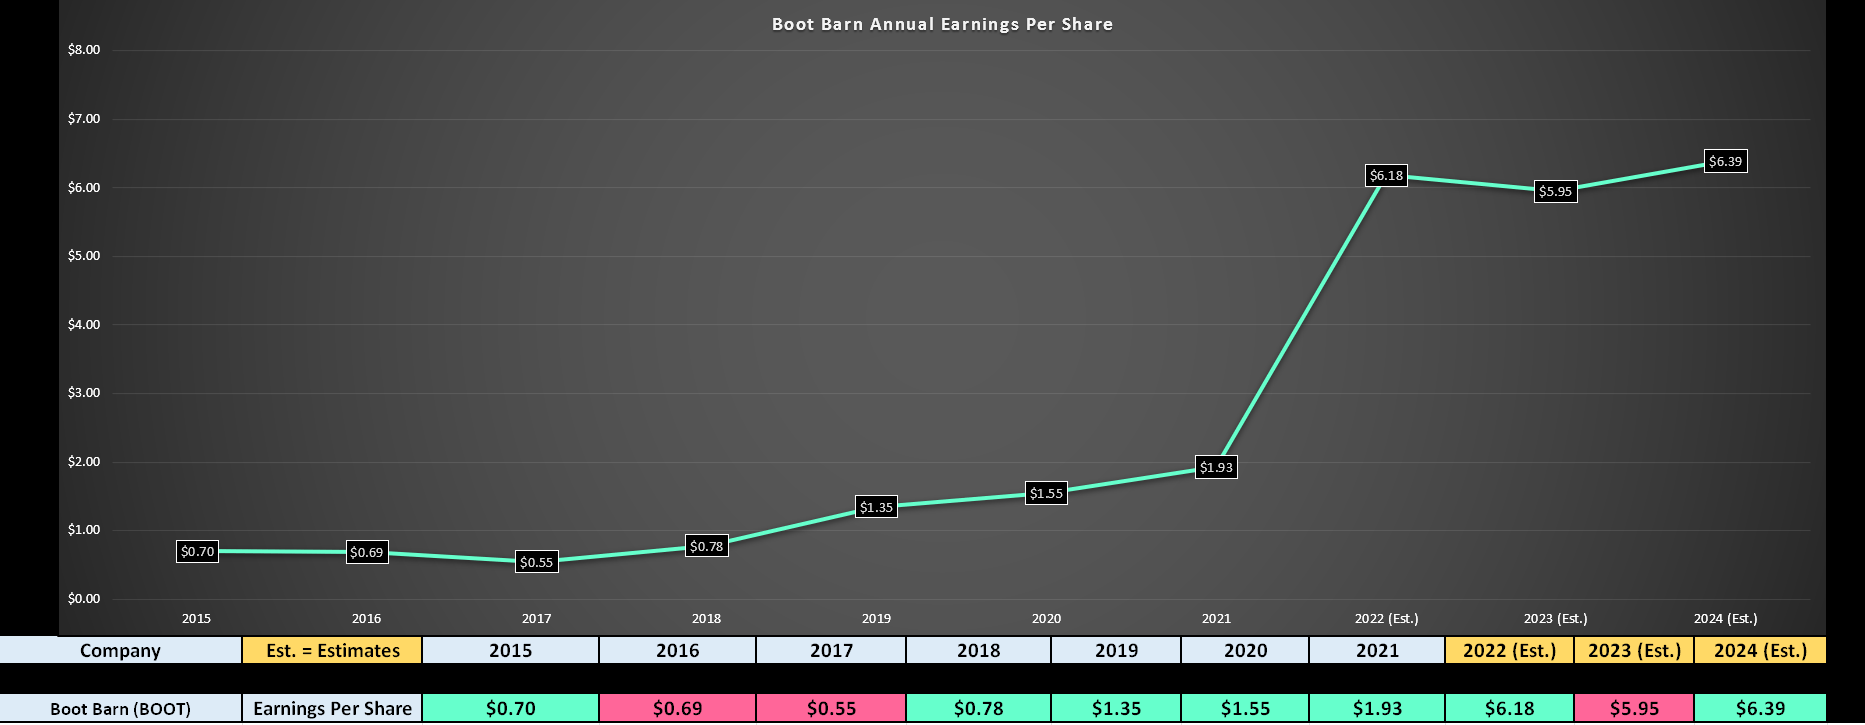
After lapping a year of 220% annual EPS growth, I do not see this slowdown as material at all, and the fact that it’s maintaining ~95% of this growth is actually quite impressive. However, growth stocks tend to come under considerable pressure when earnings peak, even temporarily, and this is what we’re seeing for Boot Barn currently. The good news is that, based on current estimates for FY2024, the dip in FY2023 annual EPS appears to be an aberration in the long term, with new highs on deck in FY2024.
Given that BOOT’s earnings are expected to head to new highs in FY2024, this is more likely to be a sharp correction followed by a resumption in its multi-year uptrend for BOOT. This would be the opposite of what we saw from Crocs (CROX) last decade, which was a massive peak in earnings with sustained year-over-year declines, leading to a multi-year downtrend. Hence, with Boot Barn finding itself down more than 5% from its highs, the stock is finally worth monitoring for potential signs of a bottoming setup.
Crocs Peak Earnings (2007/2012) (FASTGraphs.com)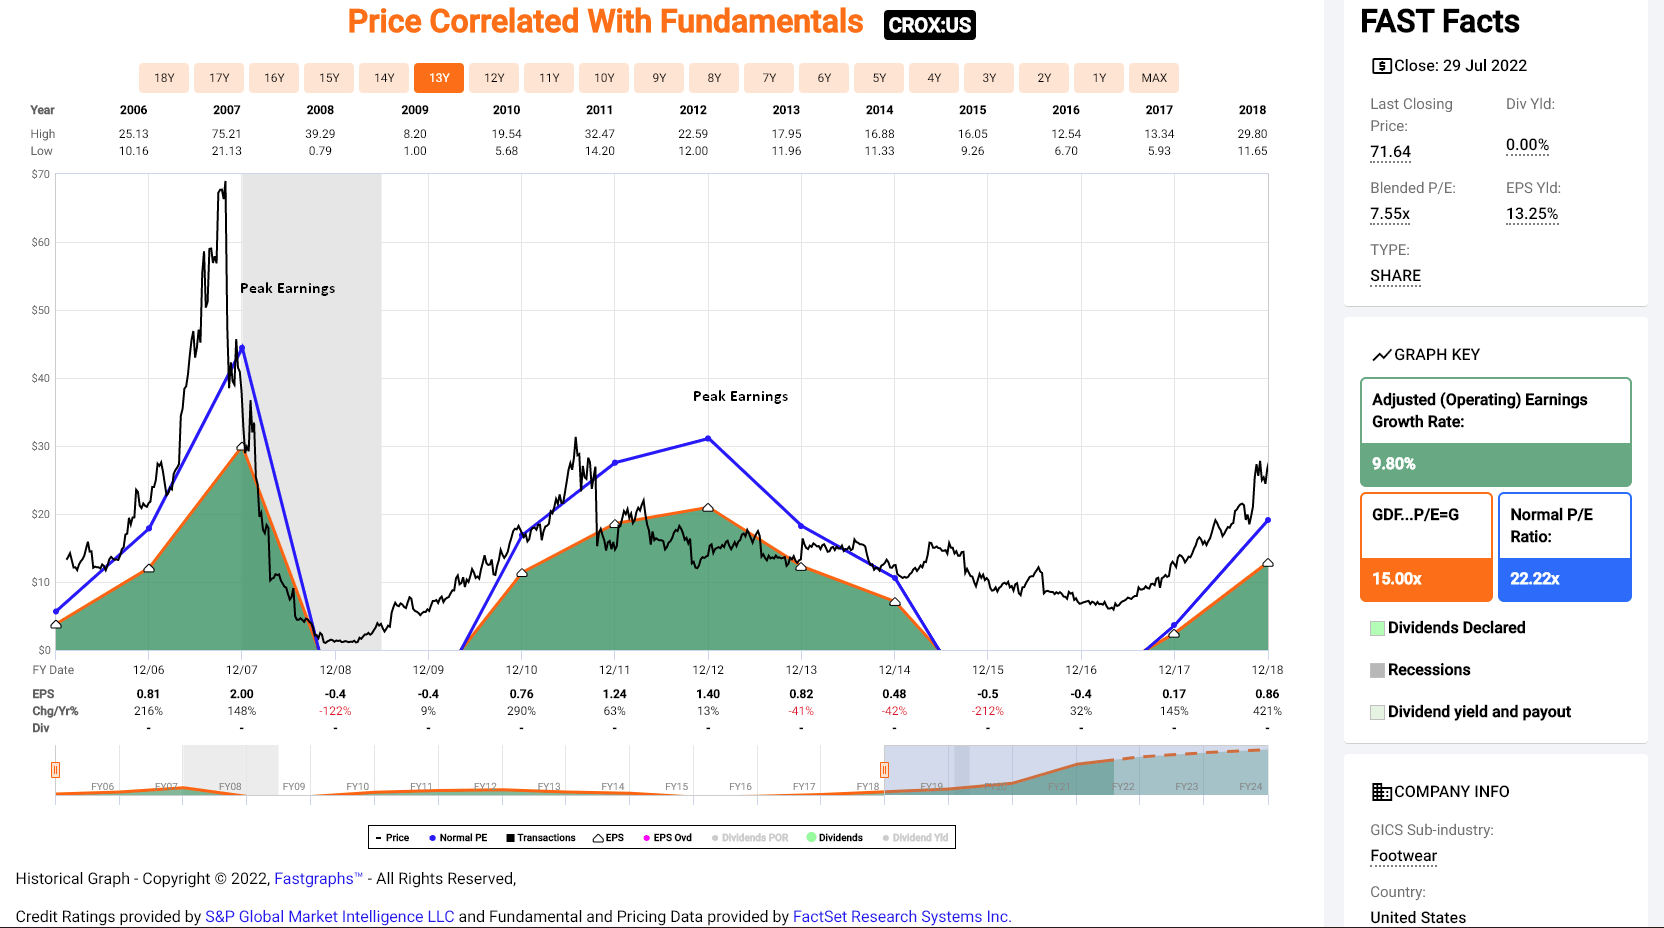
Valuation
Looking at the chart below, Boot Barn has historically traded at 20.5x earnings, a premium multiple relative to other names in the retail space like American Eagle (AEO) and Foot Locker (FL). This can partially be attributed to the company’s phenomenal annual EPS growth and its stronger operating margins. Based on FY2023 annual EPS estimates ($5.95) and a share price of $62.30, one could argue that the stock is trading at a massive discount to fair value if one assumes that a fair multiple for the stock is 20.5.
Boot Barn – Historical Earnings Multiple & Multiple At Troughs (FASTGraphs.com)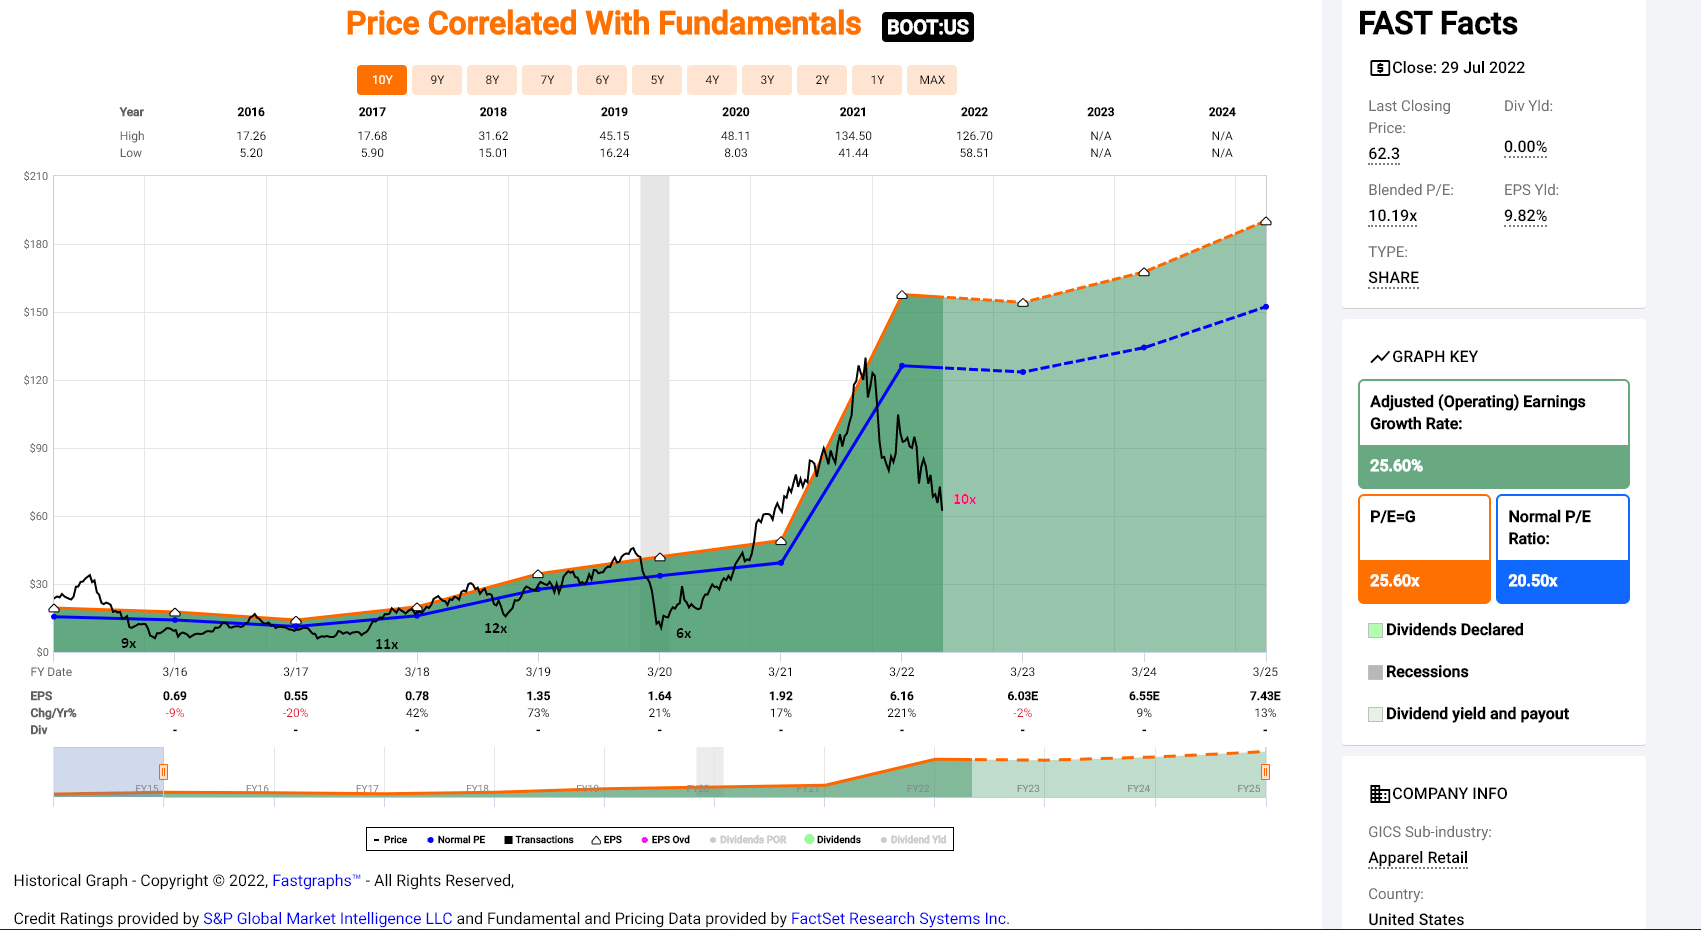
In my view, this is a rich multiple, even if this is a solid business. This is because the stock’s earnings appear to have peaked temporarily, and we look to be in a recessionary environment. As discussed by the company, it handled the previous recessionary period even with a simultaneous major dent in oil/gas prices. However, we often see considerable multiple compression for stocks in recessionary periods. We also often see stocks overshoot their fair value to the downside by a wide margin when earnings have peaked. Based on these factors, I think a more conservative multiple is 15x earnings vs. its historical multiple of 20.5x earnings.
Assuming a miss on FY2023 earnings estimates to be conservative ($5.90) and an earnings multiple of 15, Boot Barn’s fair value would come in at $88.50. While this translates to a 42% upside from current levels, I prefer a minimum 35% discount to fair value to justify buying small-cap names. After applying this discount, this would translate to a low-risk buy zone from a valuation standpoint of $57.50 or lower. So, while Boot Barn is getting close to being a low-risk buy from a valuation standpoint, some further downside would be ideal for offering a more significant margin of safety. Let’s take a look at the technical picture:
Technical Picture
As shown in the below chart, Boot Barn is in a clear intermediate-term downtrend, trading below a declining 150-day moving average and making successively higher lows and lower highs. The advice not to catch a falling knife makes complete sense when it comes to small caps, given that they are much more volatile and sometimes lack meaningful institutional support. However, the real danger to catching a falling knife is doing so in no man’s land where there is no clear support zone for the stock. In Boot Barn’s case, it is finally approaching an area where we’ve seen strong buying pressure in the past.
BOOT Daily Chart (TC2000.com)
This area is the $54.00 level, where we saw buyers step in immediately in January and March of last year. In fact, the week of January 29th, 2021, saw the highest weekly volume for the whole year, with the stock closing well off its lows. Based on this history, I would not be surprised to see buyers come in at these levels, even if the momentum is to the downside. There’s no guarantee that this support level holds, so position sizing is crucial, and I would err on the conservative side when buying in downtrends. Still, with no strong resistance until $100.50, the reward/risk would be quite attractive on any dips to this prior support zone ($45.00 in potential upside to resistance, $6.00 in potential downside even if BOOT fills its gap from January 8th, 2021).
Summary
Boot Barn has collapsed from its highs, which isn’t surprising given that the stock was priced for perfection, heading into a violent cyclical bear market in the major market averages. However, with the stock down more than 55% from its highs and going from extreme overbought to medium-term oversold, I believe it is time to be cautiously optimistic. This is especially true given that the stock is now the most attractively valued since March 2020. That said, we’re still 13% above support, so I remain on the sidelines for now. But, if the stock were to pull back below $54.50, I would view this as a buying opportunity.
Be the first to comment