

grandriver/iStock via Getty Images
Starts: Single-family houses: -18.8% year-over-year; larger multifamily buildings: +15.9%. Here are the long-term trends.
What became clear (again) in the Census Bureau’s data on August 16 on housing starts was the divergence of the multi-year boom in the construction of apartment and condo buildings with five or more housing units and the current slump in the construction of single-family houses. Builders of single-family houses are now confronting a host of issues that have tangled up their businesses, including dropping traffic and spiking cancellations, to which they respond with price reductions, as sales decline amid surging inventories.
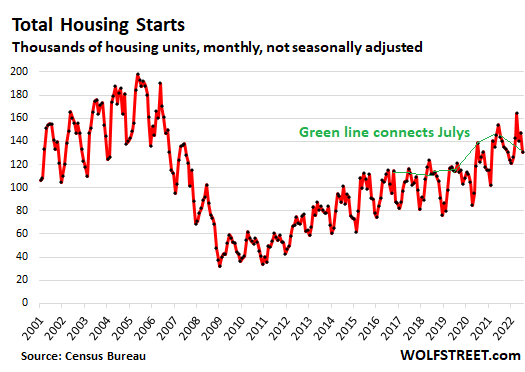
So “Housing Starts” – the number of housing units on which construction started – in July dropped by 9.6% from June and by 8.1% year-over-year to a “seasonally adjusted annual rate” of 1.446 million housing units.
Not seasonally adjusted, and not annual rate, total housing units that were started in July fell by 9.2% year-over-year to 130,600 housing units. But this was composed of a plunge in starts of single-family houses (-18.8% year-over-year) and a surge in starts of units in buildings with 5+ units (+15.9% year-over-year). The green line connects the Julys of the past few years in total housing starts:
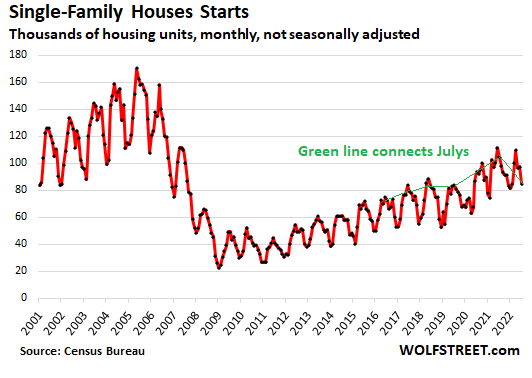
Starts of single-family houses drop to winter level.
The number of single-family houses where construction started in July plunged by 18.8% from July 2021 to 84,900 houses.
This was the second month in a row of declines during the summer, and the lowest since the winter months when construction starts slow for seasonal reasons.
Note that starts of single-family houses include both – those built for homeowners and those built specifically for rentals.
July starts are usually near the top of the range, and the low points during the year occur in the winter. So the drop in July to the level of last February was quite something. And it shows how homebuilders are reacting to demand that has suddenly fizzled amid 5%+ mortgage rates.
Note also the long-term trends: The peak in 2005, the plunge afterwards during the housing bust, and the gradual recovery that remains far below the peak:
Starts of units in buildings with 5+ units.
In July, the number of units started in buildings with 5+ units jumped by 15.9% year-over-year, to 44,400 units.
In April, starts of buildings with 5+ units had hit 53,500, the highest since 1986. The plunge in starts during the Housing Bust was brutal but relatively short. By 2013, the number of starts was back at pre-Housing-Bust levels and continued to rise to set multi-decade records by 2015, before slowing. But then they took off again in 2019 to hit that new multi-decade record in April.
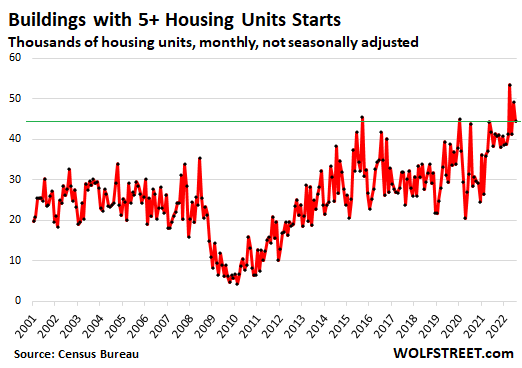
The category of buildings with 2-4 units that fits between single-family houses and buildings with 5+ units has fallen out of favor, with only about 1,000 starts each month.
Single-family v. multi-family starts: it comes in waves.
Starts during the 12-month period through July:
- Single-family houses: 1.113 million, -2% year-over-year.
- Units in buildings with 5+ units: 509,100, +27% year-over-year.
Over the decades…
Multifamily peaked in the early 1970s in a huge boom when between 75,000 and 85,000 units were started per month. After this boom came the sudden bust, and by 1974, starts bottomed out at 14,000 units for a few months. By 1983, there was another boom, but with lower highs, that maxed out with just over 60,000 starts a month. Which then fizzled for decades, and bottomed out during the Financial Crisis in the 6,000 range. Then it recovered and returned to the highs of the early 1980s but not the peak of the 1970s.
Single-family housing had a good run in the late 1970s, exceeding 150,000 starts for a few months, then peaked in 2005, maxing out with 170,000 starts in May that year, and then collapsed and never got back to those old highs.
The share of single-family starts of total starts and the share of multi-family starts come in big waves – as a function of the boom-and-bust cycles that single-family and multi-family construction go through.
This chart shows the 12-month moving average of the share of starts of single-family houses as a percent of total starts (red line) and the share of starts of units in buildings with 5+ units as a percent of total starts (green line).
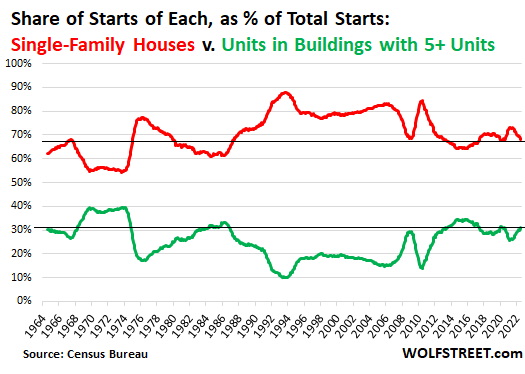
As the chart shows, since the Housing Bust, the share of multifamily starts has been relatively high, while the share of single-family starts has been low.
In some high-density cities, such as San Francisco, and in parts of New York City, such as Manhattan, practically no single-family housing has been built over the past decade. It has nearly all been multifamily, often large towers. The same has occurred in many city centers, where residential towers have sprouted like mushrooms. Many of these new buildings are relatively higher-end condos and rental apartments, in response to demand from people for whom this is a lifestyle choice.
Editor’s Note: The summary bullets for this article were chosen by Seeking Alpha editors.
Be the first to comment