

koyu/iStock via Getty Images
Bottom fishers are always looking for phoenix-like stocks, rising from the ashes, and Boeing is finally giving them some buy signals. It just had a 7% pop after reporting earnings.
It has a bottoming pattern on the chart. Insiders are buying. Portfolio managers are net buyers. They have to buy early before the whole world knows that Boeing is finally on its way back to success.
Our SID computer system has spotted all these Buy Signals. Our overall signal has improved from a Sell Signal to a 68 out of 100 Hold Signal, where 80 is a Buy Signal. Naturally, bottom fishers want to buy before our system flashes its most important buy signal at 80. They want to buy at the bottom. It looks like the bottom is $120 and they will start buying every time it comes back to that price. Boeing is already appearing on our “Bargain Hunt” list that we publish every day for subscribers.
Analysts will give their prized, first calls to their clients that are paying top research dollars to get the first call. I am sure none of our readers are on the “first call” list, that is why they need to use charts to spot the buying of those receiving that first call to bottom-fish. The pros don’t need charts, but they are a must for the small investor.
The fundamentals are beginning to improve. Analysts have earnings going from a loss of ~$8 to a gain of ~$6 a share. Analysts are upgrading the stock and raising targets. This is unusual for a stock that has broken bottoms so many times in the past. It takes a long time to convince analysts to upgrade a stock that is on the bottom, especially in a bear market.
Let’s hit the Seeking Alpha “Valuation” tab to give us some more fundamental metrics. No surprise that it has a bad +D rating because we know BA is digging itself out of a big financial hole. What we have to keep in mind is the enormous over 4,000 backlog of orders it has to provide the profits and cash flow during the coming years. Analysts are modeling exactly how quickly BA can rise from the ashes because of that order backlog. Rising earnings are the first signal. The small investor will probably wait until it happens, while the pros are busy buying the bottom for the big improvement over the next 3-5 years for “buy and hold.”
Some of the valuation numbers look good. Forward Price/Sales at 1.17 is better than the Sector Median. We know from the backlog that sales is not the problem. The cost of the crashes is the hole in the financial ground. Are they fully absorbed and will improving earnings finally lift price off the classic double bottom that is in place? What is the risk of another plane crash? It looks as if earnings could double or triple over the next 5 years. Analysts are not afraid to recommend it at these prices. Are the pros the only ones listening?
The forward PE is ~25 and attractive when compared to the long term growth rate of ~20%. BA has ~$20/share in cash for an acceptable P/C rating of ~7. However, long term debt increased from ~$18 billion before the plane crashes, to about ~$54 billion currently. That is a big liability to work off in the coming years. Free cash flow is still running negative at ~$6/share. Of course, the market is looking to the future, projected positive earnings to produce positive cash flow. It now sees that transition taking place.
Here is what our daily chart is showing:
Bottom Fishing Buy Signals (StockCharts.com)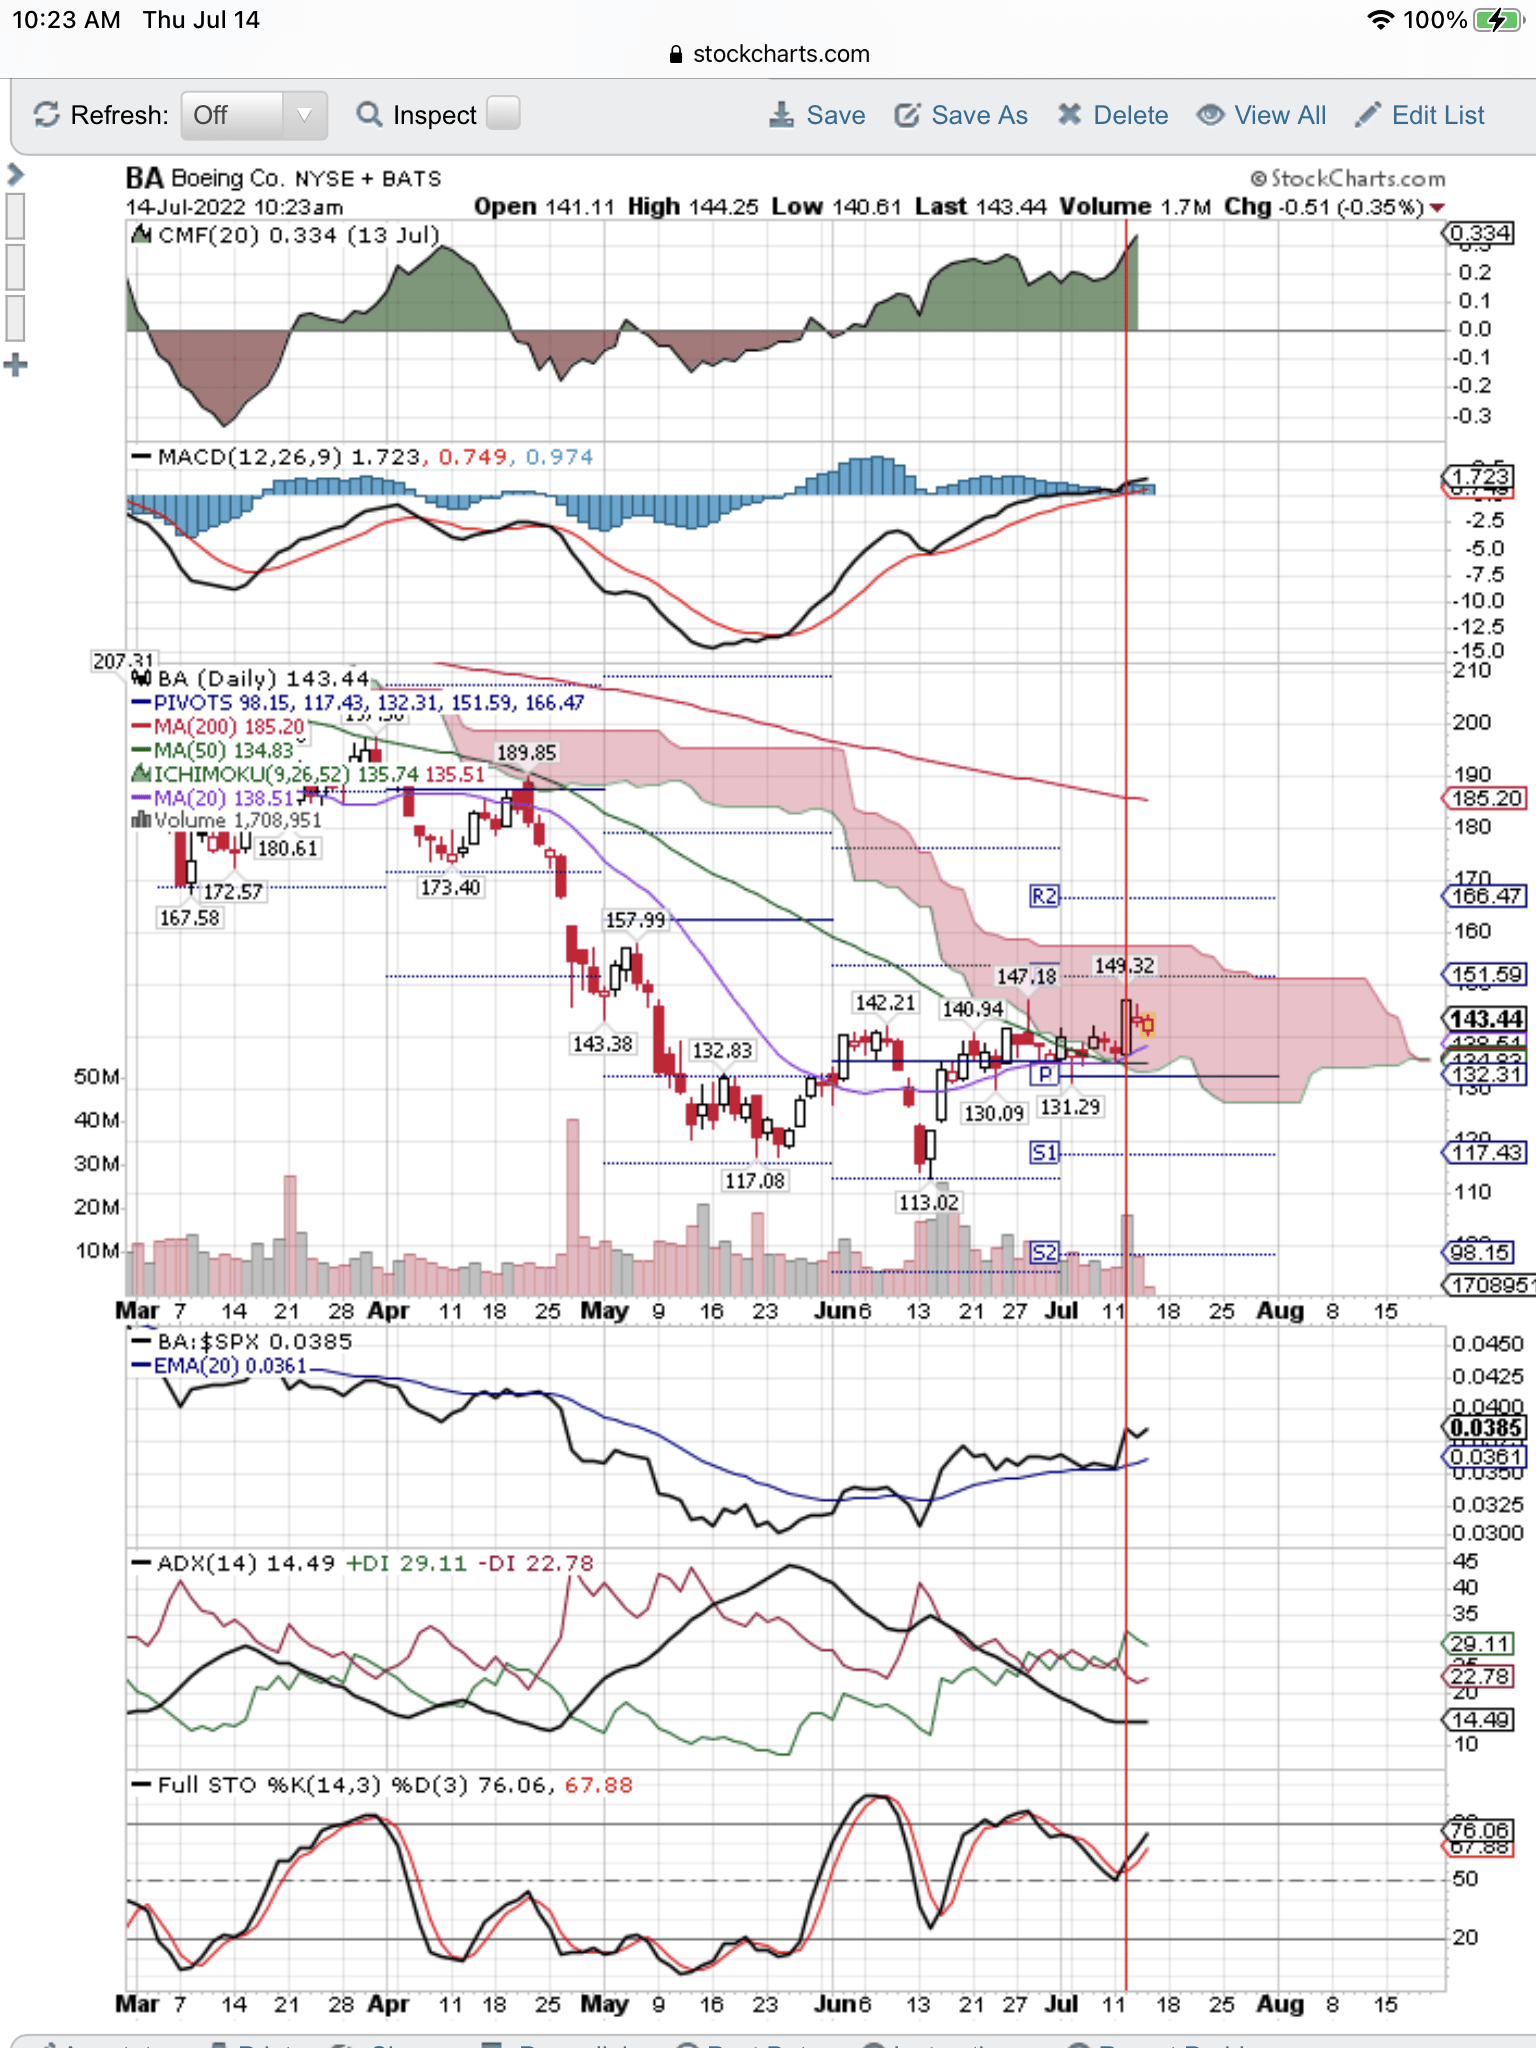
At the top of the chart is Chaikin Money Flow, and you can see money flowing into BA and taking price higher.
The next signal is the MACD buy signal. This was just confirmed by a good earnings report.
On the price chart, you can see the 20-day moving average has turned up and bullishly broken above the 50-day downtrend. This is a leading indicator to the 50-day turning up, and that indicates increased buying by bottom fishers.
Notice the price breakout above the bottoming trading range of $113-$142.
Below price is the most important signal for portfolio managers. It is a comparison of BA’s price with the price of the SPX. When this trend is moving up, it is outperforming the Index. Portfolio managers want to be in stocks that are outperforming the Index for the long term. This is the decision the bottom fishers are now making for BA. They are early. Most portfolio managers will jump in late.
The bottom two indicators show Supply switching to Demand and taking price higher. The bottom fishers will stop buying as price moves higher and will come back to buy when price drops back to test the bottom.
Conclusion
The bottom fishers are the most respected investors on Wall St. Everyone watches them and will join them in droves when they think price is really coming off the bottom. Our SID Buy Signal will tell us when that happens. Stay tuned.
Be the first to comment