

Torsten Asmus
The United States Brent Oil Fund, LP (NYSEARCA:NYSEARCA:BNO) (“the Fund”) is an exchange-traded fund (“ETF”) organized as a limited partnership. BNO’s investment objective is to track a benchmark of the short-term Brent crude oil futures contract, as described below.
USCF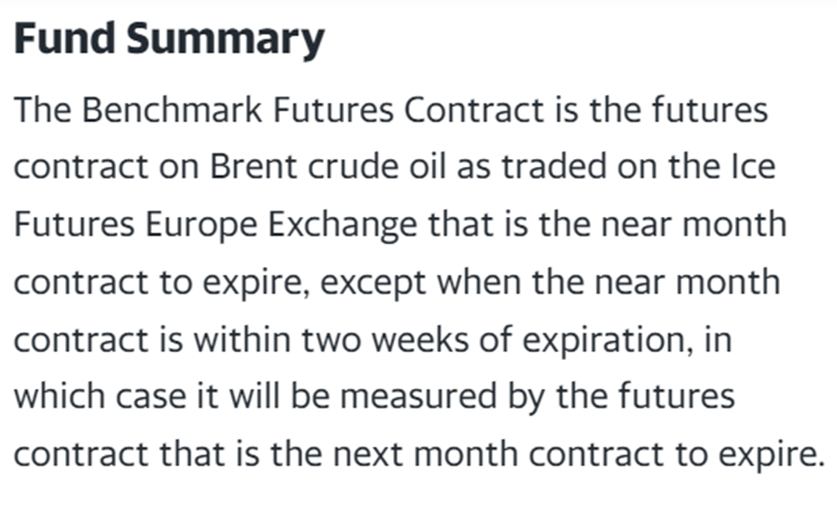
The top holdings are listed below.
USCF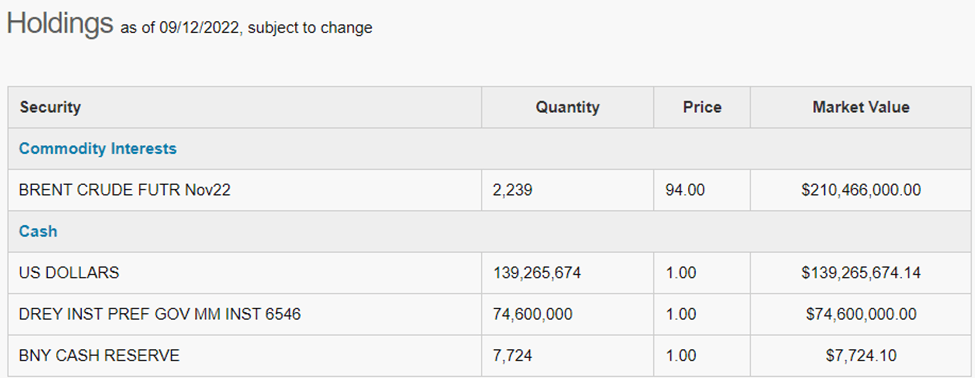
United States Commodity Funds, LLC (“USCF”) lists three benefits of the ETF:
USCF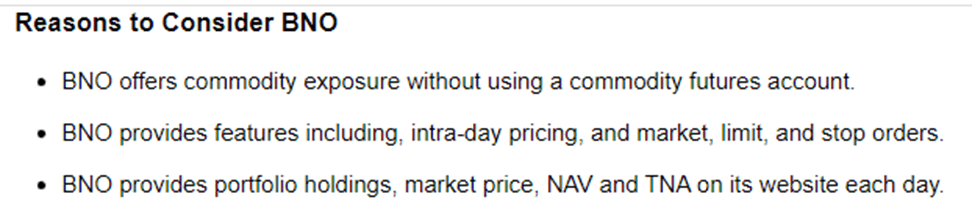
A commodity futures account requires daily margin management. For many individual investors, it may be burdensome. BNO charges total expenses of 1.09% to manage that for you.
USCF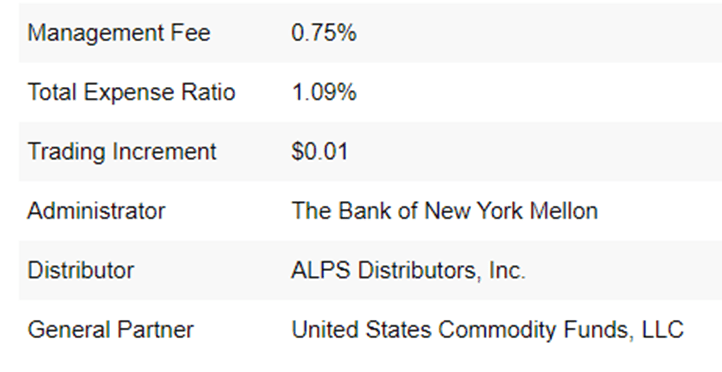
Seeking Alpha gives that Expense Ratio an “F.”
Seeking Alpha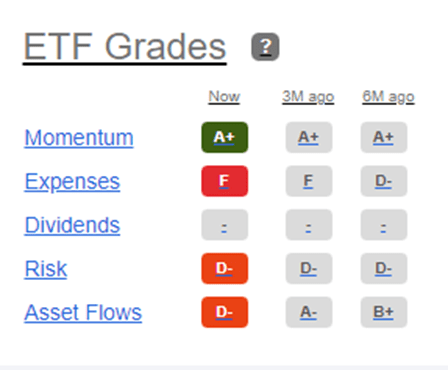
Risks
USCF
USCF provides a litany of risks about investing in BNO in its Prospectus. Potential investors should take the time to understand them before making an investment.
Brent Crude Oil
Brent is produced in the North Sea area of the Atlantic Ocean and is pipelined to the Sullom Voe terminal in the Shetland Islands of Scotland. It is a “waterborne crude oil” on which ICE’s Brent benchmark is based because it has access to global shipping, port and storage capacity. This gives it an advantage over other crudes, which are landlocked and regional.
Refiners around the world process it. And it is a benchmark used to price over three-quarters of the world’s traded oil, as one of the most “liquid” crude grades. As such, it reflects global supply and demand factors, as well as expectations and risk premia.
The graph below depicts the daily prices of Brent spot prices, which are highly correlated to Brent futures prices.
EIA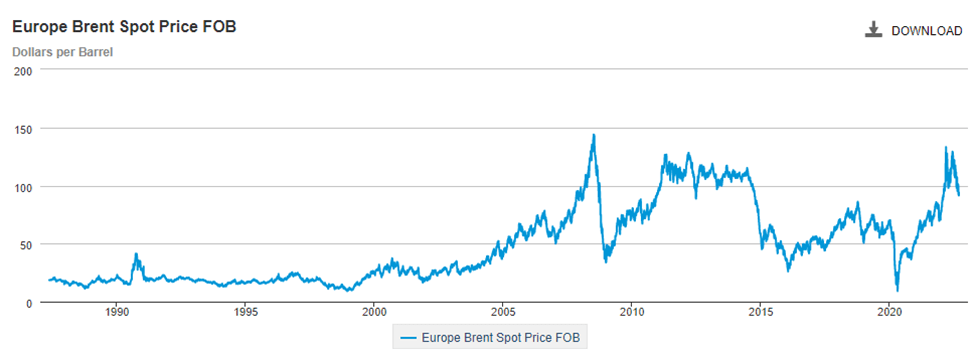
West Texas Intermediate (“WTI”) is another major “benchmark” crude oil. With a landlocked, Cushing, Oklahoma, delivery location. The crude must be pipelined to the Gulf Coast for export and use in refineries there.
The price spread between Brent and WTI has recently surged due to the sanctions imposed on Russia due to their invasion of Ukraine. By year-end, Russian crude and product exports to Europe will drop to a low level.
EIA Data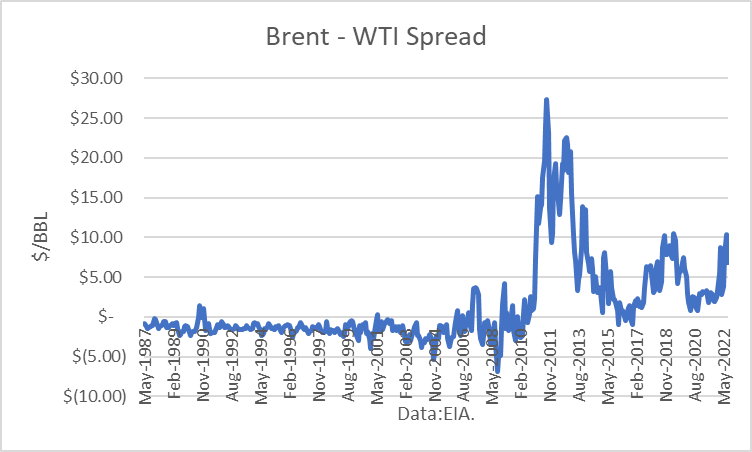
Meanwhile, U.S. crude oil exports have surged to new heights. European refiners are substituting U.S. crude, and Russia is diverting more exports to China and India, which are not banning Russian imports.
EIA data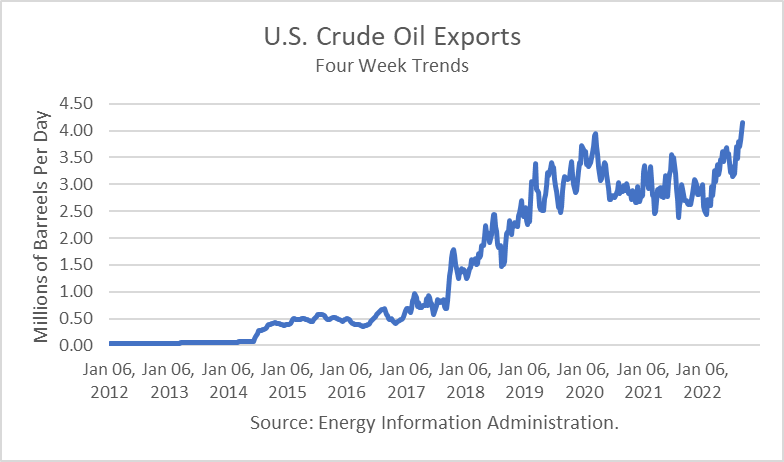
The net result is that production in the Former Soviet Union (“FSU”) countries, mainly Russia, has remained relatively steady. However, the EIA projects a drop in 2023.
EIA Data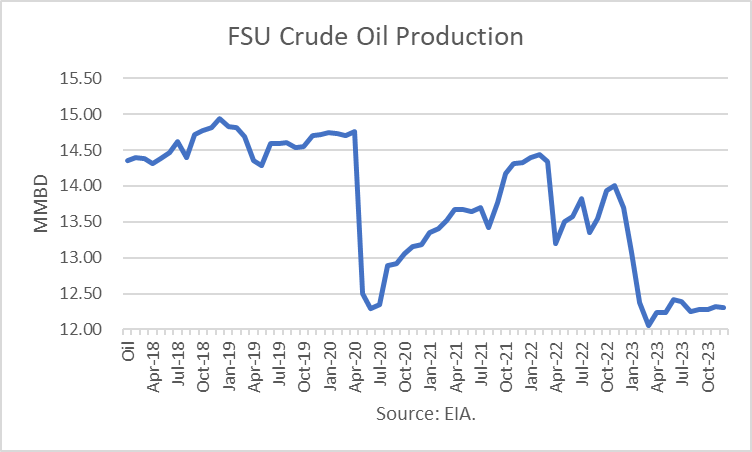
Even with that projected drop, commercial inventories outside of the U.S. in OECD countries, mainly Europe, are nevertheless projected to rise.
EIA Data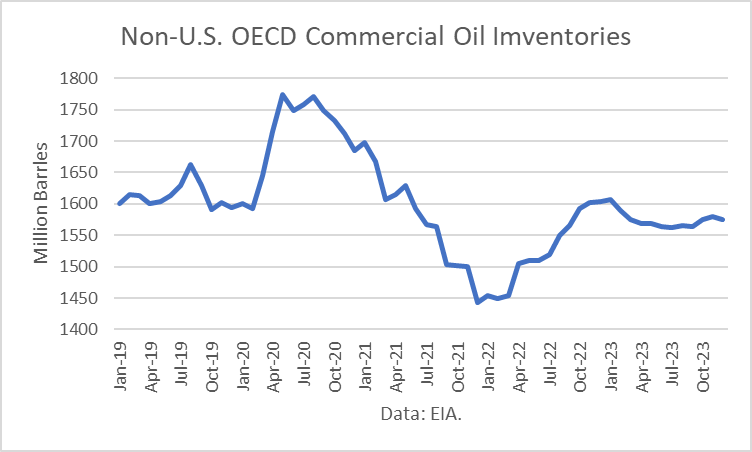
Note:
|
OECD = Organization for Economic Cooperation and Development: Australia, Austria, Belgium, Canada, Chile, the Czech Republic, Denmark, Estonia, Finland, |
|
France, Germany, Greece, Hungary, Iceland, Ireland, Israel, Italy, Japan, Latvia, Lithuania, Luxembourg, Mexico, the Netherlands, New Zealand, Norway, |
|
Poland, Portugal, Slovakia, Slovenia, South Korea, Spain, Sweden, Switzerland, Turkey, the United Kingdom, the United States. |
Total U.S. commercial oil stocks are now six million barrels higher than a year ago.
EIA data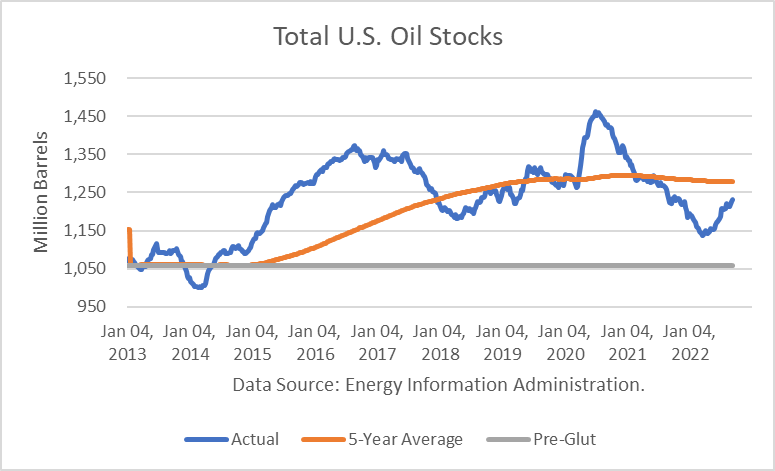
Performance
Since inception, June 2010, BNO has returned just 15.3%.
Seeking Alpha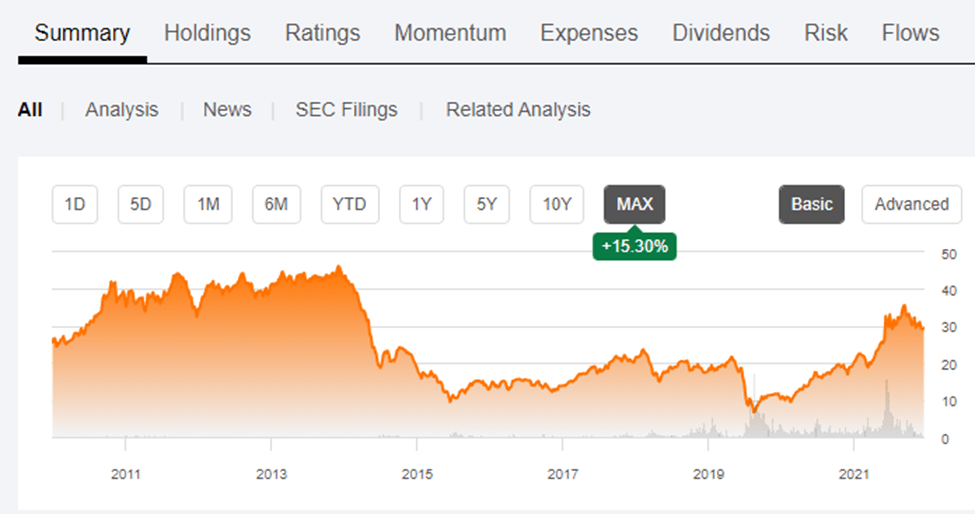
Over the past 10 years, BNO lost 30.17 %. By contrast, the S&P 500 (SP500TR) returned 225.96 %.
Seeking Alpha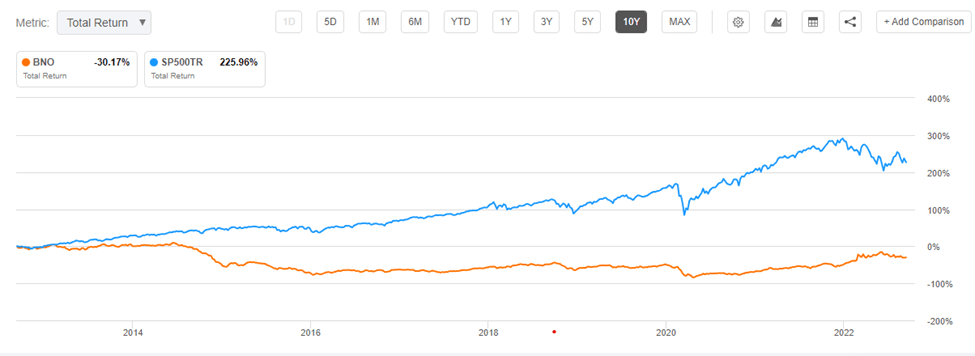
But over the past year, BNO returned 53.1% and SP500TR lost 10.16%.
Seeking Alpha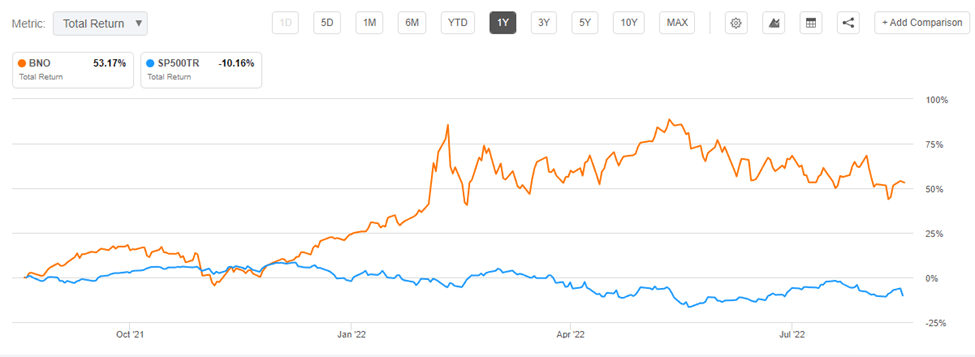
Comparison to BRS Crude Oil Trading Results
I commenced trading an energy futures portfolio as of June 23, 2022, consisting of NYMEX WTI crude, RBOB Gasoline, Heating Oil and Natural Gas. I post the daily positions and track record on my Seeking Alpha Marketplace service, Boslego Risk Services (“BRS”).
My algorithmic trading (AT) strategy is based on behavioral finance theory and, more specifically, an article written by Nobel economics laureate (2013) Robert J. Shiller. In his paper, “From Efficient Markets Theory to Behavioral Finance,” Shiller discusses the failure of the efficient markets’ theory to explain stock market prices and the “blooming of behavioral finance.” He proved that stock market prices exhibited “excessive volatility” from what would be expected, if market prices behaved according to the efficient markets theory.
For a more in-depth discussion, please see my article, “DBO: An ETF For Oil Trading.” My real-time results through September 12, 2022, for crude oil trading only, were up 16.5%, whereas BNO lost 8.1% over the same period.
Yahoo Finance, BRS data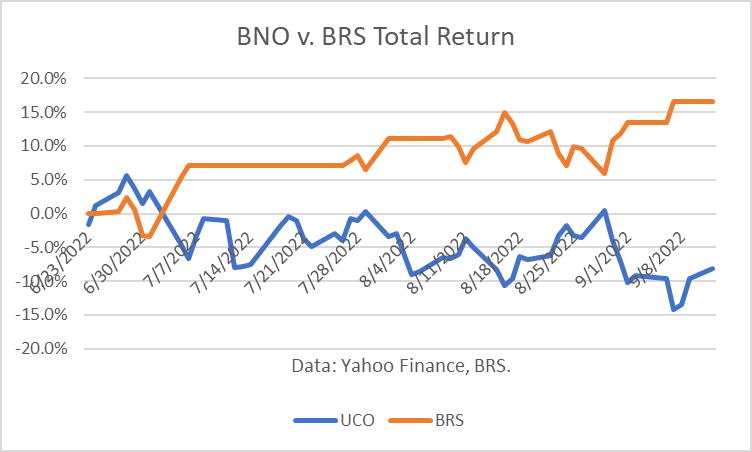
The Maximum Drawdown (“MD”) for the BRS crude strategy was 8%. The MD for UCO over those same days was 19%.
Yahoo Finance, BRS data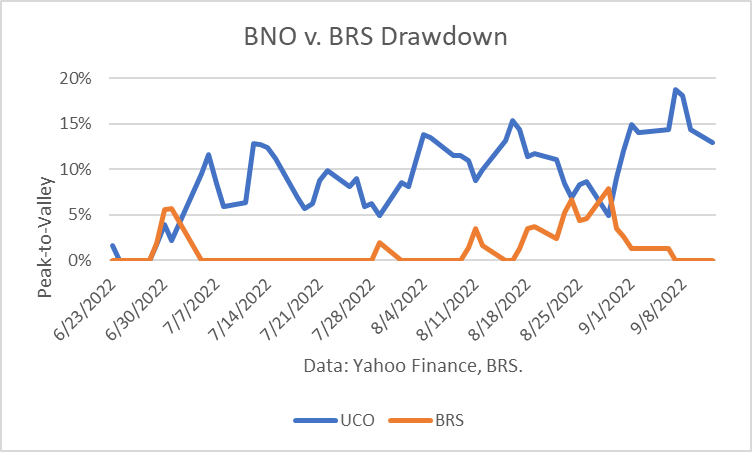
Outlook
I recently explained my world oil supply and price outlook in an article, UCO: A Double-Barreled Oil Price Exposure. The projections show OECD inventories building 167 million barrels in 2022, enough to pressure oil prices lower.
There is also a significant risk that Europe already is or will be in recession this winter, as a natural gas price surge and potential rationing take place. The economic outlook for the U.S. is also troublesome.
Conclusions
In my article dated May 25, 2022, BNO: A Long Position In Brent Crude, I concluded, “My algorithmic trading strategy is based on such an approach and currently provides a ‘Long’ signal.” BNO peaked on June 9th.
Seeking Alpha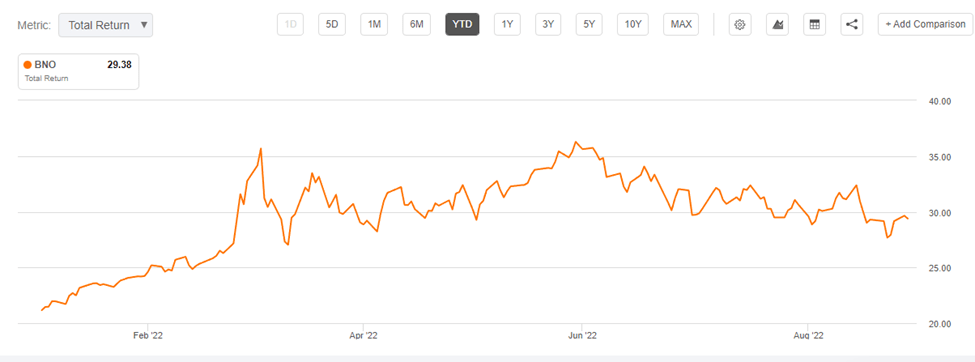
Now, my conclusion is the opposite. I expect BNO to drop over the coming months. However, the price path will almost certainly be bumpy, as uncertainty creates high volatility.
Be the first to comment