

ipopba
Written by Nick Ackerman, co-produced by Stanford Chemist. This article was originally published to members of the CEF/ETF Income Laboratory on July 19th, 2022.
BlackRock Health Sciences Trust (NYSE:BME) and BlackRock Health Sciences Trust II (NYSE:BMEZ) are both related to healthcare with identical names. However, under the surface, these funds are quite different, with minimal overlap. I think that becomes quite evident when looking at these funds closer. Both of these funds are worth considering, depending on what type of investor you are.
A Look At Both The Funds
We’ll see that the investment objectives are the exact same. Even the investment approach is worded identically for each fund on each respective website. Once you go into the more detailed prospectus, the investment policies have differences.
The Basics Of BME
- 1-Year Z-score: -0.81
- Discount: 0.05%
- Distribution Yield: 6.11%
- Expense Ratio: 1.08%
- Leverage: N/A
- Managed Assets: $546 million
- Structure: Perpetual
BME’s investment objective is “total return through a combination of income, current gains, and long-term capital appreciation.” They will attempt to achieve this by a pretty simple investment policy – “under normal market conditions, at least 80% of its assets in equity securities of companies engaged in the health sciences and related industries and equity derivatives with exposure to the health sciences industry.” They will then implement a covered call writing strategy against positions in their portfolio.
The Basics Of BMEZ
- 1-Year Z-score: -1.17
- Discount: 13.76%
- Distribution Yield: 10.60%
- Expense Ratio: 1.3%
- Leverage: N/A
- Managed Assets: $2.151 billion
- Structure: Term (anticipated liquidation January 29th, 2032)
BMEZ has an investment objective to “provide total return and income through a combination of current income, current gains, and long-term capital appreciation. It intends to do this through “at least 80% of its total assets in equity securities of companies principally engaged in the health sciences group of industries and equity derivatives with exposure to the health sciences group of industries.” With this, it also utilizes an options strategy.
Going into the more detailed investment approach included in the prospectus, we can see this included:
Equity securities in which the Trust anticipates investing include common stocks, preferred stocks, convertible securities, warrants, depositary receipts and limited partnership interests in real estate investment trusts that own hospitals. The Trust may invest in shares of companies through initial public offerings (“IPOs”). The Trust may also invest, without limit, in privately placed or restricted securities (including in Rule 144A securities, which are privately placed securities purchased by qualified institutional buyers), illiquid securities and securities in which no secondary market is readily available, including those of private companies. Issuers of these securities may not have a class of securities registered, and may not be subject to periodic reporting, pursuant to the Securities Exchange Act of 1934, as amended. Under normal market conditions, the Trust currently intends to invest up to 25% of its total assets, measured at the time of investment, in such securities.
Key Differences In Portfolio
Both funds are fairly large for closed-end funds, a fairly common characteristic of BlackRock (BLK) funds. When you’re the largest asset manager in the world, it is just kind of natural. That being said, BMEZ is significantly larger in terms of AUM relative to BME.
Neither fund utilizes any leverage, instead employing an options writing strategy on individual positions in the portfolio. BME is a perpetual fund, and BMEZ is a term structure fund. That means they plan to liquidate in the future and return the capital back to shareholders. That stops the fund from trading at a perpetual discount. Of course, as we’ve previously detailed, there are extensions and a way for the fund to switch to perceptual.
Both funds have similar wording, with BMEZ’s key difference being up to 25% in private companies. As of their latest quarterly commentary, only around 8.2% of the total assets were in private investments. Despite this, the performance of the fund has been much more volatile.
One of the results of this is due to the significant exposure to small and mid-cap companies relative to BME. Here’s a look at the weightings for BMEZ.
BMEZ Market-Cap Weighting (BlackRock)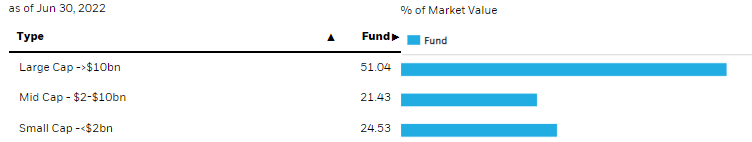
Here’s a look at the weightings for BME.
BME Market-Cap Weighting (BlackRock)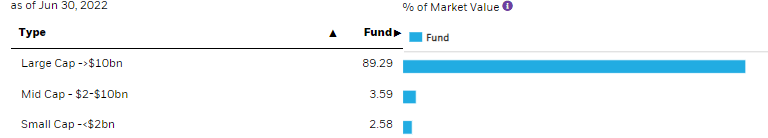
During times of uncertainty, larger-cap, more well-established names will be the go-to. However, it is worth noting that BMEZ still tilts to a higher allocation of large-cap names. They are more volatile anyway due to being more geared towards biotech.
When looking at the top ten positions of each fund, we can see that not a single one has overlapped.
Top Ten (BlackRock)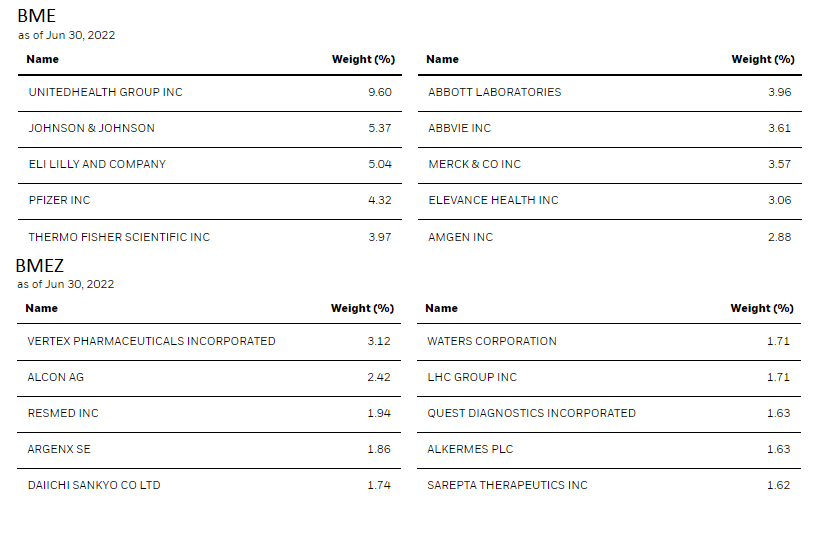
That isn’t to say that underneath the surface, there isn’t any overlap. However, there simply isn’t for the positions that make up the most meaningful allocations of these funds.
For the top ten, BME’s weighting makes up 45.38% of the portfolio. BMEZ’s top ten only account for around 19.38%. That’s a meaningful difference. I believe that BME can make more concentrated bets with their more “sure-fire” portfolio. Biotech tends to be more uncertain because they are at the mercy of whether a drug is approved or not and whether a trial is successful.
Lack Of Performance Correlation
(Prepare for an onslaught of charts through the next sections!)
Correlation on a total NAV return basis over the last year has been closer – there are periods when they are very far apart. We can also see the massive difference in share price returns over the previous year.
Ycharts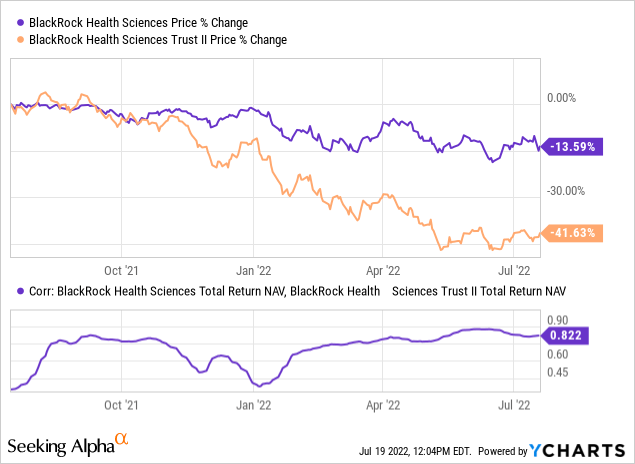
That reflects a period when growth and private investments are very much out of favor. With the Fed raising rates, this puts pressure on growth investments. For healthcare, that often means biotech investments. That’s precisely where BMEZ is more heavily invested.
To see this playing out, we can compare SPDR Biotech (XBI) and SPDR Health Care (XLV).
Ycharts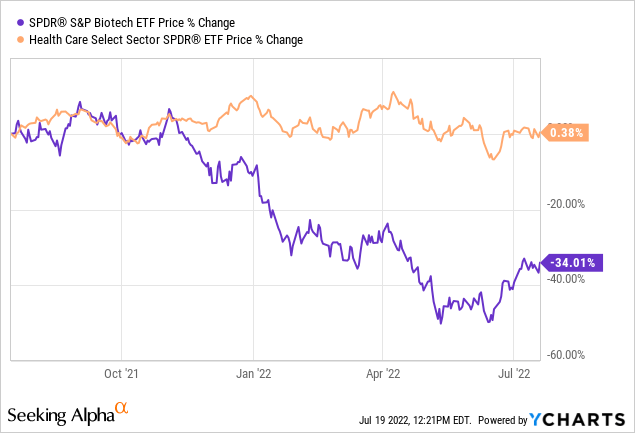
Over the last year, it hasn’t even been close. That’s why we see BMEZ perform significantly worse than BME. BMEZ’s NAV has now even sunk below its inception NAV. Due to the distributions the fund has paid, they are still clinging to some total NAV return gains. It’s also shown a similar performance in this period, but they took a wildly different path to get to this point.
The share price has sunk further for BMEZ, which has put an investor in negative territory.
Ycharts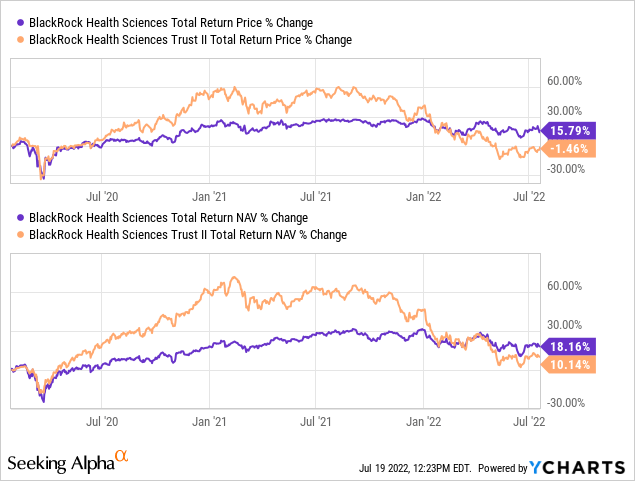
When considering which healthcare fund to invest in for defensive purposes, it becomes clear that BME is the clear winner. I believe that’s reflected in the fund’s almost non-existent discount. This has been a long-term occurrence at this point. The fund began flirting with a premium going back to around 2012. It has stayed that way since.
BMEZ Premium/Discount History (CEFConnect)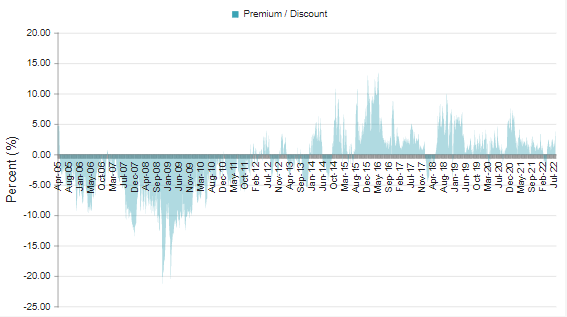
Better Swap Candidate Alternatives
When implementing a swap strategy between funds to gain “free shares” (as we frequently do at the Income Lab), other funds are available.
BME Swap Partner
For BME, we have the Tekla Healthcare Opportunities Fund (THQ).
Despite THQ’s leverage, the correlation is quite close here over the last year. Even during the late Q4 2021 correlation divergence, the divergence wasn’t for too long. This is also reflected in the share price performance over the last year too.
Ycharts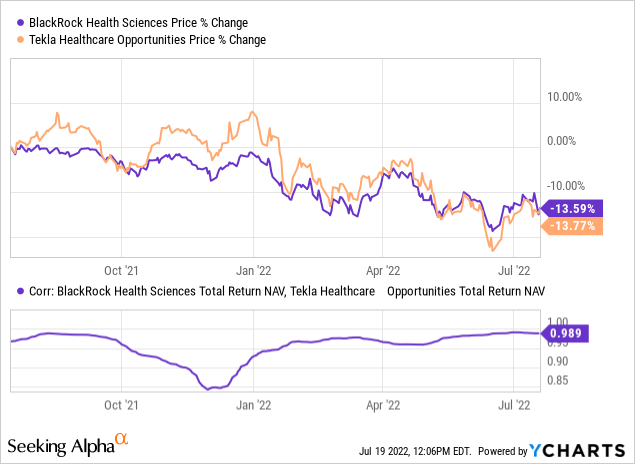
Since BME and THQ have a longer history, we can see a comparison much further than just the last year. Here’s a look at the history since THQ’s inception in 2014.
Ycharts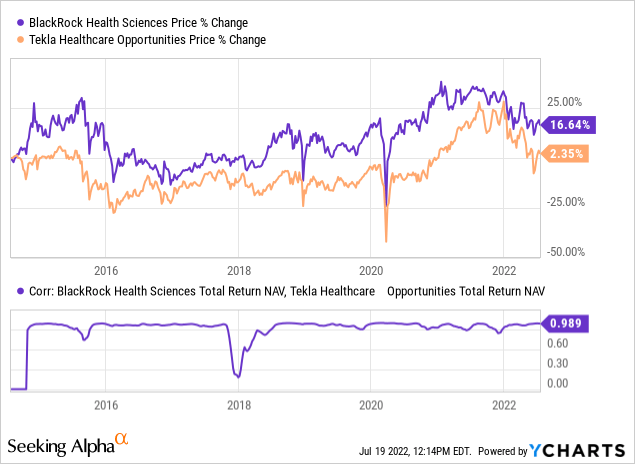
I concede it isn’t a clear choice when looking at which fund could make the most sense today. The funds have a significant correlation but are both trading above their historical average. This makes both funds appealing at this time.
Ycharts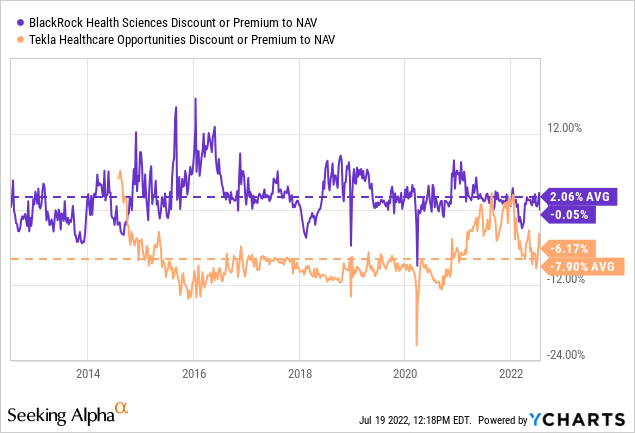
BMEZ Swap Partner
For BMEZ, we have a harder time finding an alternative. There is the Tekla Healthcare Investors (HQH). They are tilted towards biotech holdings and utilize options. However, the tilt towards larger-cap, more well-established names over private holdings appears to reflect below. The correlation here is close, but the Q4 2021 dip we witnessed in the other comparisons was more noteworthy here. The divergence also seems to have lasted longer.
The positive here is that the share price reflects a significant divergence. I’d say above and beyond.
Ycharts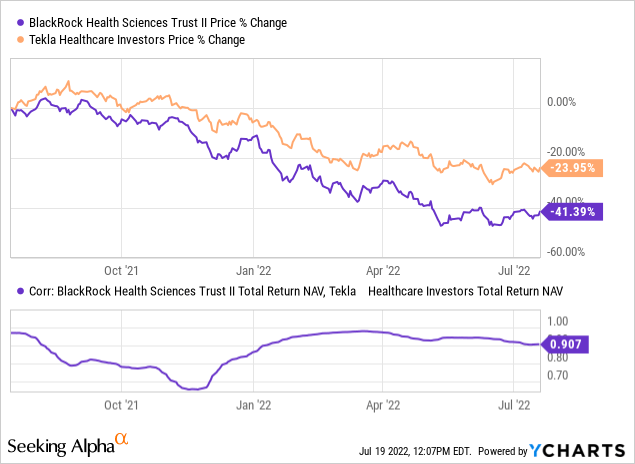
We also don’t have too long of history for BMEZ – though it’s getting longer every day!
This fund launched at the beginning of 2020 – an excellent time to catch the lows of COVID and ride the recovery significantly higher. Of course, we have now given up those gains and then some on a price basis, as we saw above. We are still sitting positive on a NAV basis, which is more of what they can control directly regarding how they invest. Growth just has been hit that hard.
When looking at the performance and correlation since BMEZ’s inception, we see that the correlation stays similar on a total NAV return basis. It is the price changes that were more extreme. For a swap strategy, that’s exactly what we want to see-those divergences in share price that we can exploit.
Ycharts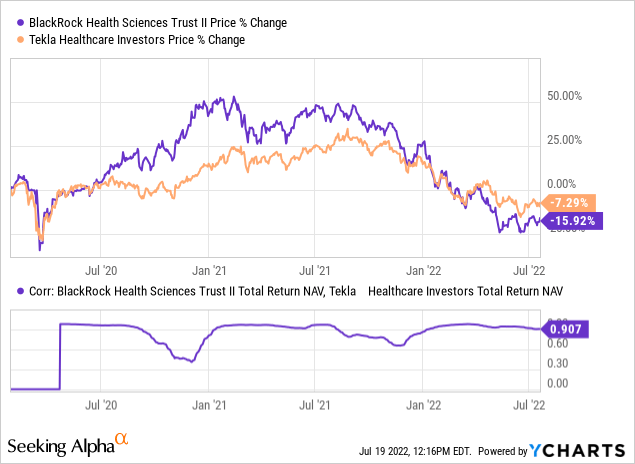
Today, BMEZ is a deeply discounted fund. HQH has given up some of its elevated levels but is still running closer to its historical average.
Ycharts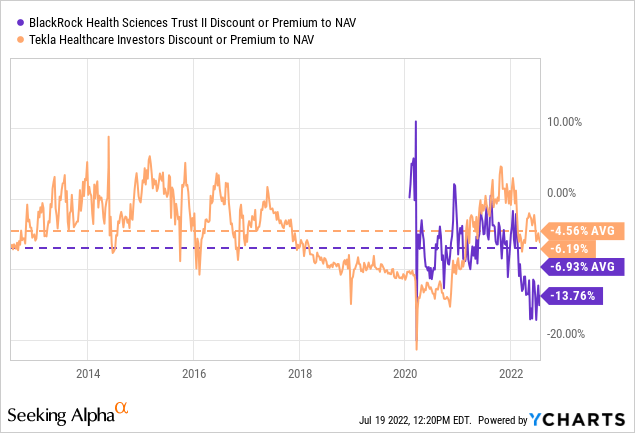
Conclusion
As we explored, BME and BMEZ are quite different when looking further than the fund names. That makes them less swap trade partners, but some alternatives exist. Where one can execute trading between the funds to gain “free shares.” This is based on swapping one fund for a similar fund that is trading at a cheaper valuation.
I also believe that both funds could be worth holding over the long-term anyway if you don’t want to trade them around. In fact, I actually have BME, BMEZ and THQ in my portfolio, all of which we discussed.
For BME and BMEZ, it just comes down to what type of investor you are. If you are a more conservative investor that wants more limited risk, BME is a strong candidate. For those that can handle a lot more risk with more speculative names, then BMEZ could make an excellent choice.
Be the first to comment