

bodnarchuk/iStock via Getty Images
For old-timers like myself, we can remember when general merchandise retailer K-Mart was a bigger player in the U.S. than Walmart (WMT) or Target (TGT). This now defunct goods seller used to have a blue light atop a metal post, carted around the store on wheels. Every hour or so, someone would get on the store’s intercom system and announce a specific item was on sale for the next few minutes, and the whole store would run over to see what was what.
Well, Wall Street occasionally runs a “bluelight special” on sectors in the stock market. Crude oil right after the pandemic shutdown was an example (or anything have to do with banking and real estate in early 2009). You could have purchased just about any blue-chip name in oil/gas during 2020 after March, and held into early 2022 for huge gains. Just like consumers shopping at K-Mart were offered cheap deals, I am now rating the whole precious metals space (gold/silver/platinum/palladium) in the investment world as something related to a discount bargain you don’t want to miss in early October. The lease rate structure to borrow physical, futures market posturing, and incredible analyst/investor pessimism about gold and silver’s immediate future smack of an important long-term bottom, when you review historical data. You can find more detailed analysis of bottoming logic in my precious metal articles posted during the summer.
I have authored a number of bullish precious metals articles since July, explaining now is the time to go head first into related asset ideas. Another pick out of the major gold mining concerns is Barrick Gold (NYSE:NYSE:GOLD). The knock on Barrick is it owns too many assets located in nations with less-stable political regimes, especially on the African continent, which is a risk for foreign mine owners. For this reason, I suggest readers also invest in Agnico Eagle (AEM) or Newmont (NEM) as companion plays.
The Business
This enterprise is part of what I affectionately call the “Golden Triangle” of major miners in the world. Basically, Barrick, Newmont and Agnico Eagle (with its merger with Kirkland this year) are far and away the biggest and most valuable gold miners in the world retail investors can hold in their portfolio. I mentioned Agnico Eagle last week here as the “premier” gold mining play for jurisdictional safety and organic growth reasons. Owning all three will give you intelligent and conservative diversification, alongside leverage to gold price gains moving into 2023.
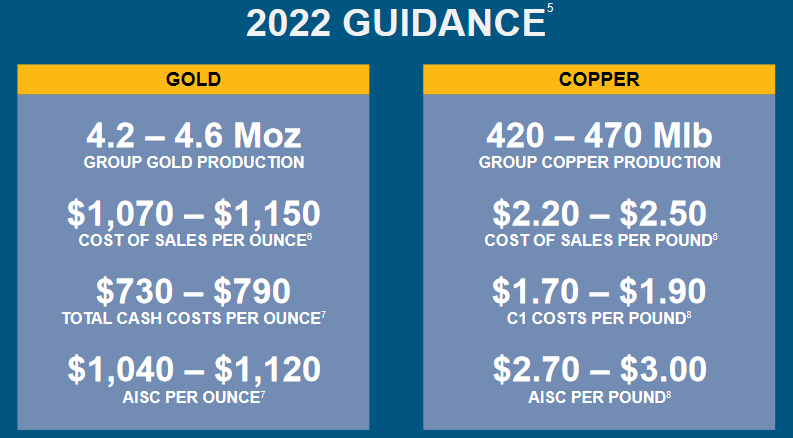
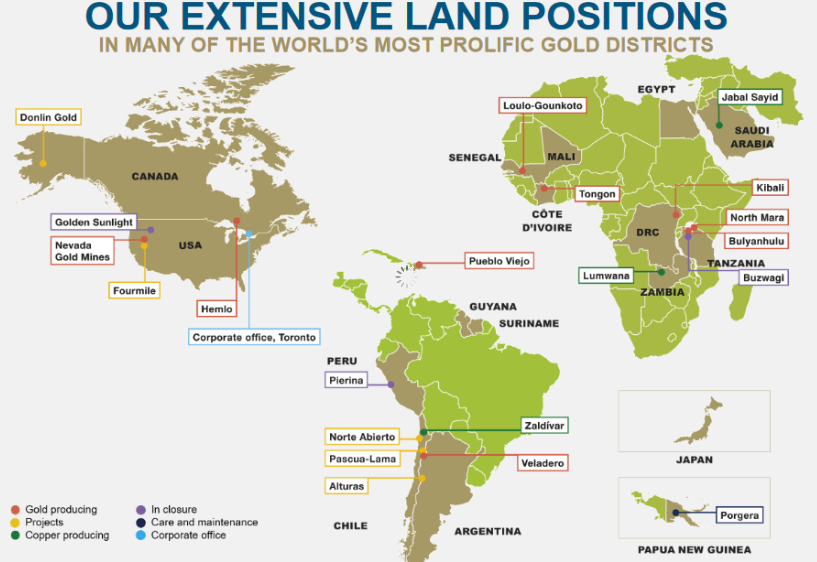
Below are some basic operating numbers and a map of Barrick’s mines/resources during 2021-22, taken for the company’s August Fact Sheet. This 15-page report is perhaps the best single source to acquaint yourself with its properties and operating future. The summary is 4.4 million ounces of gold will be mined in 2022 (estimated by management), with nearly $1000 an ounce in cash flow generated at $1750 metals pricing (average for the year), as cash costs hover around $750.
Barrick Gold – August Fact Sheet Barrick Gold – August Fact Sheet Barrick Gold – August Fact Sheet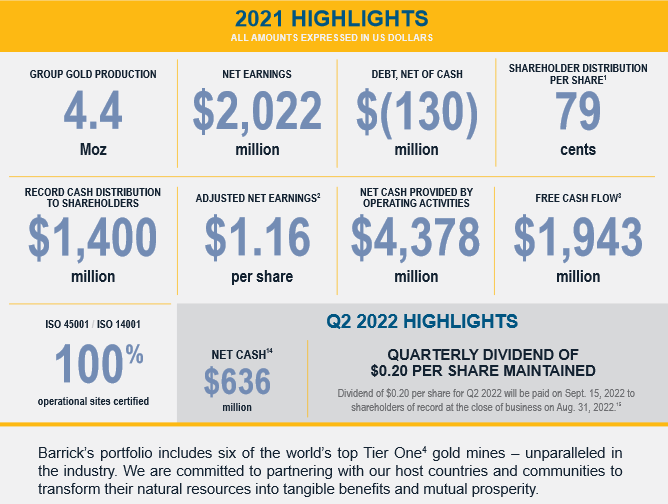
Valuation Story
Looking strictly at the numbers, Barrick is one of the cheapest large cap miners in the world. It has tremendous leverage now to gold prices, likely at a better than 2:1 ratio for possible percentage gains vs. the commodity pricing of gold, copper and silver – Barrick’s main mined metals.
Because of (1) price weakness in precious metals the last couple of years, (2) a decade of flat prices for Barrick Gold, and (3) a bearish U.S. equity market generally in 2022, shares can be scooped up near a company record-low valuation in early October.
Below is a graph since 1995 of some basic fundamental worth ratios on trailing 12-month results. Price to earnings, sales, cash flow, and book value are included. When you combine current readings in this group of valuation multiples, Barrick is sitting in the bottom 10% of previous setups vs. decades of history.
YCharts – Barrick Gold, Basic Fundamental Ratios, Since 1995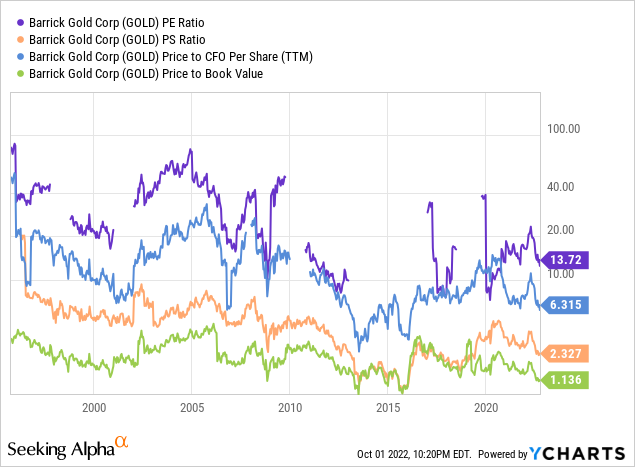
Better news for shareholders, when you include cash and debt holdings, enterprise value statistics are even cheaper! EV to trailing EBITDA (earnings before interest, taxes, depreciation and amortization) and Revenues are not far above the 2018 all-time low reading (in combination).
YCharts – Barrick Gold, EV to EBITDA and Revenues, Since 1995
In addition, gold miners have increasingly focused more on creating shareholder value including the return of capital, and less on costly expansion initiatives. Right now the whole gold sector is paying record cash dividend yields “relative” to what is found from regular U.S. stocks (represented by the S&P 500 index). The trailing 3.16% dividend payout on today’s $15 price is quite extraordinary. I can easily argue, Barrick, Newmont and Agnico Eagle should be a cornerstone of every “income” portfolio construction in late 2022.
YCharts – Barrick Gold Dividend Yield vs. S&P 500 ETF, Since 1995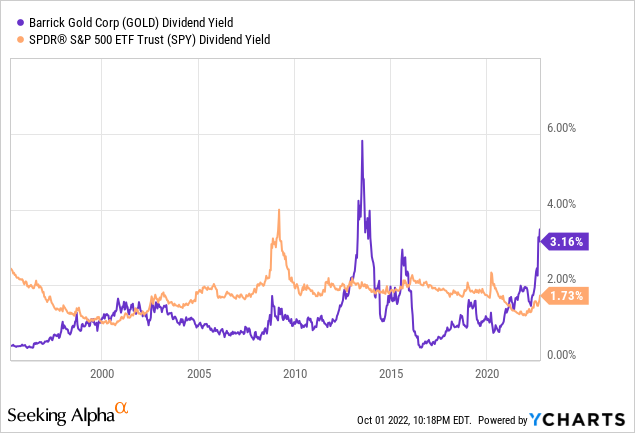
Using comparison analysis, the safest gold/silver mine owners in the U.S. and Canada are selling for a premium EV to EBITDA ratio to Barrick, and logically should. This list includes Newmont and Agnico, plus smaller miners like Hecla (HL), pictured below. For investors willing to take on a little extra risk, Barrick’s valuation is similar to smaller, weaker operating companies focused on Africa or riskier mining jurisdictions. This list includes AngloGold (AU), Gold Fields (GFI), B2Gold (BTG), and copper/gold producers like Freeport-McMoRan (FCX) and Southern Copper (SCCO). However, Barrick owns plenty of assets in safe jurisdictions like the U.S. The expanding disconnect for its valuation vs. large-cap peers in 2022 is one reason future upside could lead the sector in a gold/copper/silver upturn.
YCharts – Major Gold/Copper/Silver Miners, EV to EBITDA, 12 Months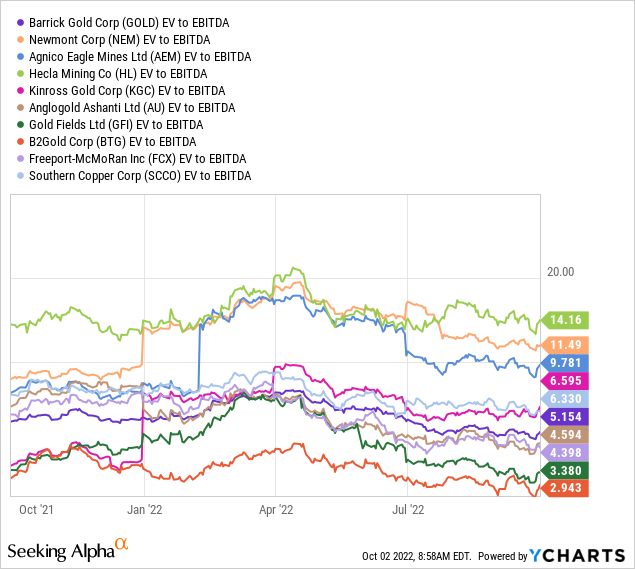
Technical Bottom Signs
Perhaps the strongest buy argument is taken from Barrick’s daily trading chart. In a nutshell, a bunch of positive divergences in momentum have showed up in August-September. Specifically, last week’s new price low was NOT confirmed by a slew of technical indicators. I have drawn an 18-month chart of daily trading activity below to highlight the bullish trends developing.
The Accumulation/Distribution Line bottomed all the way back in December (marked with a blue arrow). This indicator is signaling the intensity of buying during the first months of the Russian invasion of Ukraine was just as strong as the Fed tightening selloff in gold shares during the summer was weak.
More recently, my favorite Negative Volume Index of trading on slower news days has been rising since June (marked with the red arrow). This setup is telling us overhead supply is not as large as early summer, and buyers on weakness are appearing. Lastly, On Balance Volume bottomed in early September (marked with the green arrow). One OBV message is the overall level of selling was quite low in the middle of September, despite the emotional confidence dump in investor/trader sentiment surveys.
StockCharts.com – Barrick Gold with Author Reference Points, 18 Months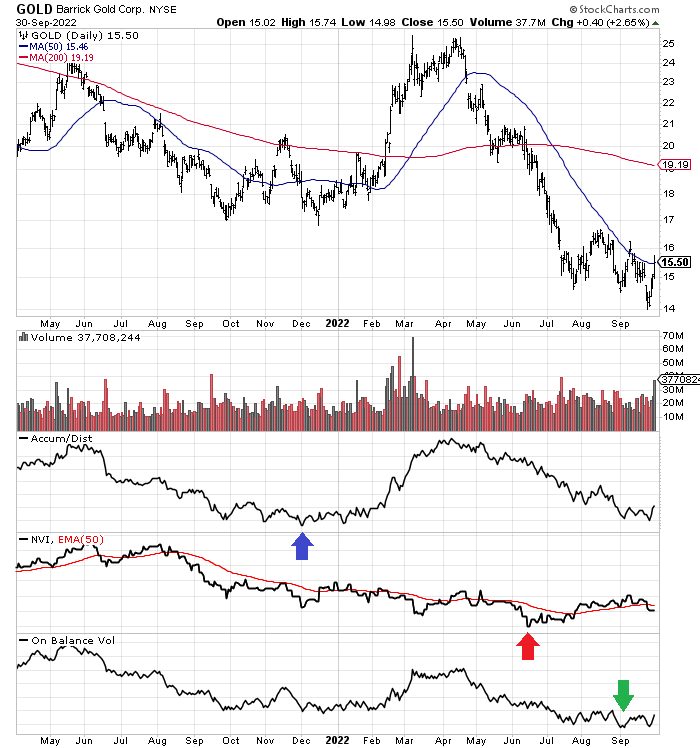
Final Thoughts
What are the risks to an investment in Barrick at $15? The primary risks are gold prices do not move much or decline next year, and/or the U.S. stock market crashes in October-November. The odds of either occurring are not zero, but we have already experienced wicked declines in precious metals and the equity market this year. More than likely, we are in the process of forming a bottom in both in coming weeks.
From my perspective trading markets for 36 years, further weakness in Barrick will only open an even stronger long-term buy opportunity. I have written several articles on my expectation gold will bottom before U.S. equities, similar to past liquidity crisis events. I explained during July here the high odds of expanding equity market drops into the fall, a function of sharp selloffs in banks and gold miners. I remain in the minority/contrarian camp forecasting precious metals have been outlining a bottom in August-September that could launch a new bullish phase in hard money favorites like Barrick.
The main rationale for my “bluelight special” discount call in Barrick is its leverage to a bullish turn in gold/copper/silver prices. If the whole sector reverses higher on a Federal Reserve pivot from tightening actions and hawkish talk in the media toward aggressive easing to prevent a severe recession next year, EVERYONE on Wall Street will want to hedge inflation rates remaining high into the foreseeable future.
Yet, a monster rally in precious metals next year is only half the story to be bullish on Barrick Gold. Because of today’s lower-than-normal valuation at an important precious metals cycle bottom, the usual 2:1 miner leverage to future commodity price gains is likely much higher. For example, if gold prices climb $1000 an ounce next year (given a deep recession record money printing response by the Fed, or a Russia invasion of NATO territory bringing World War 3 fears into investment decisions), Barrick’s base cash flow could theoretically DOUBLE to $8.5+ billion annually (depending on inflation’s effect on mining costs). However, the stock price would surely more than double, shooting from a low valuation on weakened trailing results to enthusiastic assumptions of future gains. Honestly, you would be riding a cyclical swing in analyst/investor sentiment on top of the massive advance in underlying business worth.
Consequently, I have a price target of $35 per share in 12-18 months, assuming a 50% rise in gold to $2500 an ounce is coming in 2023. Given $3000+ gold by 2025, a quote of $40-$50 is not out of the question. So, $15 for price currently, with a 3% annual dividend yield bonus sure to rise with precious metals pricing, is screaming at equity shoppers to rush to the gold aisle at your local K-Mart and grab this bluelight special before supplies disappear.
Thanks for reading. Please consider this article a first step in your due diligence process. Consulting with a registered and experienced investment advisor is recommended before making any trade.
Be the first to comment