


Vertigo3d/iStock via Getty Images
Introduction
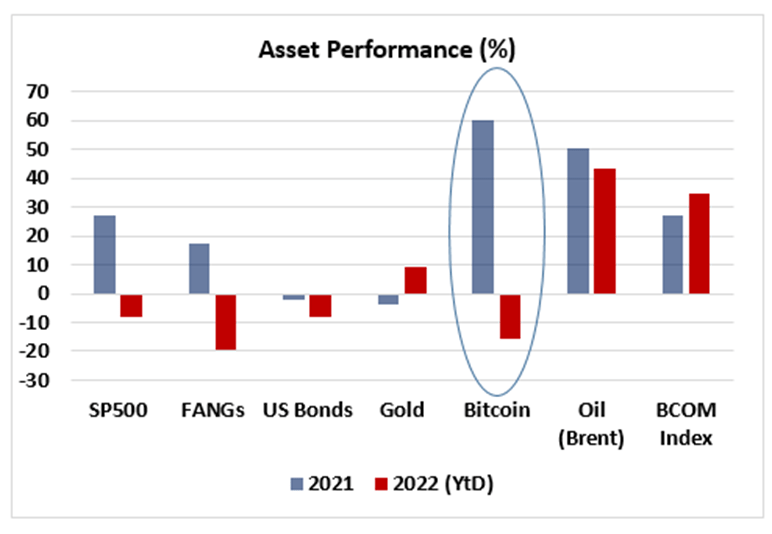
The titanic liquidity injections from major central banks to finance the high cost of lockdown policies imposed by the governments led to a significant rebound in risky assets, particularly assets strongly sensitive to the liquidity metrics. However, the rise in inflationary pressures in the past few months combined with the market uncertainty related to the Ukraine/Russia conflict have led to a surge in volatility, leaving many risk-on assets vulnerable for 2022. Figure 1 shows the performance of a range of assets in 2021 and 2022 (YtD). Interestingly, there has been a reversal in risk-on assets since the start of the year, with FANGs stocks being the worst performer this year, down nearly 20%. We can also notice a sharp reversal in bitcoin momentum, with the cryptocurrency down over 15% YtD after experiencing a 60% appreciation in 2021.
Figure 1
Reuters
With global growth expected to significantly slow down in the coming 6 to 12 months and inflationary pressures now expected to remain elevated longer previously estimated, 2022 will be a challenging year for risk on assets. Hence, investors have been questioning what will the implications be for bitcoin, which has started to act as a risk-on asset in the post-Covid era.
Correlation With Tech Stocks Has Been Surging
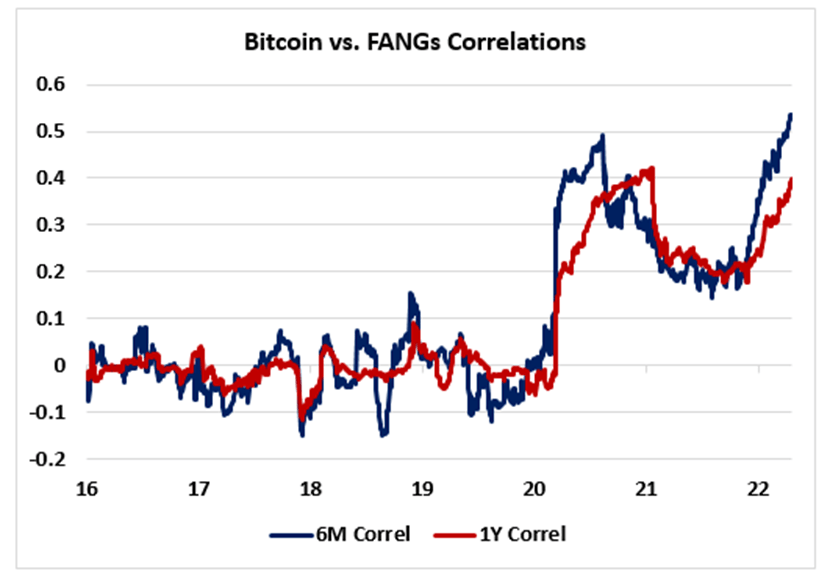
Prior 2020, the particularity of bitcoin is that it was moving independently of all asset classes, particularly equities. Figure 2 shows that bitcoin’s correlations to tech stocks (daily returns) was close to zero between 2016 and 2020 and have been rising significantly in the past two years. Bitcoin has been increasingly correlated to mega-cap tech stocks, which historically have been very sensitive to the liquidity dynamics, particularly in the past cycle.
The chart shows that the 6-month correlation has reached a new record high of 0.53, therefore raising investors’ skepticism over the long-term dynamics of bitcoin (relative to equity markets). Will investment funds overly weighted in equities diversify their portfolio by including assets such as bitcoin?
Figure 2
Reuters
Bitcoin: Unfriendly To High-Volatility Regime
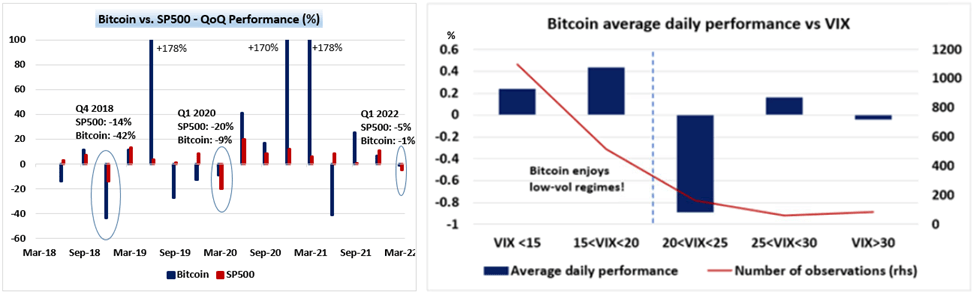
As opposed to gold, which has historically acted as a strong ‘hedge’ against periods of market frictions and soaring uncertainty, bitcoin has generally performed weakly in periods of high-volatility regime. Like all the ‘risk-on’ assets, bitcoin prices fall when price-volatility rises. Figure 3 (left frame) shows the quarterly performance of bitcoin vs. SP500 in the past few years. We observe that quarters of equity selloffs have been associated with a fall in bitcoin prices. For instance, bitcoin prices fell by 42% and by nearly 10% in the equity bear markets of Q4 2018 (-14% for SP500) and Q1 2020 (-20%). We can also note that the cryptocurrency has been vulnerable to the surge in geopolitical uncertainty since the start of the year. Even though bitcoin prices were down by only 1.2% in the first quarter of 2022, the cryptocurrency has dropped by nearly 45% since its peak reached in November (which also corresponds to the peak in the tech stocks).
In figure 3 (right frame), we compute the average daily performances of bitcoin in different pockets of price volatility (VIX). We can notice a sharp drop when VIX rises; for instance, bitcoin has averaged -0.9% in daily returns when the VIX was trading between 20 and 25.
Figure 3
Reuters
End Of Liquidity Era: Limited Gains For Bitcoin?
As we mentioned it earlier, bitcoin has probably joined the universe of risk-on assets that have been strongly sensitive to liquidity in the past cycle. Hence, investors have become increasingly concerned that the potential gains on bitcoin may become limited in the medium term as DM central banks are preparing to tighten their policy to ‘fight’ against the elevated inflationary pressures.
With US inflation hitting a four decade high of 8.5% in March, many practitioners have been speculating that the Fed is clearly behind the curve in its tightening process and may start to potentially accelerate its tightening cycle, proceeding with 50bps hikes in the coming meetings. With the FFZ2 currently trading at 97.60 (source: Bloomberg), the STIR market is currently pricing in a Fed Funds rate between 2.25% and 2.5% by the end of 2022, which stands at the high of the dot plot projections from the latest meeting (March 16).
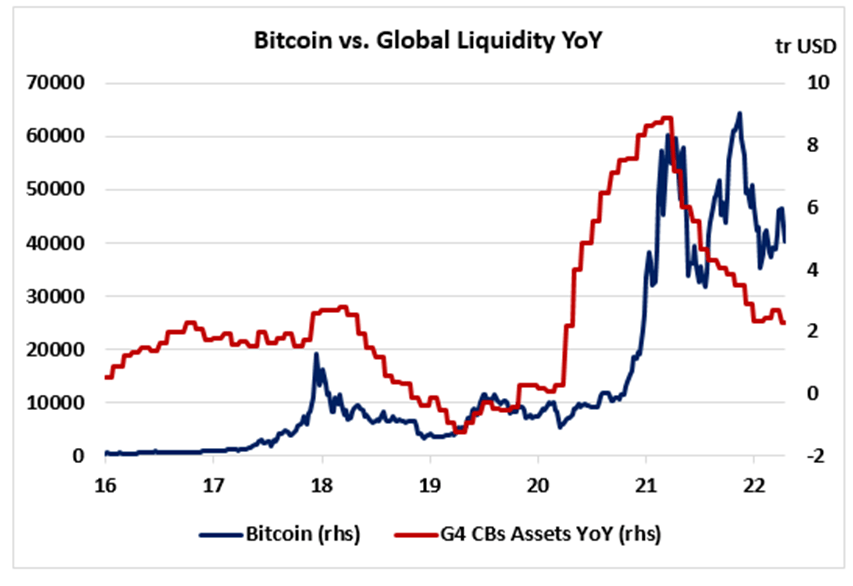
In addition, the end of the ‘liquidity era’ following two years of aggressive easing policies could also weigh on bitcoin prices in the medium term. Figure 4 shows that the dramatic increase in money supply from central banks following the March 2020 panic had been the major driver of bitcoin. However, we can notice that the deceleration in liquidity has ‘ended’ the bull market that followed Covid and has led to a higher volatility on the cryptocurrency market. Figure 4 shows that bitcoin started to experience greater volatility when the annual change in ‘liquidity’ (total assets from major central banks) has started to fall dramatically. Bitcoin has been fluctuating between $30,000 and $68,000 since the beginning of 2021.
Figure 4
Reuters
Can Bitcoin Decouple From The Real Economy?
Recession odds have surged since the start of the Russia/Ukraine conflict (particularly in Europe), therefore challenging risky assets for the rest of the year. We have seen that banks’ equities have underperformed the market in recent weeks despite the dramatic tightening in financial conditions (i.e. surge in LT bond yields), therefore indicating that investors remain worried about the economic outlook.
Hence, practitioners have questioned if the cryptocurrency market could stomach a period of sharp deceleration in the economic activity. Historically, ‘risk on’ assets have strongly underperformed in periods of recession or falling GDP growth, with stagflation usually being the worst outcome for stocks. On the other hand, ‘risk off’ assets (US Dollar, JPY, US Treasuries…) have benefited from investors’ ‘flight to safety’ and therefore outperformed the rest of asset classes, giving investors the chance to preserve their capital in a period of massive economic and political uncertainty.
Academic and empirical research have shown that ‘inertia’, how well an asset has performed in the past, has been an important characteristic when defining the fundamentals of ‘safe’ assets. Therefore, as bitcoin has never performed well in periods of greater uncertainty, it is difficult to see how the cryptocurrency can decouple from the real economy in the coming 6 to 12 months.
Bitcoin ST And MT Outlook
Figure 5 shows the ST and MT technical levels of bitcoin. It is clear that $30,000 represents a strong support on the cryptocurrency; a fall below that level would bring us to 2021 levels, erasing the gains accumulated in a period of extremely accommodative monetary policy. Next strong support to watch below $30,000 stands at $21,966, followed by the psychological $20,000 level. A break below the $30,000 level would clearly show the fragility of the entire cryptocurrency market in a period of tightening policy. In the short run, first support to watch stands at $36,000, which corresponds to the LT upward trending support line. We may see some buying interest around this level with investors aiming a ST upward consolidation.
On the topside, resistance to watch stands at $44,976, which corresponds to the 61.8% Fibo retracement of the 30,000 – 68,992 range. As a reminder, bitcoin reached an all-time high of $68,992 on November 9 and has been constantly reaching lower highs since then. Key resistance to watch stands at $48,135, which corresponds to the 200DMA (which was rejected in the end of March).
Even though the risk-reward on bitcoin looks currently slightly biased to the upside (as bitcoin approaches 30,000) in the short term, the upside gain remains limited as the DM central banks prepare for ‘aggressive’ tightening and the economic activity starts to decelerate sharply.
Figure 5
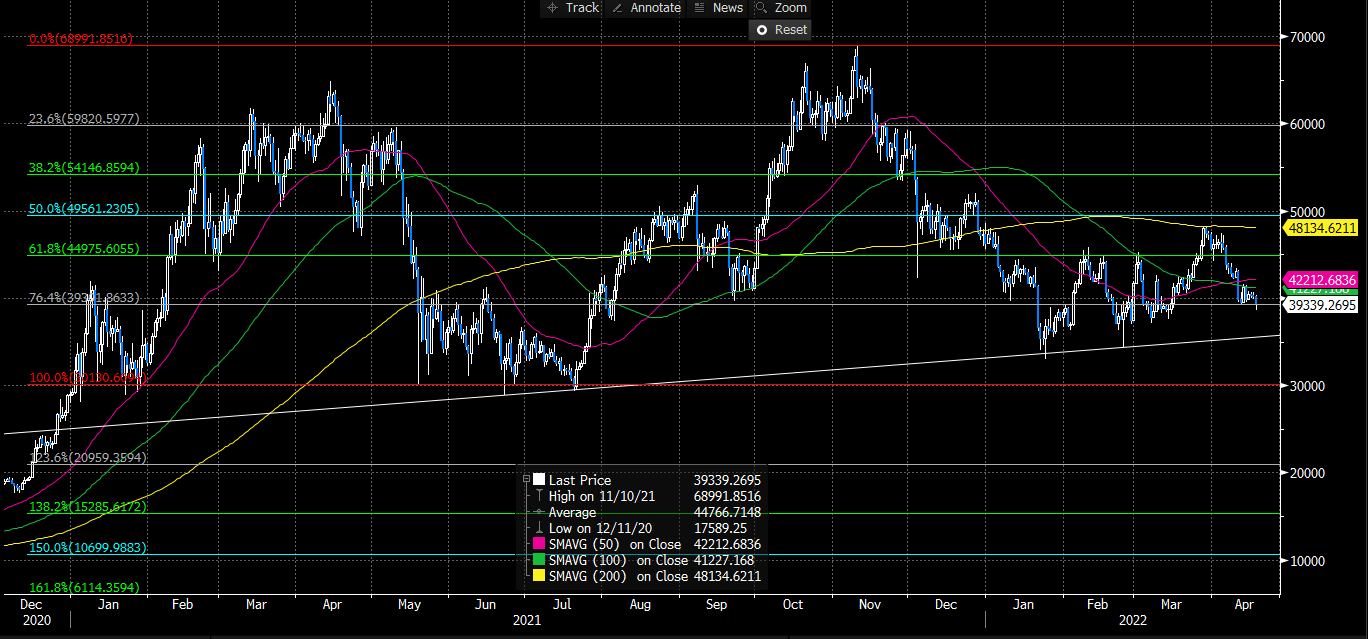
Bloomberg
Be the first to comment