

Bitcoin, Ethereum Analysis:
- Bitcoin’s bullish move at risk around zone of resistance
- Ether (ETH) highlights potential range, conditional upon upside rejection
- Crypto Fear and Greed Index offers insight into recent crowd psychology
Bitcoin Grinds Higher but Faces Huge Levels of Resistance
Bitcoin started the year in the same way it finished 2021, trending lower. Throughout January, BTC made lower lows and lower highs as a surging US dollar and hawkish Fed expectations weighed on the non-interest bearing asset. Additionally, the recent US – Russia tensions over Ukraine hasn’t helped risk assets, with bitcoin falling well within that category.
However, recent diplomatic efforts to calm the US-Russia tensions has provided a period of relief for risk assets as we have witnessed broad pullbacks in global equities and various JPY crosses (notably AUD/JPY, GBP/JPY). The situation, however, remains rather volatile and can change at any stage. Therefore, movements in BTC are expected to be news dependent and reactive in nature.
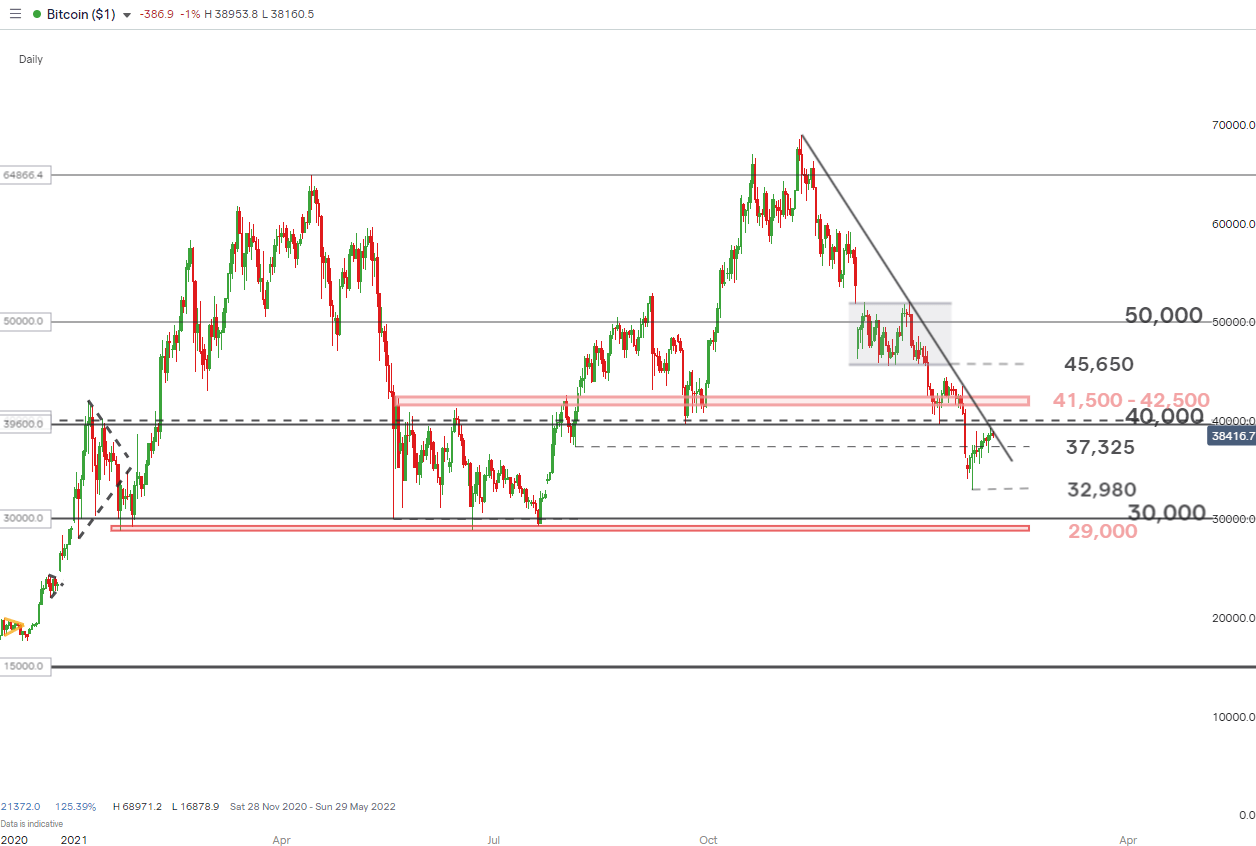
The recent uptick in bitcoin appears rather unconvincing, especially when comparing it to previous bullish moves that have produced greater momentum and volatility skewed to the upside. Looking at the chart, it becomes clear to see that BTC pivoted short of the major inflection point/zone around 29k/30k, meaning that a failure to break above the descending trendline – acting as support – opens the door to the 29k/30k retest. Additional resistance, should the breakout occur appears around the 41,500 to 42,500 zone. Therefore, the conditions around a sustained bullish move remain rather
Bitcoin (BTC) Daily Chart (Zoomed out to Highlight Major Zones)
Source: IG, prepared by Richard Snow
Ether Pivot Could Signal the Start of Potential Range
Ether, like bitcoin has witnessed a calm move higher from the January low. The daily chart showed a cluster of consolidation around the 76.4% Fib at 2466 and now looks to test the 2930 level of support at the 61.8% Fib level. Failure to trade above 2930 could see another move back towards 2466. The breakout scenario, on the other hand, brings in the 3385 level as nearest resistance.
Ether (ETH) Daily Chart
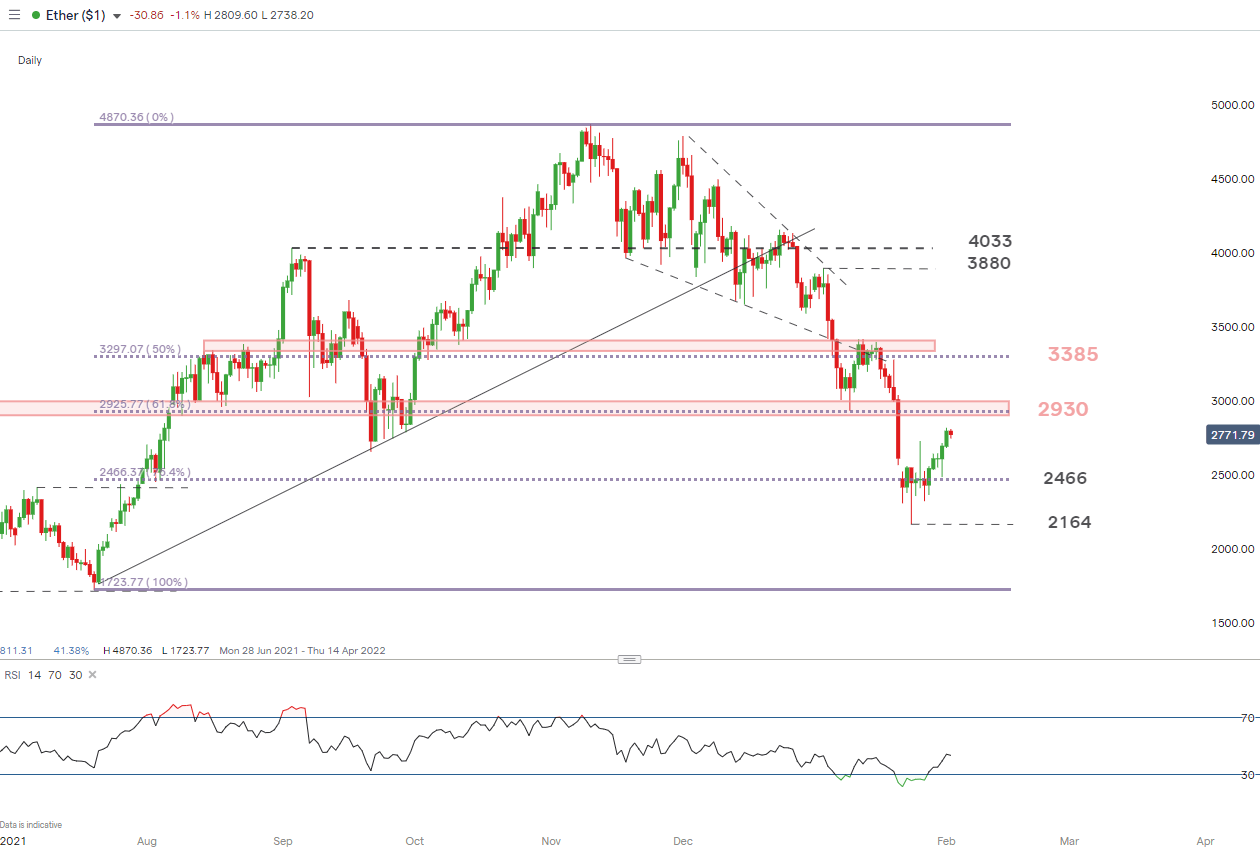
Source: IG, prepared by Richard Snow
Behavioral Finance with the Fear and Greed Index
The ups and downs of the psychology of trading is often amplified when trading volatile crypto markets and therefore, it is crucial to understand not only your personal strategy and emotions but also the emotions of the ‘crowd’.
Learn how to manage the emotions of trading
The Crypto Fear & Greed Index adopts a similar concept to CNN’s equity-related fear and greed index and tracks volatility, momentum, BTC’s performance vs alt coins and social media activity when determining the figure. This reading has been well within the fear segment of the reading which may present buying opportunities for value investors looking to secure lower dollar-cost-averaging within a wider portfolio of crypto assets. History shows us that periods of fear are followed by periods of greed however, the indicator provides no guidance on timing which is why the technical levels remain relevant.
Crypto Fear and Greed Index
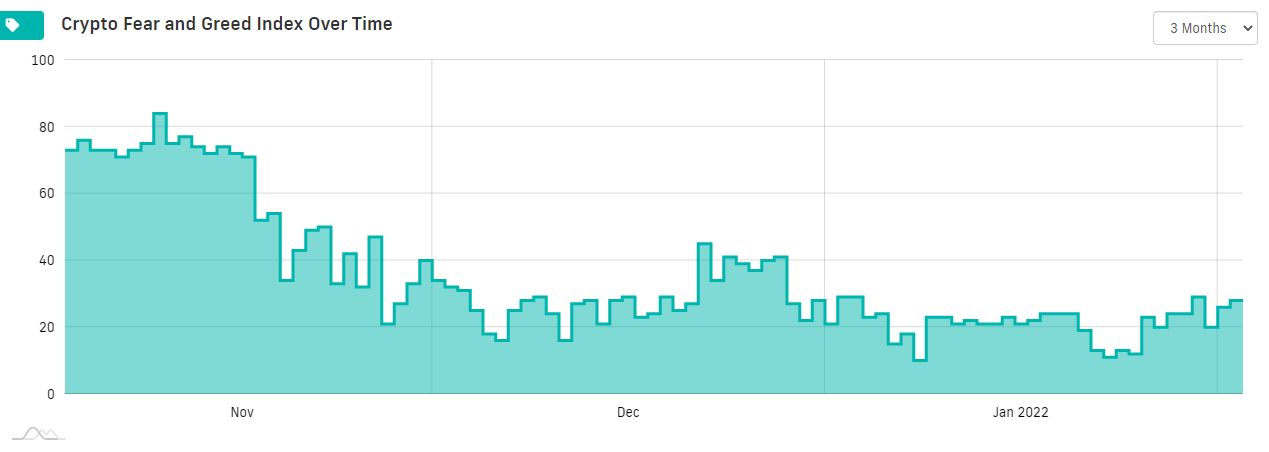
Source: alternative.me, prepared by Richard Snow
— Written by Richard Snow for DailyFX.com
Contact and follow Richard on Twitter: @RichardSnowFX
Be the first to comment