

Bitcoin (BTC/USD) and Alt-Coin Analysis and Charts:
- The daily Bitcoin chart is starting to look positive.
- ‘Wash Out’ zone needs to be overcome if the rally is to continue.
Bitcoin (BTC/USD) is leading the cryptocurrency higher again today as buyers tentatively return to the space after the recent heavy sell-off. Bitcoin’s market dominance is currently just under 44%, after trading sub-40% in mid-May, and this renewed interest and strength may well continue in the short term. The daily chart shows a bullish hammer formed on Tuesday this week, while BTC is also trading above the 20-day sma for the first time in a month. A close and open above this short-dated sma is needed to confirm positive sentiment in the market.
Moving Averages (MA) Explained for Traders
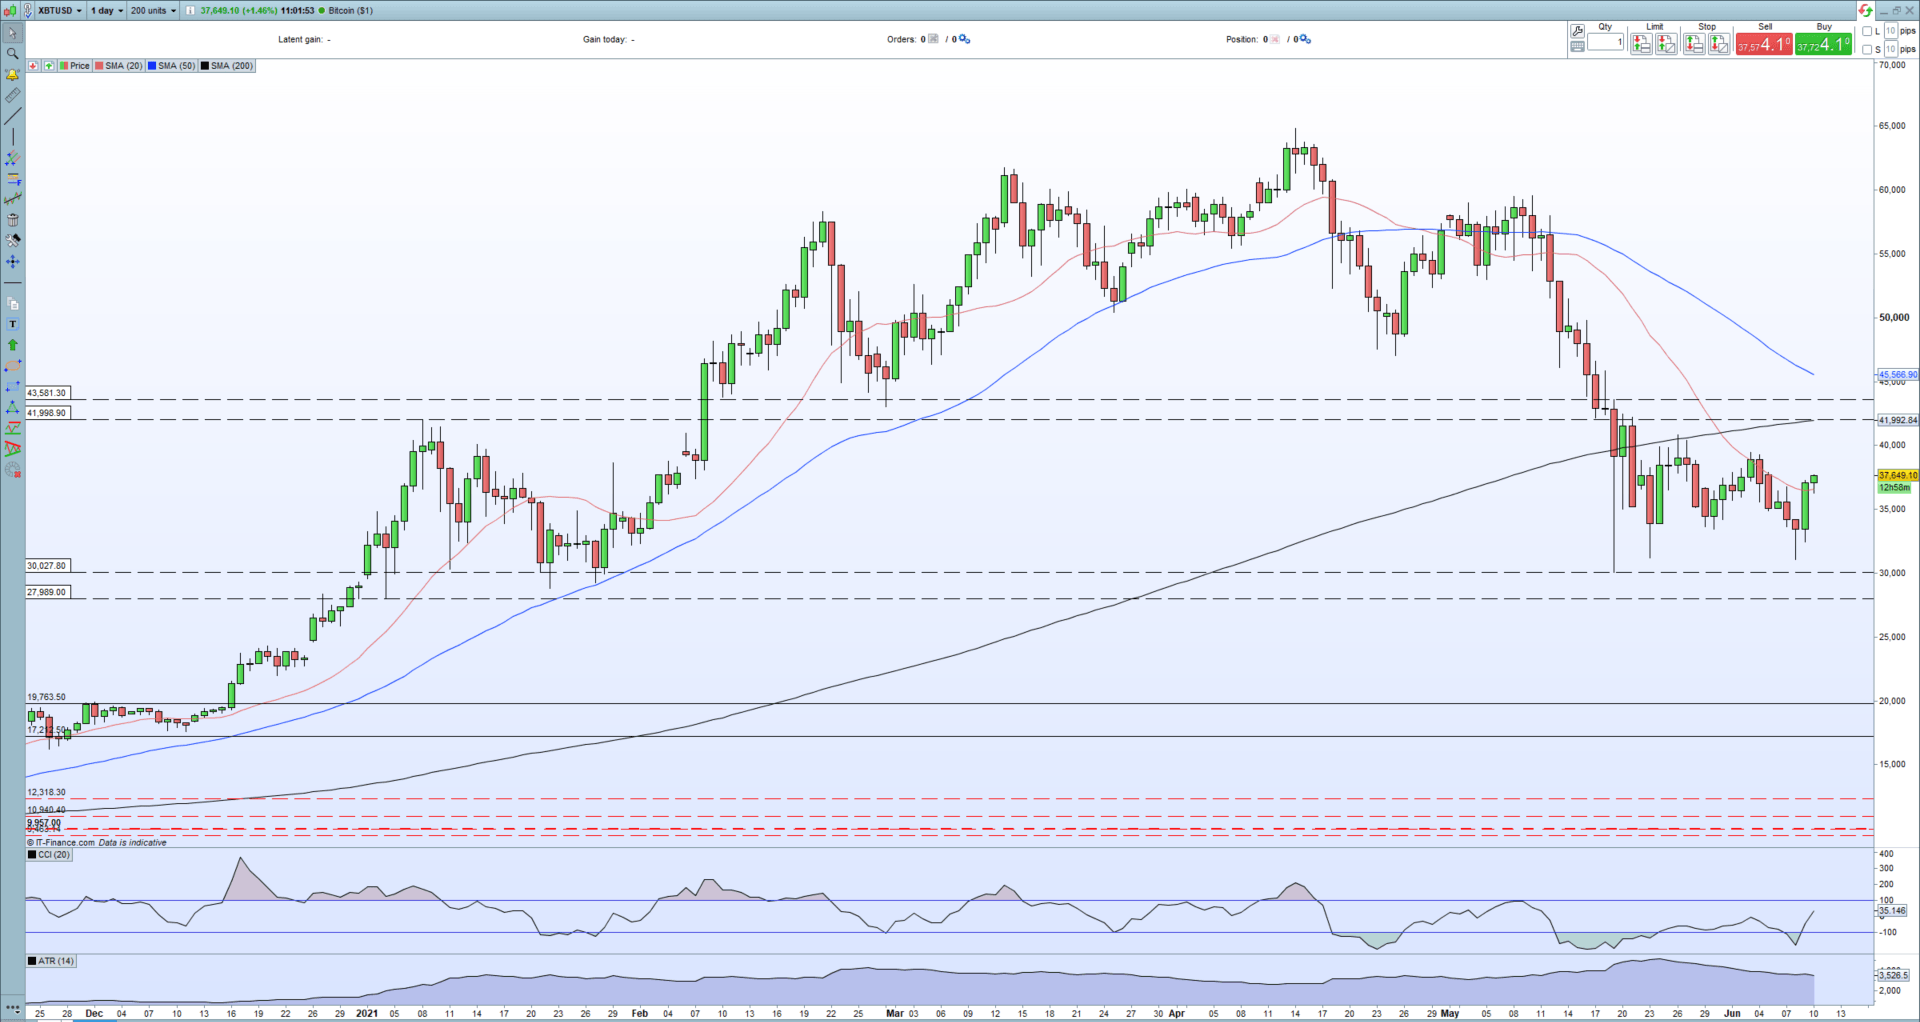
Tougher times lie ahead for the market peer with a zone between just under $42,000 and $43,580 likely to provide stiff resistance. The 200-sdma is currently just below $42,000, while the May 19 ‘wash out’ candle tops out at just over $43,500. Both the longer-dated sma and this zone/candle need to be broken conclusively to provide further positive sentiment.
A to Z Crypto: Demystifying the Top Cryptocurrency Jargon
Bitcoin (BTC/USD) Daily Price Chart
The alt-coin market remains under pressure and despite pushing higher on Wednesday, they remain sharply lower over the last 4-5 weeks. While the current rotation back into Bitcoin continues, it is unlikely that these recent alt-coin losses will be pared back significantly.
Traders of all levels and abilities will find something to help them make more informed decisions in the new and improved DailyFX Trading Education Centre
What are your views on Bitcoin (BTC) – bullish or bearish?? You can let us know via the form at the end of this piece or you can contact the author via Twitter @nickcawley1.
Be the first to comment