

Bitcoin (BTC/USD), Ethereum (ETH/USD) Outlook:
- Bitcoin (BTC/USD) prices retreat back to trendline support,
- Ether (ETH/USD) and other major cryptocurrency follow suite as rising yields support the greenback
- Will COP26 and inflation expectations hinder Bitcoin’s ability to climb higher?
Bitcoin, inflation & COP26
Bitcoin prices have continued to retreat from Wednesday’s ATH at around $69,093 as speculation over rate hikes continue to support higher yields, buoying the demand for the safe-haven Dollar.
Over the past year, a culmination of low interest rates, higher inflation and a rise in geopolitical tensions have resulted in an increase in the institutional adoption of digital assets, supporting both Bitcoin and Ether’s recent rally.
Visit DailyFX education to learn more about technical and fundamental analysis
After Wednesday’s US CPI data for the month of October revealed the highest annual rate of inflation in over 20 years at 6.2%, (YoY), the corresponding rise in Bitcoin prices suggests that investors have been using digital assets as an inflation hedge.
Due to supply constraints, energy prices have continued to surge, proving to be a contributing factor to the rise in inflation. However, as major central banks such as the ECB (European Central Bank), the Fed ( US Federal Reserve) and the BoE (Bank of England) prepare to tackle inflation, both technical and fundamental factors may further assist in the catalyzation of price action for the imminent move.
With global policymakers now focused on reducing fossil fuels and carbon emissions, more stringent measures around Bitcoin mining is an additional variance of concern. Although the COP26 summit is expected to end today, discussions are likely to continue into the weekend.
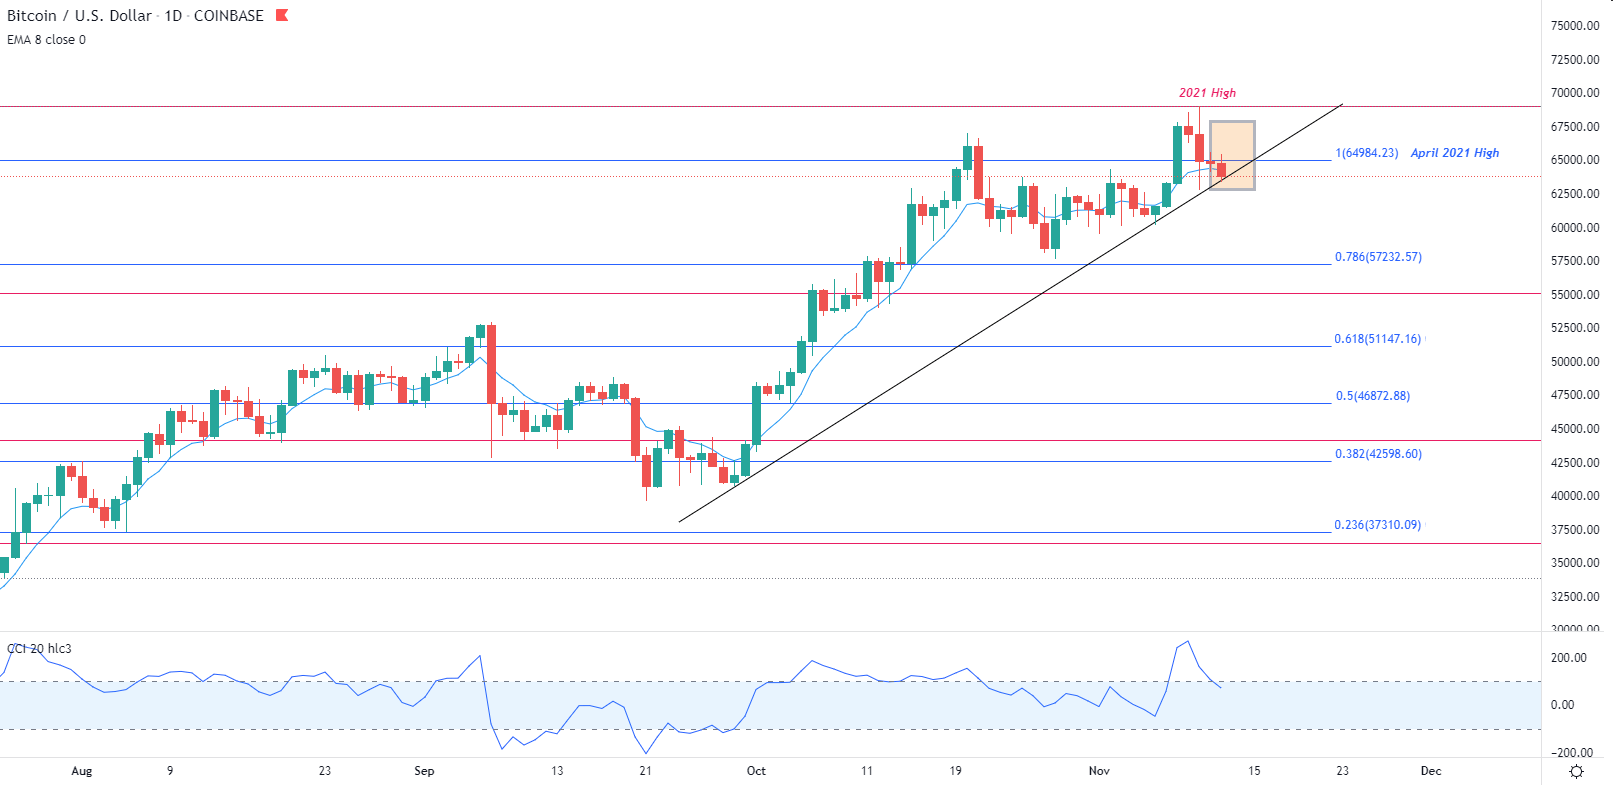
Bitcoin Technical Analysis
After setting another fresh record high of $69,093 on Wednesday, failure for the bulls to break above key psychological level of $70,000 allowed bears to drive price action back towards the $65,000 handle.
With price action currently testing trendline support, Bitcoin prices have fallen below the 8-period EMA (exponential moving average) pushing the CCI (commodity channel index) back within range.
Bitcoin (BTC/USD) Daily Chart
Chart prepared by Tammy Da Costa using TradingView
Although the upward trajectory remains intact (for now), the weekly CCI remains in overbought territory while the appearance of a shooting star provides caution that a reversal or a potential correction may hinder buyers ability to reclaim dominance over the systemic, prominent trend.
Bitcoin (BTC/USD) Weekly Chart
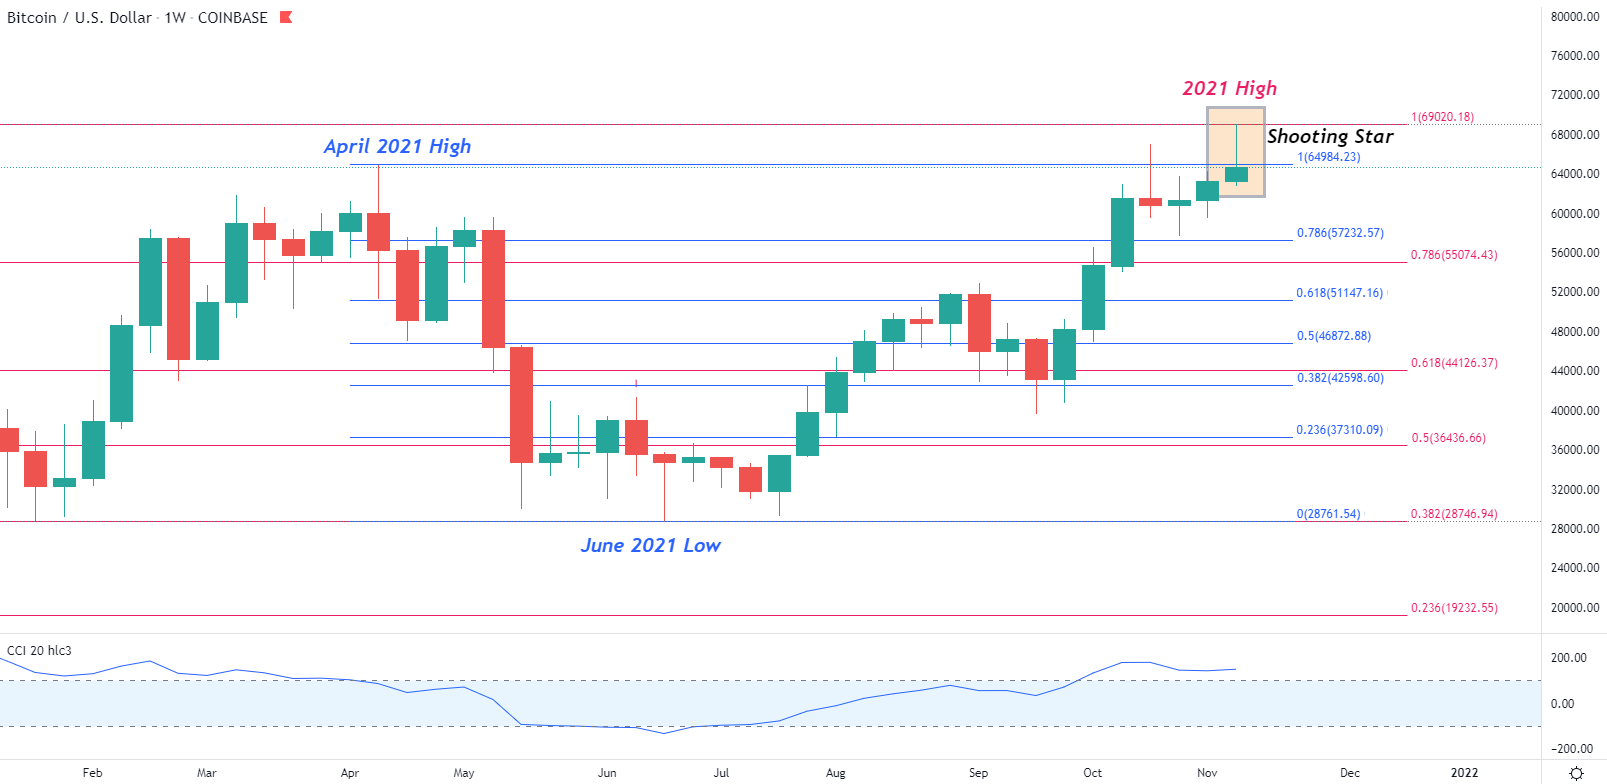
Chart prepared by Tammy Da Costa using TradingView
Bitcoin (BTC/USD) Key Levels
For now, key levels of support and resistance remain between $58,000 and $70,000 respectively. If prices are able to clear $65,000, a retest of $70,000 and a potential new high may be probable.
Contrary to this, increased selling pressure may allow bears to drive prices back towards the $58,000 handle and a potential retest of $55,000.
— Written by Tammy Da Costa, Analyst for DailyFX.com
Contact and follow Tammy on Twitter: @Tams707
Be the first to comment