

Key Talking Points:
- BTC/USD resets overbought conditions and heads towards its weekly resistance
- ETH/USD bounces off 3,000 as it aims to hold above its 50% Fibonacci retracement
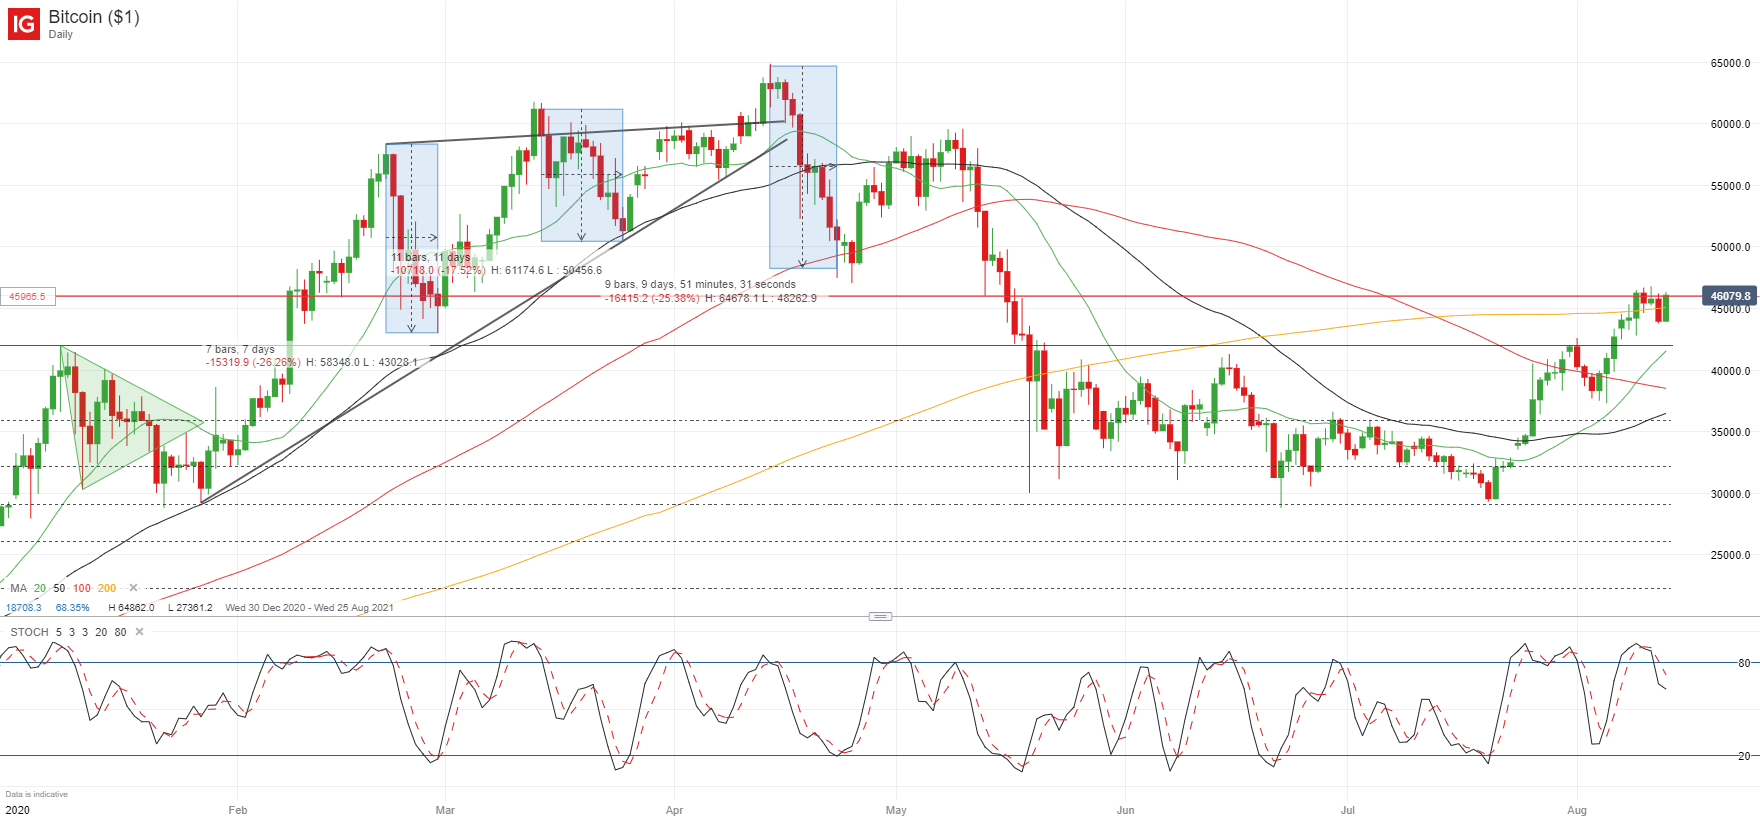
BTC/USD lost its appetite for further gains on Thursday as the pair dropped almost 4% to 43,800, but has bounced back and corrected this morning, trading at 46,150 at the time of writing. Bitcoin has seen some corrective pressure since it started its bullish run back on July 21st, which only adds to the bullishness of its rally.
The crypto is now facing a major challenge in its attempt to break higher, as every session so far this week has found resistance between 46,220 and 46,775, unable to build further gains. This are has attracted attention in the past, both as support and resistance, which means it would likely be followed by another big leg higher if broken and held above this area. Yesterday’s pullback has helped reset momentum indicators from their overbought conditions so its in a good position to capitalize further gains if momentum picks up.
BTC/USD Daily Chart
It isn’t an easy ride for Bitcoin as regulatory clampdowns continue, but new algorithm updates are making it harder and less profitable for people to mine Bitcoins as the crypto reaches its limit of 21 million coins permitted. The shorter the new supply of coins being created then the more likely we are to see volatile moves on the basis of supply and demand dynamics with limited offer.
ETH/USD Daily Chart
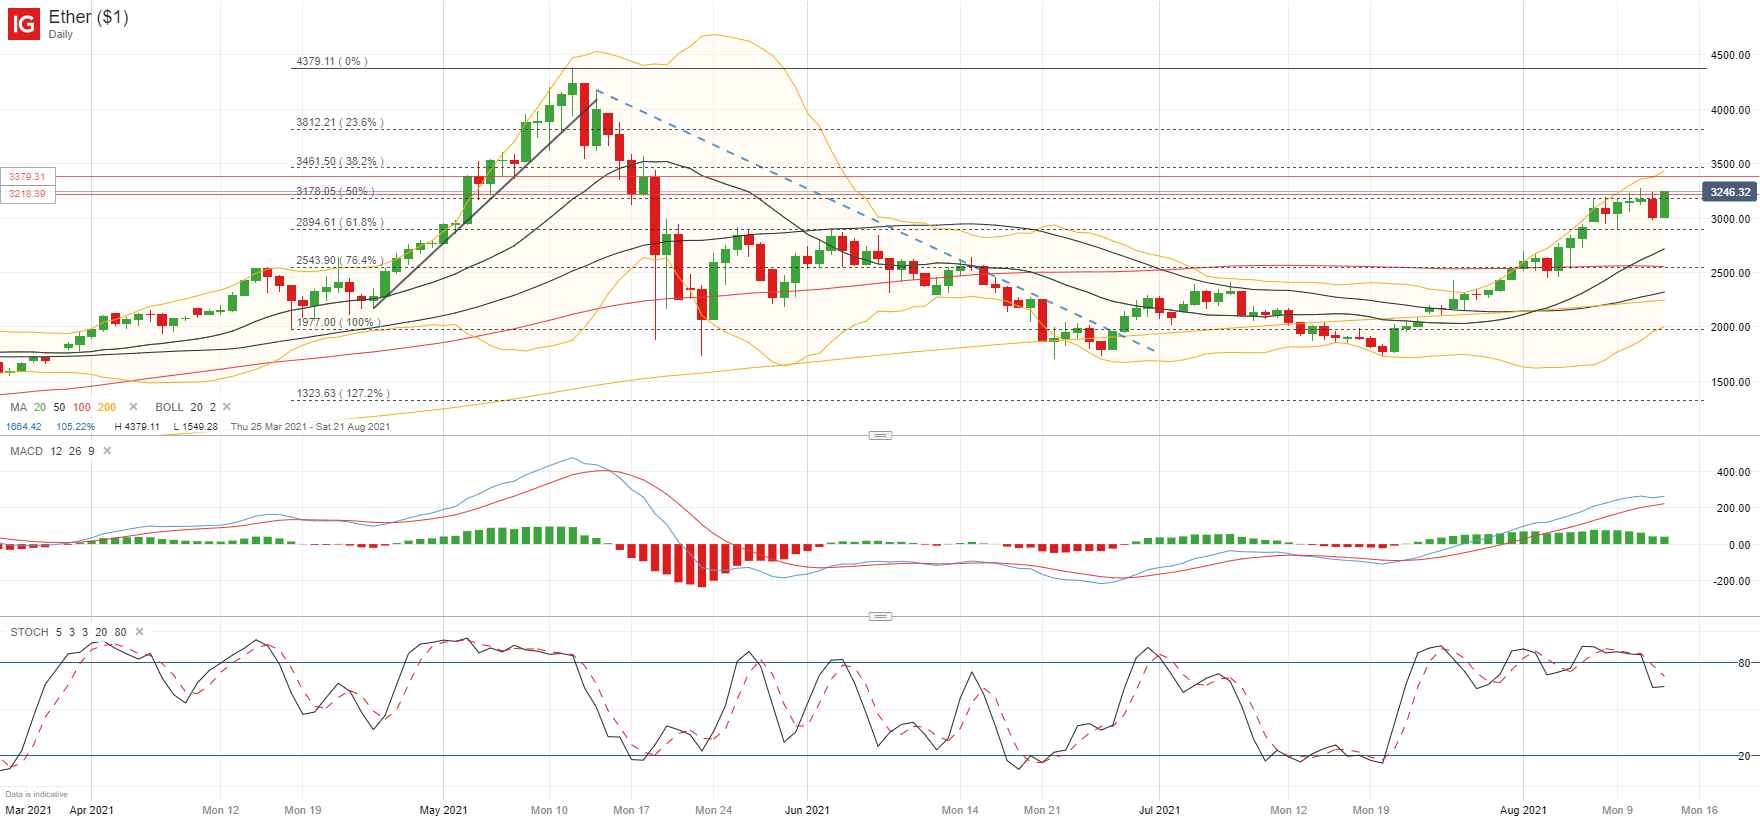
Ethereum has continued to track the performance in Bitcoin and is now battling key resistance after bouncing off the 3,000 mark from Thursday’s pullback. The critical area for ETH/USD is 3,218 – 3,379 where price has fluctuated in the past. The last 5 or 6 sessions have seen bulls struggling to hold above the 50% Fibonacci retracement at 3,178, so today’s close will be an important area to look out for going into the weekend, where volume is usually reduced and we have seen big crypto moves in the past.
How to Read a Candlestick Chart
Learn more about the stock market basics here or download our free trading guides.
— Written by Daniela Sabin Hathorn, Market Analyst
Follow Daniela on Twitter @HathornSabin
Be the first to comment