

everythingpossible
Investment Summary
In November last year technical indicators suggested the Bio-Techne Corp. (NASDAQ:TECH) share price may have been turning a corner. As such, we advocated TECH as a tactical buy to harvest upside from a breakout above previous highs, looking to sell at a 15–20% profit. Unfortunately, the technically-derived thesis has not played out. TECH has continued within a wide descending channel with strong mean-reversion activity since its January FY22 selloff [Exhibit 1]. Moreover, the fundamental picture hasn’t changed for the company either.
Exhibit 1. Case for technical reversal now weaker with latest decline in share price [note: prices are adjusted for 4-for-1 stock split effective November 30, 2022].
Data: Updata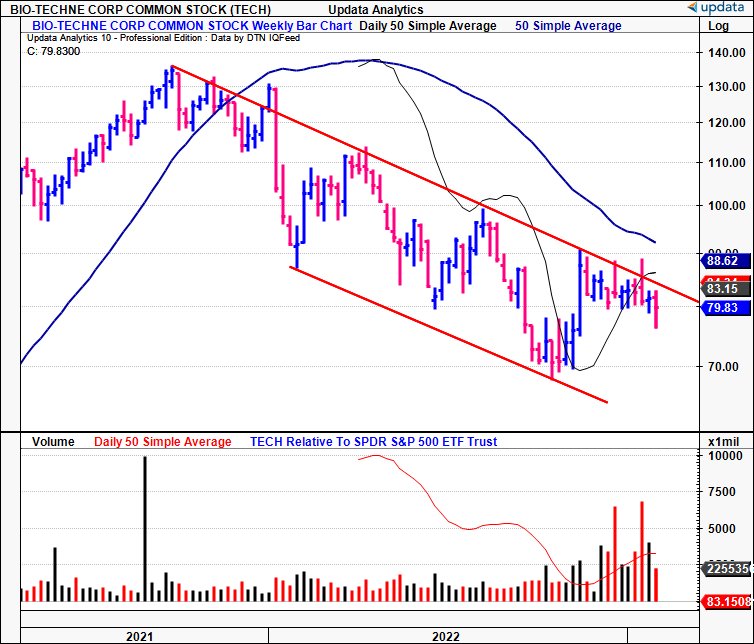
Looking to the market, supply has been heavy following each relief rally along the way. This was a key risk we identified to our buy thesis last time: “Key risks to the thesis involve price action, as investors may continue unloading shares…”. You’ll note in Exhibit 2, that outflows have been heavy since the last report, corresponding with flat price action along the way. As such, the key identifiable risk came to fruition, nullifying our buy call. This is unfortunate, but no investment comes without its underlying risks.
Exhibit 2. Daily outflows in TECH equity leading to price decrease in share price
Data: Updata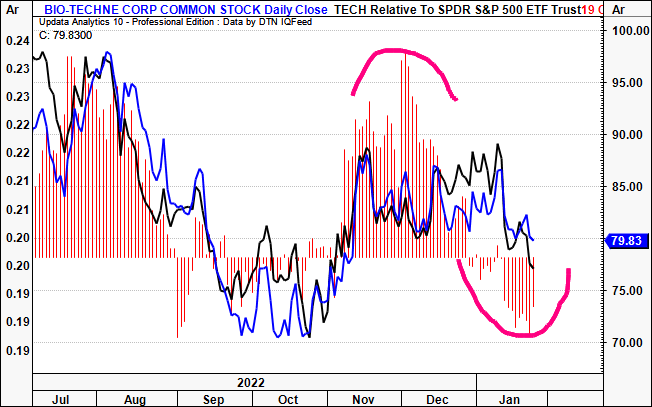
It’s time to have a deeper look at the TECH investment debate and gauge what value is on the table for shareholders looking forward. Here I’ll run through why we believe TECH is now overpriced and the underlying fundamentals to support this view. Net-net, we pare our call back to a hold on TECH for now.
TECH deep view of growth, value creation
Active investors are in the business of allocating capital, efficiently as possible. That means identifying companies that generate attractive value, then buying the corporate securities of these firms. Companies can generate shareholder value when they generate a return on their investments that exceeds the cost of capital. As such, the value of the firm to investors is a combination of growth and return on invested capital (“ROIC“). Oftentimes, earnings and EPS are assigned as the only proxies for profitability, growth and value. However, this is often misleading, given the effects of leverage, tax, accruals-based accounting, and more. Moreover, return on equity (“ROE”) benefits from the effects of leverage, so estimated equity value can reflect this as well.
Consequently, analyzing post-tax earnings (“NOPAT”) are a better measure to make investment decisions, as it captures operating performance whilst excluding the effects of capital structure and GAAP accounting. Here, we can look at growth as a function of how much a company reinvests and how well it reinvests. More specifically, the growth in post-tax earnings. As a matter of principle, I’ll run through this with TECH’s Q3 FY22 numbers.
You’ll see in Exhibit 3, that TECH generated $248.7mm in trailing NOPAT at the end of Q3 FY22, up from $127mm in Q1 FY20. However, to push the numbers from $127–$248mm the company required a larger increase in investment. Essentially, to grow NOPAT by $121.6mm required $757.4mm in capital investment, a c.16% return on incremental invested capital (“ROIIC“). This compares to the Q3 FY22 return on invested capital of 19.2%. Note, the hurdle rate for TECH was 10.8% that quarter, leaving 8.3% of economic profit.
This isn’t terrible, but it’s all relative. At this rate of return, TECH had to reinvest 33.3%, or 1/3rd of its post-tax earnings from Q1FY20–Q3FY22. This is a fairly capital-intense business, therefore, meaning its after-tax growth rate was a meagre CAGR of 5.35% per TTM over this time [read notes to Exhibit 3]. It’s unsurprising to see the performance of its share price since that time closely matching this.
Exhibit 3. Growth in post-tax earnings for TECH at 5.35% since FY20, using trailing 12 month data each quarter.
Note: Rolling trailing 12 month periods are used as it provides an 11 period look-back window, each period consisting of 12 months each. The CAGR for TECH’s share price is calculated using the 11 lookback periods, meaning it compounded 3.3% on average for each period. The S&P 500 has compounded at ~1.8% on the same basis. Long-term annual results can also be used. For more on analysing growth rates, see: . Mauboussin (2012): Calculating Return on Invested Capital How to Determine ROIC and Address Common Issues; (2020): The Math of Value and Growth, Return on Capital, and the Discount Rate; Saber (2016): Calculating the Return on Incremental Capital Investments; Schroders (2021): The Value of Growth. Aswath Damodaran has written extensively on this subject as well. (Data: Author, using data from TECH SEC Filings)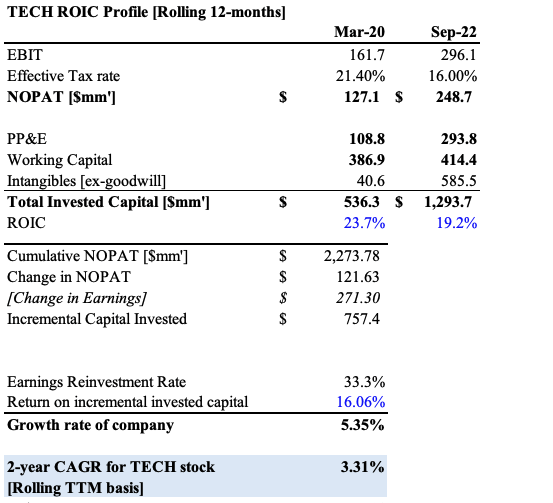
Using these numbers we can make some very basic assumptions about what growth might look like for TECH looking ahead. Presume that the company can maintain its Q3 FY22 trailing ROIC of 19.2% into FY28, and wanted to continue growing at the same pace, reinvesting ~1/3rd of NOPAT each year to do so [we’ve chosen FY28 as a 5-year horizon]. We’d expect the company to compound post-tax earnings at ~5.5% per year to $360mm [Exhibit 4]. At the same time, we’d anticipate another ~$583mm in capital investment [$97mm/year] over this time. Hence, to grow earnings after tax by $112mm [$18.6mm/year] would require this amount of investment, and the reinvestment rate would dip to 31%. Keep in mind, these are very basic assumptions of modelling growth, but highlight the importance of a high ROIC nonetheless.
Exhibit 4. Rolling above assumptions forward, we’d see another $112mm in organic NOPAT growth into FY28.
Note: see Exhibit 3. (Data: Author, using data from TECH SEC Filings)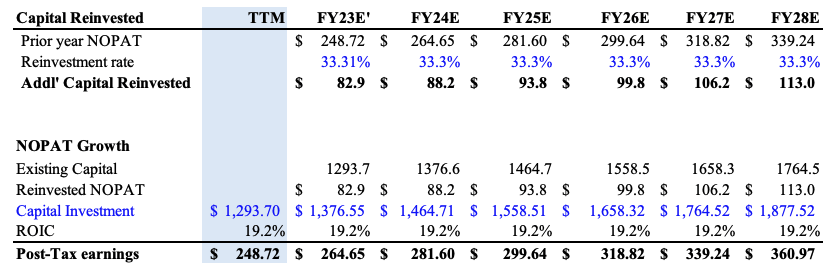
The intrinsic value of any asset is the present value of its future cash flows. This in mind, we can discount these projected earnings at TECH’s current WACC of 10.8%, leaving $8.27 in EPS [Exhibit 5]. Multiples are supposed to be used as shorthand for the valuation process. If we assume its share price will compound at a similar 6% rate over this time [in-line with growth], then TECH looks fairly valued at 16.12x forward P/E when using these rudimentary assumptions. At the current market price, it’s ~12x. This requires a substantial pullback in earnings, or major uplift in growth. Note, it currently trades at 45x forward earnings, which we feel is far too pricey – paying 45x post-tax earnings for 6% growth doesn’t cut it, in our opinion. In fact, to justify its valuation, we estimate TECH would need to trade up at the $300 mark.
Consensus has TECH to generate $339.6mm in tax-adjusted earnings for FY23′, a 6% YoY growth rate. The problem with that, is the economics of its growth profile don’t suggest this will create value in our opinion. To achieve the consensus targets above, at its long-term ROIIC of 16%, we believe it needs to reinvest 38% of post-tax earnings using the assumptions from above [Exhibit 5]. Hence, we’d expect that, at a modest growth rate of ~6% to ~$340mm in FY23, this will still require a $426mm additional capital investment to achieve.
Exhibit 5. Estimated that TECH requires to invest 37% of post-tax earnings to achieve 6% growth rate
Note: Calculations use estimates from Exhibit 4 (Data: Author)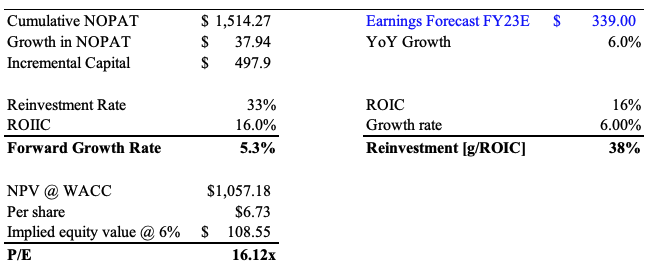
Takeaways
There’s more to it than just calculating and estimating the mathematics of a company’s value in terms of growth and ROIC. There are many drivers to valuation, notwithstanding the underlying macroeconomics of the broad industry and economy. Obviously, there will be updates to the company’s growth engine as we move down the line.
However, doing so serves as a fantastic platform to make investment decisions, especially on a comparables basis. We found that TECH needs to reinvest ~1/3 of its post-tax earnings to achieve the consensus growth rate of ~6%, likely achievable given the historical data. However, carrying these assumptions forward, the stock looks largely overvalued at 45x forward earnings, and paying this multiple doesn’t seem justified at this stage. Rate hold.
Be the first to comment