

naphtalina/iStock via Getty Images
Our forward-looking fund research consistently identifies mutual funds and ETFs that outperform their benchmarks and warns investors of funds most likely to underperform. After rigorous analysis of ~1,000 ETFs, we identified another ETF with quality holdings at cheap valuations. Pacer US Small Cap Cash Cows 100 ETF (BATS:CALF) is this week’s Long Idea.
Forward-Looking Research Reveals a Very Attractive Fund
We leverage our Robo-Analyst technology to analyze a fund’s individual stock holdings and assess the overall quality of the fund. This uniquely rigorous approach enables us to create forward-looking ETF and mutual fund ratings based on the strength and valuation of the underlying businesses of the stocks held in a fund.
Our analysis of each of the holdings of CALF and its benchmark, the iShares Russell 2000 ETF (IWM), reveals CALF allocates more to highly profitable companies with cheap valuations than IWM. CALF earns our Very Attractive Predictive Fund Rating while IWM earns an Unattractive rating.
Per Figure 1, CALF allocates 57% of its assets to Attractive-or-better rated stocks compared to just 22% for IWM. On the flip side, CALF allocates just 10% of its assets to Unattractive-or-worse rated stocks compared to 35% for IWM.
Figure 1: CALF Allocates Capital to Superior Holdings than IWM
CALF Allocation vs. IWM (New Constructs, LLC and company filings)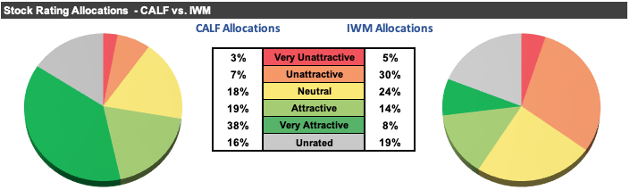
Per Figure 2, our holdings analysis also reveals CALF’s portfolio is much higher quality than the S&P 500 as represented by State Street SPDR S&P 500 ETF Trust (SPY). 17% of SPY’s portfolio is allocated to Unattractive-or-worse rated stocks, while just 37% is allocated to Attractive-or-better rated stocks.
Figure 2: CALF Allocates Capital to Superior Holdings than SPY
CALF Allocation vs. SPY (New Constructs, LLC and company filings)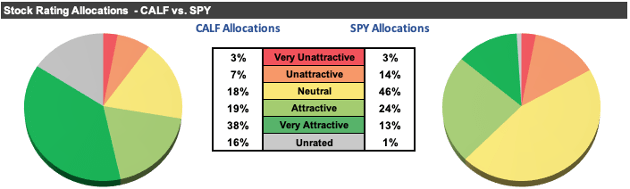
Selection Process Finds Quality and Value
Similar to its large-cap counterpart Pacer Funds U.S. Cash Cows 100 ETF (COWZ), which we made a Long Idea in March 2019 and highlighted again in April 2020, CALF adheres to a simple strategy that leads it to select a large number of stocks with an Attractive-or-better rating. CALF managers select the 100 companies with the highest trailing twelve month free cash flow yields from the S&P SmallCap 600 and weights them by FCF yield.
Focusing on FCF yield puts CALF’s managers on the right track to identifying companies with quality cash flows and cheap valuations. Unlike traditional metrics such as price-to-earnings (P/E) ratios, FCF yield provides a much more accurate measure of value.
CALF’s FCF yield focused methodology isn’t just good on paper, but in practice too. The average FCF yield of CALF’s holdings is 6%, which is greater than -1% for IWP and triple the FCF yield for the S&P 500. See details below.
Quality Stocks Drive Very Attractive Risk/Reward Rating
Taking a closer look at each of CALF’s holdings reveals the strength of its selection methodology. Out of the 89 CALF holdings under coverage:
- 100% have a positive ROIC
- 82% have a positive free cash flow yield
- 79% have a positive PEBV ratio of 1.3 or less
- 71% have a growth appreciation period of 10 years or less
- 90% receive a Risk/Reward rating of Neutral-or-better
Figure 3 contains our detailed rating for CALF, which includes each of the criteria we use to rate all ETFs under coverage. These criteria are the same for our Stock Rating Methodology, because the performance of an ETF’s holdings equals the performance of the ETF after fees. Figure 3 also compares CALF’s criteria ratings with those of IWM and SPY.
Figure 3: Pacer U.S. Small Cap Cash Cows 100 ETF Fund Breakdown
CALF Rating Details Table (New Constructs, LLC and company filings)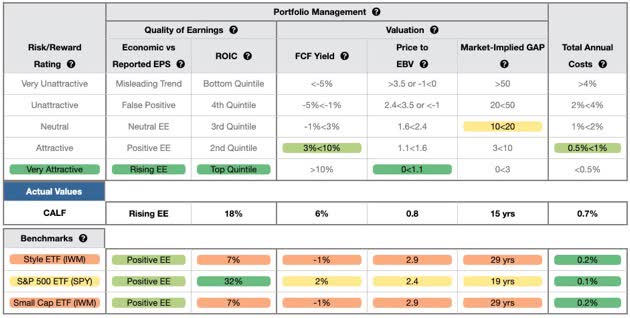
CALF’s holdings are superior to IWM in all five criteria that make up our holdings/Portfolio Management rating and are superior to SPY in four out of five criteria. Specifically:
- CALF’s economic earnings are positive and rising, unlike IWM and SPY
- CALF’s return on invested capital is 18% and greater than the 7% earned by IWM
- CALF’s free cash flow yield of 6% is higher than IWM at -1% and SPY at 2%
- the price-to-economic book value ratio for CALF is 0.8, which is much less than the 2.9 ratio for IWM and 2.4 for SPY
- our discounted cash flow analysis reveals an average Market-Implied GAP of just 15 years for CALF’s holdings compared to 29 years for IWM and 19 years for SPY
The stocks held by CALF generate higher-quality cash flows and have lower valuations than IWM. Market expectations for stocks held by CALF imply profits will fall 20% from current levels (measured by PEBV ratio) while the expectations embedded in IWM’s holdings imply profits will grow by 190%.
Quality Stock Selection is Worth Paying For
CALF’s 0.65% total annual costs are above the 0.4% simple average and 0.2% weighted average of the 69 other Small Cap Blend ETFs under coverage. CALF’s managers’ ability to identify high-quality stocks at cheap valuations helps to justify the fund’s above-average fees. Figure 4 shows our breakdown of CALF’s total annual costs.
Figure 4: CALF Total Annual Costs Breakdown
CALF Total Annual Costs Breakdown (New Constructs, LLC and company filings)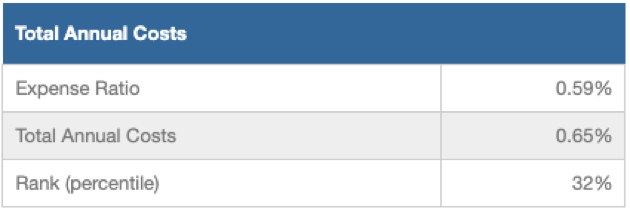
The Importance of Sector and Holdings Based Fund Analysis
Simply buying an ETF or mutual fund based on past performance does not necessarily lead to outperformance. Only through holdings-based analysis can one determine if a mutual fund is allocating to stocks with businesses with high earnings quality and low valuations, as CALF does.
Most investors don’t realize they can already get the sophisticated fundamental research that enables investors to overcome inaccuracies, omissions, and biases in legacy fundamental datasets. Our Robo-Analyst technology analyzes the holdings of all mutual funds and ETFs under coverage to avoid “the danger within.” Our diligence on holdings allows us to cut through the noise and find mutual funds, like Pacer U.S. Small Cap Cash Cows 100 ETF, with a portfolio that suggests future performance will be strong.
Build an Even Better Fund for Yourself
As we showed in The Paradigm Shift to DIY ETFs, new technologies enable investors to create their own fund without any fees while also enabling better, more sophisticated weighting methodologies. If we reallocate the fund’s holdings according to economic earnings, a more accurate picture of the true cash flows of a business, our customized fund allocates:
- 94% of assets to Attractive-or-better rated stocks (compared to 57% for CALF)
- 0% of assets to Unattractive-or-worse rated stocks (compared to 10% for CALF)
Compare the quality of stock allocation in our customized version of CALF vs. as-is CALF in Figure 5.
Figure 5: Pacer U.S. Small Cap Cash Cows 100 ETF Allocation Could Be Improved
CALF Allocations vs. Our Custom Fund (New Constructs, LLC, company, and ETF filings)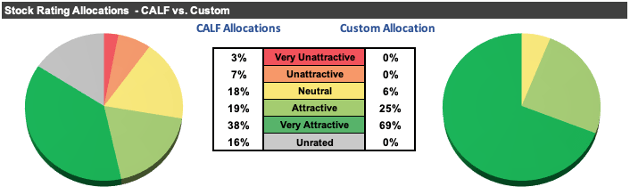
This article originally published on June 15, 2022.
Disclosure: David Trainer, Kyle Guske II, and Matt Shuler receive no compensation to write about any specific stock, style, or theme.
Be the first to comment