

BeyondImages
Australian resources company BHP Group Ltd. (NYSE:BHP) performed strongly in the last five years, outperforming the Australian Stock Exchange ((S&P/ASX)) and coming within a few percentage points of matching the S&P 500. The secret to this success is two-fold: A nascent era of prudent capital allocation in the mining sector, and profitability driven by a remuneration policy that aligns management’s interests with those of the shareholders. The company remains a very attractive investment, offering investors an FCF yield of more than 14%.
In the last five years, BHP’s shares have grown by nearly 47%, compared to a rise of nearly 15% for the S&P/ASX 50, and more than 48% for the S&P 500.
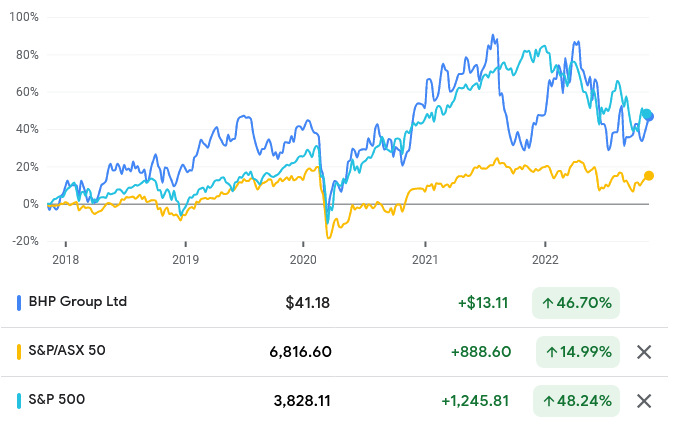
Source: Google Finance
In the year-to-date, the stock is down nearly 3%, while the S&P/ASX 50 is down by nearly 6% and by more than 20%. BHP’s strength is a function of the strength of the resources industry in recent years, especially since the start of the pandemic.
In the last five years, the MSCI World Metals and Mining Index has returned 7.65% a year, compared to 6.37% per year for the MSCI World. In the year-to-date, the MSCI World Metals and Mining Index is down 12.17%, while the MSCI World is down 20.07%.
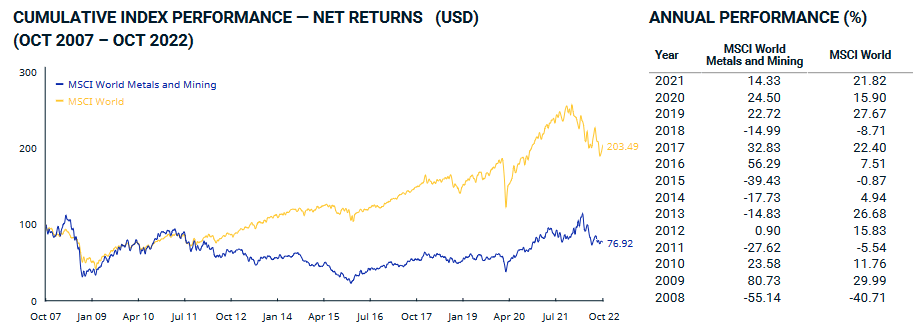
Source: MSCI World Metals and Mining Index
Go back across a decade, and the MSCI World Metals and Mining Index returned just 1.58%, whereas the MSCI World gained 8.94%. The current strength of the resources sector is unique. A rising tide lifts all boats. That’s even more true of the resources sector. There’s a large lag between production decisions and observed future prices, which leads to a highly volatile sector following the cobweb model. For example, this year, BHP is one of the biggest spenders in the mining sector, with a spend of about $9 billion for the financial year ending in June 2022. $5.7 billion of that was spent on the Jansen Stage 1 potash project. Construction will take some six years, with the first ore expected in 2027. That’s a six-year lag between production decisions and observed future prices. Given that no firm has pricing power, production decisions chase price movements. In boom times, firms grow their assets, raising capital, and spending on increasing production. Most times, these production decisions are overly optimistic or overly pessimistic if taken during a bust. So, in boom times, those overly optimistic production decisions lead to an oversupply, which in turn causes the bubble to burst. Capital is destroyed, profitability, so reliant on overly optimistic projections, plunges. Capital exits until a point where profitability returns to the market. Thus, there’s an inverse relationship between asset growth and future returns, with low asset growth industries or firms doing better than high asset growth industries or firms.
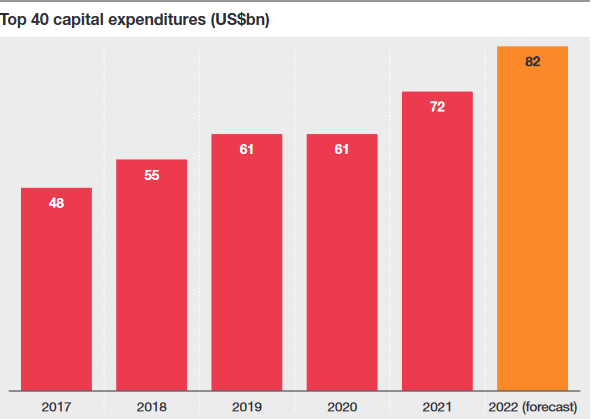
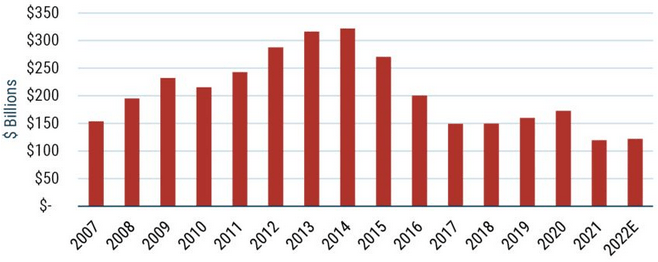
Industry Capex Remains Historically Low
In the last five years, industry capex has risen from $48 billion in 2017, to $82 billion in 2022. While, given our previous statements, this suggests that future returns may be low, this picture should be considered from a broader historical view.
Source: PwC
In their 1Q 2022 GMO Quarterly Letter, GMO noted that not only are resources increasingly scarce, driving commodity prices up some 500% in the last two decades, but underinvestment in supply has characterized the industry over the last decade. Underinvestment is due to declining or low prices in the last decade, and the scars of investor criticism that the industry had overinvested during the China-driven commodity supercycle. So, the decade is really a decade of aggressively reduced capex, despite consumption of major commodities rising by 40% in the last 15 years. Current capex levels are, therefore, insufficient to meet rising demand. GMO estimates that the current dislocation will lead to at least a decade of high commodity prices.
Source: GMO
Most observers believe that capex growth will decline in 2023. One thing driving this conservatism is that shareholders have seen their firms experience historic levels of profitability, and managers are under pressure to distribute cash to shareholders. Consequently, we’re unlikely to see the kind of capex growth the world needs to meet demand, and, therefore, the kinds of capex growth that drive the boom-and-bust cycle of the commodities sector. We have entered an era of greater share price stability and sustainable profitability.
It’s arguable that 2022’s rise in capex is justifiable given the global supply chain disruption, whereas previous increases were driven by miners chasing high prices. Even with the global supply chain disruption, miners have been more restrained than they were in the past. China’s commitment to a zero-COVID strategy makes it even less likely that we will see a big capex wave: Inflation masks soft demand from China, which argues against ramping up production.
McKinsey & Company’s analysis shows that cash generation from operations has improved markedly since the early 2000s. In the 2007 to 2012 period, cash from operations and equity and debt issuance was used to reinvest in the business. However, since the 2012-2016 decline in commodity prices, firms have reduced capex, fixed their balance sheets, and controlled costs. From 2016, miners have been, at the aggregate level, in rude financial health. While absolute capex has increased since 2016, relative to operating cash flows, capex remains modest. In other words, prudential capital allocation has characterized the industry in recent years. M&A activity has still not recovered to 2007-2012 levels.
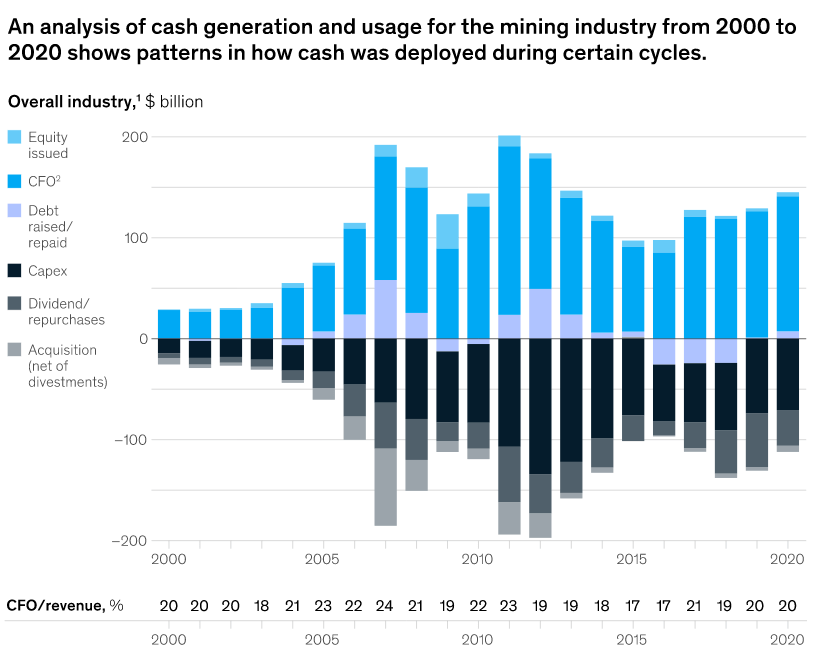
Source: McKinsey & Company
BHP’s Strong Financial Performance
Since (the financial year of) 2018, BHP has grown revenue from $43.638 billion to $65.098 billion in 2022, for a five-year compound annual growth rate (CAGR) of 8.33%. According to Credit Suisse’s The Base Rate Book, 24.2% of firms achieved a similar level of growth between 1950 and 2015.
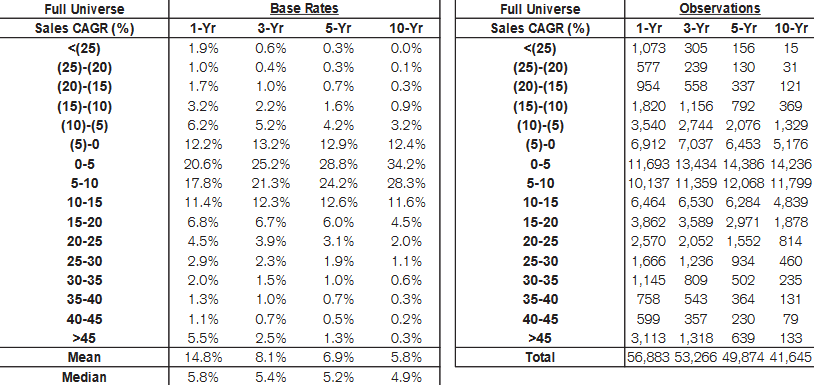
Source: Credit Suisse
Revenue emanates from iron ore, coal, petroleum, copper, natural gas, nickel and uranium. Iron ore is the biggest source of revenue, contributing around 47% of the group’s revenue. Copper accounts for around 26%, while coal contributes around 24% of the group’s revenues.
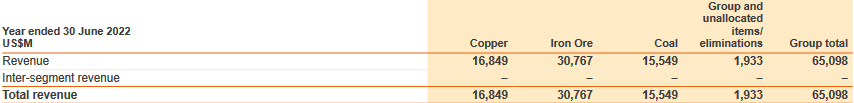
Source: 2022 Annual Report
Revenue expansion is a consequence of rising prices for iron ore, copper and coal. For example, in the same period, the global price of iron ore rose at a CAGR of 11.75% per year. Meanwhile, the global price of copper compounded by 26.78% a year. The global price of coal compounded by over 65% a year.
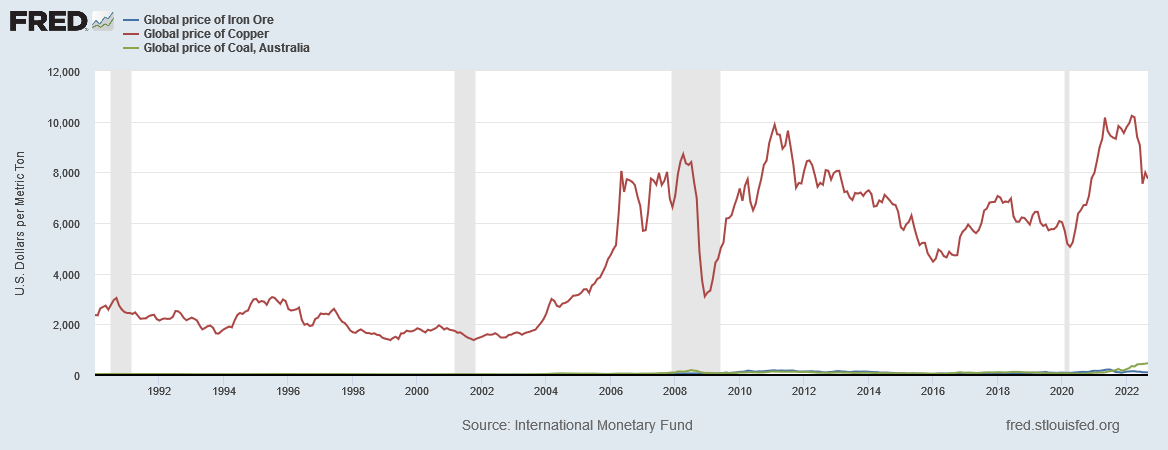
Source: FRED
Gross profitability from nearly 0.14 in 2018 to 0.34 in 2022, just above the 0.33 threshold that Robert Novy-Marx found makes a stock attractive. In that time, the company’s total assets have declined from nearly $112 billion in 2018, to over $95 billion in 2022. Seen in the light of rising commodity prices, BHP’s discipline in shrinking its asset base is remarkable.
Net income has risen $4.823 billion in 2018, to $33.055 billion in 2022, for a five-year net income CAGR of 46.95%. That gives a base rate of 1.7%, and shows the excellence of the company’s profitability.
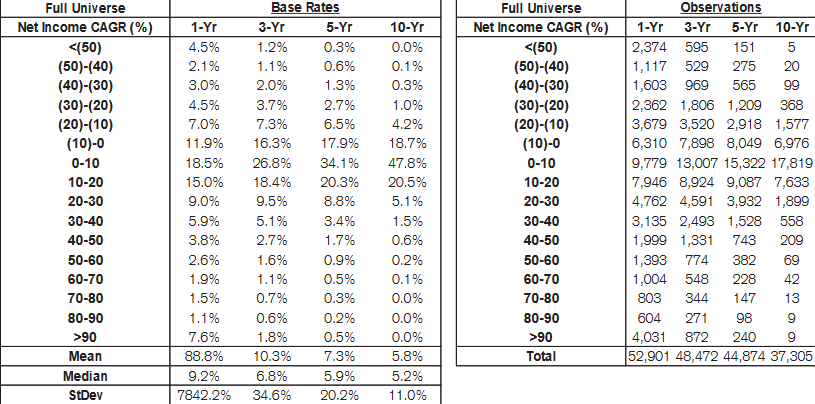
Source: Credit Suisse
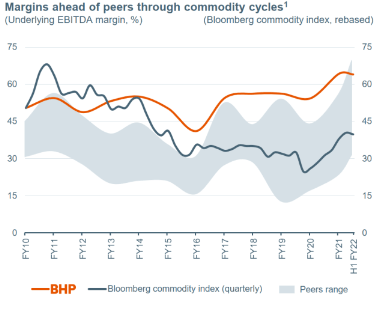
Underlying EBITDA, meanwhile, rose from $23.2 billion in 2018 to $40.63 billion in 2022, compounding at 11.84% a year. BHP’s underlying EBITDA margin improved from 55% to 65% in that period. The company’s margins have consistently led those of its peers.
Source: BofA Securities 2022 Global Metals, Mining & Steel Conference Presentation & speech
Profitability is further indicated by the rise in free cash flow, which has risen from $12.5 billion in 2018, to $25.215 billion in 2022.
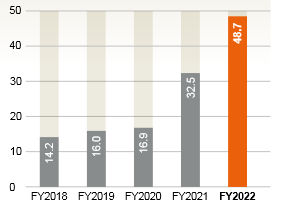
BHP reported an underlying return on capital employed (ROCE) of 14.4% in 2018, rising to 48.7% in 2022. This obviously indicates improving operational excellence, and widening competitive advantages.
Source: 2022 Annual Report
Management Interests Aligned With Shareholders
The firm’s Long-Term Incentive Plan is designed to align shareholder and management interests. It does this by using relative total shareholder return (TSR) as a measure of management’s performance over a sustained period of time. More pressingly for investors, the company uses ROCE to measure management’s CDP (cash and deferred plan) outcomes. Each year, management is given CDP targets. For the 2022 financial year, for example, management was set a target of 38.1% ROCE, with a threshold of 33.5% and a maximum of 42.0%. In this way, management’s efforts are directed at the very things that shareholders would like to see: The prudential deployment of the company’s cash.
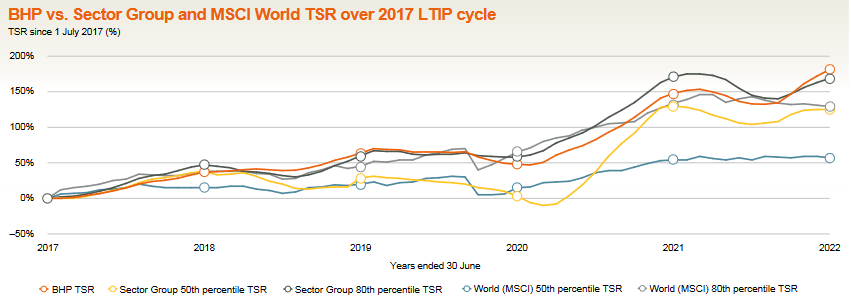
Management has succeeded in turning the company into a leader among its peers, with the company leading its sector group and the MSCI World TSR over the 2017 LTIP cycle.
Source: 2022 Annual Report
The Buy Signals
BHP has a price-earnings multiple of 6.69, while the S&P/ASX has a PE ratio of 23.8, and the S&P 500 has a PE ratio of 19.91. Not only is the company trading at an attractive relative valuation, its FCF yield (FCF/enterprise value) stands at 14.25%, which is very attractive when you consider that the FCF yield of the 2000 largest firms listed in the US is 1.5%, according to New Construct’s calculations.
Conclusion
BHP’s strong economic performance over the last five years is a reflection of the old adage that a rising tide lifts all boats. The underlying fundamentals of the industry have markedly improved, as an era of prudential capital allocation has taken hold. BHP is not just the passive beneficiary of the industry’s economic tailwinds, it has been a sector leader, leading in profitability thanks to a compensation scheme that links management’s interests to those of the shareholders.
Be the first to comment