

Diego Thomazini
This article was first released to Systematic Income subscribers and free trials on July 14.
One way to describe income investing is as an investment allocation that achieves a desirable level of yield while minimizing and avoiding unnecessary risks. In this article we take a look at two funds that allocate to high-yield corporate bonds with a shorter-duration profile. Because the corporate bond yield curve is pretty flat, these shorter-duration funds allow investors to earn a similar level of yield as longer-duration funds of similar quality.
In this article we take a look at the following two closed-end funds (“CEFs”):
- Barings Global Short Duration High Yield Fund (NYSE:BGH), trading at a 9.85% current yield and a 11.2% discount
- PGIM Short Duration High Yield Opportunities Fund (NYSE:SDHY), trading at a 8.6% current yield and a 11% discount.
There are other funds in the Limited Duration CEF sector. However, they tend to carry a higher floating-rate footprint (primarily via loans), leaving these two funds as more focused primarily on shorter-duration bonds.
The Corporate Bond Market Landscape
Over the last couple of months, we have highlighted two interesting facts about the income space.
The first obvious one is that, overall, corporate bond yields have shot higher and are trading at relatively attractive levels in the post-GFC period as shown below.
Systematic Income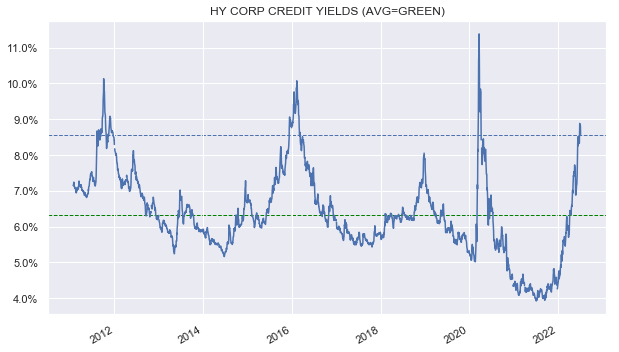
The second, perhaps, less obvious one is that the corporate yield curve has flattened as well. There are two key reasons for this. First, the Treasury yield curve (the 2s10s is shown below) has inverted on the back of rising recession expectations.
Systematic Income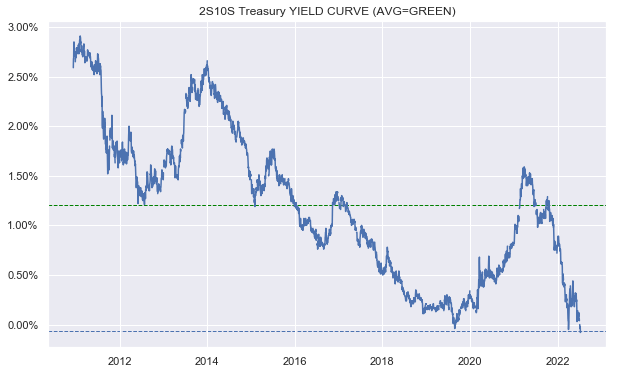
Plus, the high-yield corporate spread curve (i.e., the part of the corporate bond yield above the Treasury yield) tends to invert at levels of around 5%, i.e., shorter-maturity bonds tend to trade at a higher credit spreads than longer-maturity bonds when credit spreads rise above around 5%. The reason is somewhat technical and has to do with the fact that, as bonds of the same issuer get increasingly distressed, they converge to the same price (i.e., the expected recovery price) at which point, shorter maturity bond yields mechanically rise substantially above the yields of longer-maturity bonds.
The direct outcome of this is that currently shorter-maturity high-yield corporate bonds are trading at higher yields than longer-maturity high-yield corporate bonds.
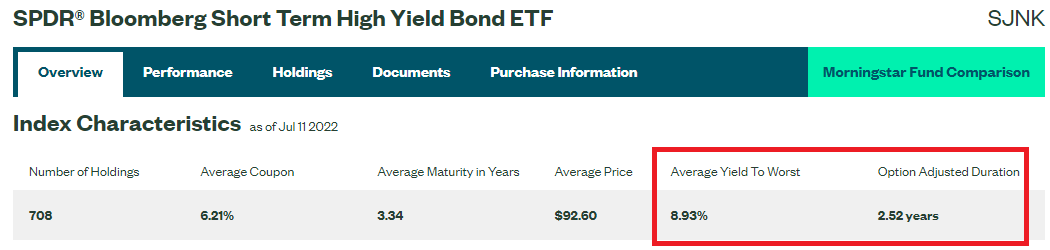
We show this using the two popular SPDR exchange-traded funds (“ETFs”), which have similar sector and rating profiles but different duration targets. The index underlying the shorter-duration SPDR Barclays Capital Short Term High Yield Bond ETF (SJNK) trades at a 8.93% weighted-average yield while that of JNK trades at a 8.5% yield. This is despite the fact that SJNK duration is 40% lower than that of SPDR Bloomberg Barclays High Yield Bond ETF (JNK).
SSGA SSGA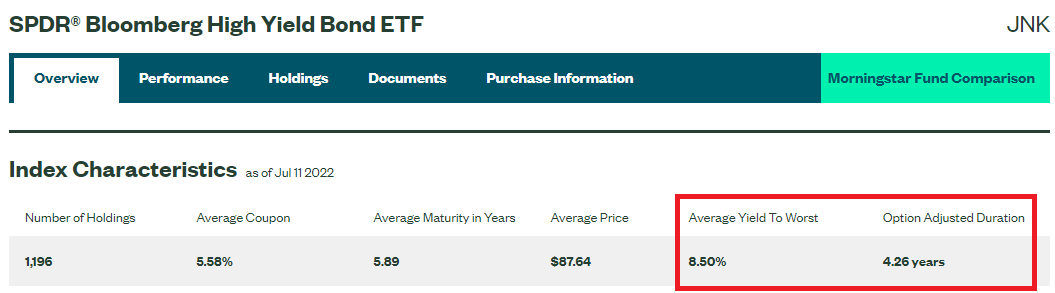
As we would expect, the shorter-duration profile of SJNK means it is less sensitive to rises in interest rates. However, and this point is often missed, it is also less sensitive to rises in credit spreads (even if short-maturity credit spreads rise by a larger amount when the corporate bond yield curve inverts as highlighted above). This lower-beta nature of the lower-duration SJNK means it has outperformed both JNK as well as the high-yield CEF sector.
Systematic Income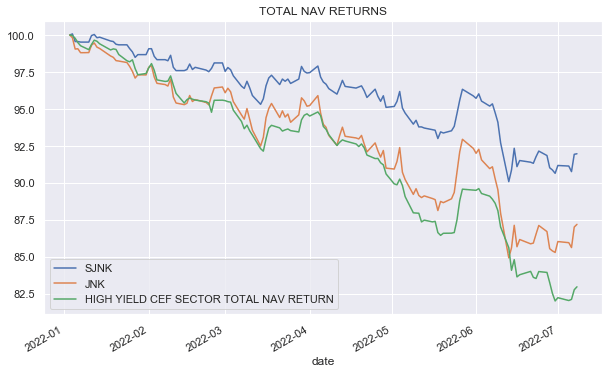
In our view, there is a strong argument for taking more duration risk at current levels because longer-term interest rates are likely to fall if the recession strikes, supporting longer-maturity bonds. However, not all investors will find this a compelling enough argument to take duration risk. Many will simply want to maximize their yield while minimizing their sensitivity to further rises in interest rates or credit spreads.
The takeaway here is that investors who are worried about further rises in rates or credit spreads may simply want to shorten up their duration profile. An obvious response here is if you want to shorten up on duration, why not just hold loans? However, while loans have no duration, they can have a higher sensitivity to credit spreads than shorter-maturity corporate bonds due to their overall longer maturities, so they are not always a slam dunk.
BGH vs. SDHY
Let’s see how these two funds compare on a few key metrics. Some of the key figures are shown below.
PGIM Barings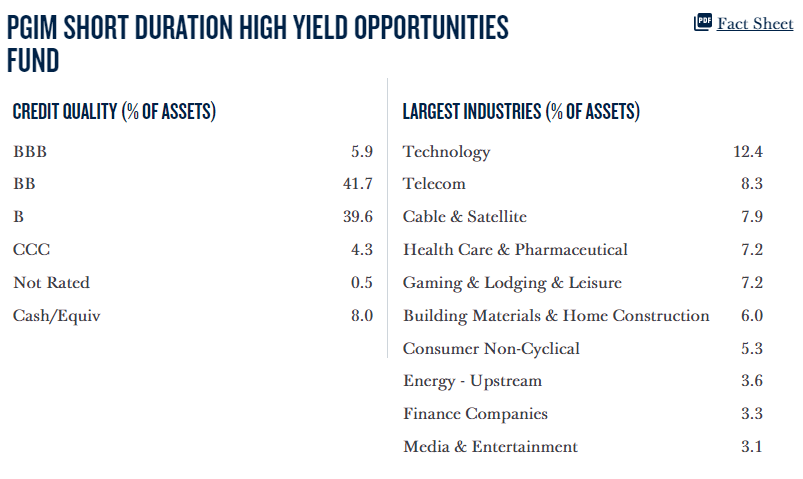
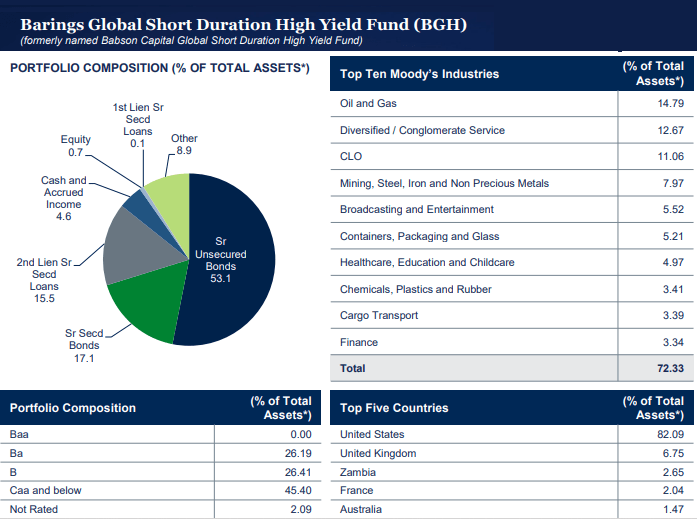
SDHY has a significantly higher-quality profile with only 4% of the portfolio in CCC-rated assets, while BGH has 45% of the portfolio in CCC-rated assets.
In terms of sector profile, SDHY is overweight Tech, Telecom and Healthcare while BGH is overweight Energy and Mining sectors.
In terms of allocation, BGH has a higher loan allocation with 10% in CLO Debt and another 15% in loans. SDHY has only about 5% in loans. On the other hand, SDHY has about a 10% allocation to Emerging Market sovereign bonds while BGH is more of a developed-market bond fund. Both funds have leverage around 25% – relatively low for credit CEFs.
SDHY has a duration of 2.9 vs. 2.6 for BGH. This is less than half of the typical duration of High-Yield CEF sector bonds.
In terms of performance, SDHY is ahead this year with a -10.7% total NAV return vs. a -15.7% drop for BGH (vs. a -17% average drop for the HY bond CEF sector). On a 1-year basis, however, the returns are more similar: -9.4% for SDHY vs. -12.9% for BGH. If we look at since-inception figures from late 2020 (when SDHY was launched), BGH is ahead at -5.1% versus -7.3%. BGH is clearly a higher-beta fund than SDHY as the following chart shows which aligns with its lower-quality profile.
Systematic Income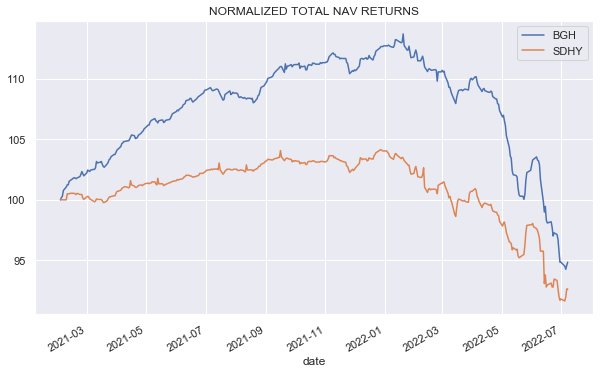
In terms of longer-term performance, BGH has delivered a 1% 5Y total NAV return which is in line with the limited duration sector and about 0.3% below the High-Yield CEF sector – a reasonable level of underperformance for its lower-duration profile as, historically, lower-duration funds have also tended to earn lower yields, all else equal.
In terms of income, we can say the following. SDHY has earned a NAV net income yield of around 6.25% in this fiscal year i.e. a coverage of 84%. BGH has generated a NAV net income yield of 11.83%, i.e., a coverage of 136%.
The real yields of the two funds are actually closer to each other than these numbers imply, though BGH still has a significant advantage. This is because SDHY leans to lower-coupon bonds in its allocation, which lowers its current yield, understating its weighted-average yield-to-worst. The consequence of this is that SDHY will earn more yield in pull-to-par than BGH because the weighted-average price of its holdings is very likely to be lower.
The NAV investment income yield of the two funds is also below their weighted-average yield-to-worst (which we sometimes call portfolio yield). This is a common feature of high-yield bond funds at the moment given the average high-yield corporate bond price is well below par. For example, the JNK current yield is 6.44% while its yield-to-worst is actually 8.5%. The difference is explained by the fact that the pull-to-par of the $87 average bond price is not taken into account in the current yield calculation (which is simply coupon / price). This yield calculation makes sense for a perpetual non-callable instrument but not for a corporate bond, particularly when the average price is away from par.
Both funds appear to have deleveraged somewhat recently. SDHY borrowings have decreased around 17% as of July vs January. BGH has shed around 25% of its borrowings as of May relative to December.
In terms of income direction, the recent deleveraging will be an income headwind for both funds. The rising leverage cost will also be a headwind for both as both funds pay 1M Libor + 0.75% on their credit facilities. However, BGH holds a similar amount of floating-rate assets as floating-rate liabilities, which means that its income level will be much less impacted by rising short-term rates than SDHY which holds few floating-rate assets. Overall, BGH should be able to maintain its high level of coverage and see a lower erosion in its income over the medium term.
In terms of valuation, the two funds have traded at similar discounts for quite a while. The discounts are wider of both the limited duration CEF sector as well as the High-Yield CEF sector by a significant margin, making them fairly attractive.
Systematic Income CEF Tool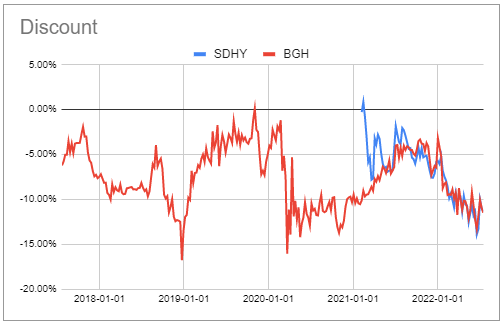
Takeaways
To sum up, the allocation profile of both funds is quite attractive at present as they take advantage of both the high yields in the corporate bond space as well as the fact that the corporate yield curve is flat / inverted. This allows them to generate a high level of yield while keeping duration relatively low.
BGH has a lower-quality profile, which means it is a higher-beta fund than SDHY. However, this also results in its ability to generate a higher level of yield. The overall income trajectory of BGH should also hold up somewhat better given its higher floating-rate allocation.
With valuation at very similar levels, the allocation decision really comes down to the yield / risk profile. Investors with a more constructive take on the corporate credit market will lean to BGH and vice-versa. It’s also, of course, not out of the question to diversify somewhat and hold both funds.
Be the first to comment