

adaask
Both Antero Midstream (NYSE:AM) and ONEOK (NYSE:OKE) are high-yield midstream businesses. AM has a higher dividend yield, whereas OKE has a stronger credit rating.
In this article, we will compare them side by side and offer our take on which one is a better buy.
AM Vs. OKE – Balance Sheet
AM’s balance sheet is inferior to OKE’s as evidenced by its junk credit rating (BB from S&P) compared to OKE’s BBB credit rating. That said, AM is focused on strengthening its balance sheet by using retained cash flows to pay down debt instead of growing its dividend or buying back shares. While it has struggled to reach cash flow neutrality (net of dividends) in recent quarters due to its significant capital expenditure requirements, it has finally reached that inflection point and should be generating considerable and increasing amounts of free cash flow moving forward. It plans to dedicate all of it net of dividends towards paying down debt, with the goal of reducing its leverage ratio from 3.6x to below 3.0x by the end of 2024. Furthermore, its primary counterparty expects to achieve an investment grade credit rating soon as well. Once it achieves its deleveraging plans and its counterparty’s balance sheet becomes investment grade rated, AM should see a significant upgrade from credit ratings agencies and perhaps become investment grade rated itself.
OKE’s credit rating implies that there is little risk of financial distress in its foreseeable future. That said, management admitted on its latest earnings call that it wants to reduce leverage in order to reach its long-term aspirational range of 3.5x or lower (it is currently at 3.8x). Overall, however, we give OKE the edge here given its significantly stronger credit rating.
AM Vs. OKE – Business Model
AM’s asset portfolio is quite small, but its fully integrated value chain structure and competitive positioning results in a stable cash flow profile. Furthermore, it operates in the lowest cost natural gas basin in the United States, with 85% of its business focused on natural gas processing and gathering and 15% is focused on a water business. The biggest risk facing AM is that virtually all of its assets service a single counterparty (Antero Resources (AR)). While AR is rapidly deleveraging its balance sheet and is gushing free cash flow at the moment, if it were to fall on hard times, it would seriously jeopardize the financial welfare of AM as well. As long as AR remains in good shape, however, AM should be in very strong shape as well.
OKE, meanwhile, possesses a very robust set of natural gas and NGL assets and generates all of its EBITDA from these two segments. Over the past decade, OKE has generated distributable cash flow per share growth every year except for a fairly modest 10.1% decline during the energy market crash of 2020.
Given that ~90% of OKE’s earnings are fee-based, a whopping ~85% of its counterparties are investment-grade, and it has no unhedged commodity price exposure, OKE generates near utility-like cash flow stability. As a result, OKE wins this competition hands down due to its greater scale, impressive cash flow stability, and very strong and better diversified counterparties.
AM Vs. OKE – Dividend Safety
Consensus analyst estimates for 2022 and 2023 put AM’s distributable cash flow dividend coverage ratio at 1.54x this year and 1.62x in 2023. Meanwhile, OKE’s distributable cash flow dividend coverage ratio is expected to be 1.63x in 2022 and 1.77x in 2023. As a result – especially when factoring in its stronger balance sheet and business model – OKE gets the edge here as well.
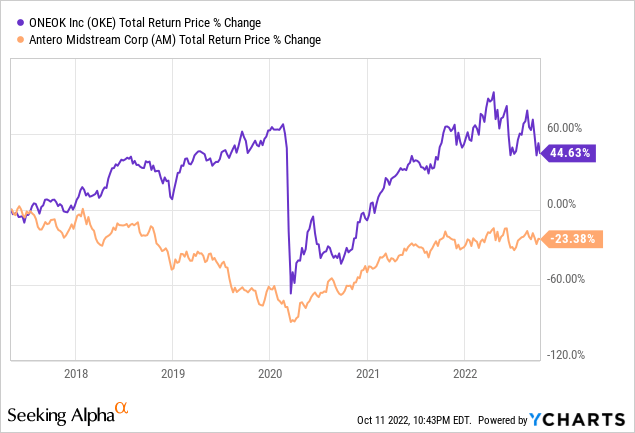
AM Vs. OKE – Track Record
When it comes to track record, OKE has significantly outperformed AM, giving it the clear edge in this category:
AM Vs. OKE – Risks And Catalysts
AM and OKE both face very similar risks and catalysts given that they are in the same industry. As midstream businesses with pretty strong counterparties, their near-term cash flow profiles are quite predictable and stable.
Both do have some longer-term energy price exposure, particularly in the natural gas space since that is what both concentrate on and neither has direct exposure to the oil sector. OKE is investing more aggressively in growth opportunities at the moment as AM is primarily focused on reducing debt moving forward. As a result, OKE is a bit more sensitive to swings in the industry from a return on incremental invested capital standpoint at the moment, though its more conservative balance sheet and business model positioning offsets this risk.
AM Vs. OKE – Valuation
When it comes to their relative valuations, AM looks clearly cheaper across each of the primary midstream valuation metrics. As a result, we give AM the definite edge on this metric.
|
Valuation Metric |
AM |
OKE |
|
Dividend Yield |
9.3% |
7.1% |
|
Dividend Yield (5-Yr Avg) |
11.9% |
6.9% |
|
EV/EBITDA |
8.7x |
9.9x |
|
EV/EBITDA (5-Yr Avg) |
12.1x |
12.4x |
|
P/DCF (2022) |
7.1x |
8.8x |
|
P/DCF (2023) |
6.7x |
8.1x |
Investor Takeaway
This ultimately comes down to a question of value vs. quality. AM is clearly cheaper on both a dividend yield and an EV/EBITDA and P/DCF basis. Furthermore, it is expected to grow distributable cash flow per share at an 8.9% CAGR through 2026 on top of its attractive current dividend yield.
Meanwhile, OKE is much pricier, though its valuation has pulled back recently to make its valuation a bit more compelling. However, its growth profile is still considerably slower than AM’s with a 3.1% distributable cash flow per share CAGR expected through 2026.
That said, OKE’s business model, balance sheet, dividend safety, and track record are all vastly superior to AM’s.
We rate both Buys at the moment. AM has greater upside potential given its stronger current yield and growth potential, while OKE is much lower risk given its superior credit rating and very impressive asset portfolio and counterparty strength. Investors might be best served by owning both in order to get a combination of OKE’s lower risk and AM’s higher total return profile.
Be the first to comment