

gopixa
The July payrolls report delivered a surprisingly strong +528k jobs added, well above expectations for just 250k. The initial market reaction on Friday was a selloff in stocks with bond yields spiking based on a line of thinking that the report will keep the Fed hawkish. On the other hand, it’s telling that the market staged a rally with the S&P 500 (SPY) closing nearly flat on the day, capping off a small gain for the week. In our view, the jobs number goes a long way to brush aside fears of an apocalyptic recession or pending surge in the unemployment rate.
The evidence is that despite higher interest rates and challenging inflation, the economy remains resilient which, in our view, outweighs the implications of the report on Fed policy. What’s more encouraging are several indications of inflation set to trend lower driven by a sharp drop in energy prices as economic conditions rebound. This dynamic likely explains the main driver of the rally in risk assets over the last few weeks in an ongoing shift of more positive market momentum.
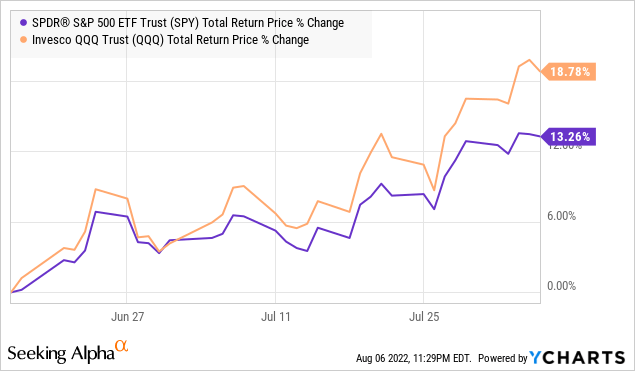
The way we see it, the bears are waiting for an economic collapse that simply doesn’t exist. Any call for stocks to crash lower over the last several weeks must contend with the fact that the S&P 500 is trading near a 3-month high and is currently up 14% from its June low. The NASDAQ-100 (QQQ) has been more impressive, clawing back 19% since June with a general theme of growth and tech outperforming. We’ve been running with this theme and expect more upside.
The Bear Case For Stocks is Falling Apart
We’ve seen it all in terms of reasons why some believe the stock market is doomed, including conflicting scenarios between a 70s-style stagflation nightmare and a pending 30s-style deflationary depression. Make up your mind already.
The bearish case for stocks largely centers on a view that the Fed is in a futile race to catch up with runaway inflation, being forced to hike rates into a deteriorating economy. Naturally, the next stage would be for a collapse in corporate earnings leading to a surge of unemployment and sharply lower stock prices. The problem here is that as we move further into Q3, it’s clear that this story isn’t playing out.
Inflation Has Peaked
The view that inflation has peaked is no longer controversial. Commodity prices across energy, metals, and agriculture are sharply lower from their highs which directly translate into lower input costs. Companies complaining about logistical and infrastructure bottlenecks are getting some breathing room on the production side which is good news as the impact feeds through the CPI. The trends here are a far cry from calls that inflation is out of control. Case in point, the price chart of WTI crude oil (USO) tells the story, down nearly 30% from its high.
finviz.com
Looking back at the initial Russia-Ukraine invasion headlines, or even when the national average for a gallon of gasoline hit a peak of $5.01 on June 14th, few would have predicted the plunge in gasoline prices in recent weeks. According to the industry publication “GasBuddy“, the national average for a gallon of gas has dropped sharply to $4.10, forecasted to trend under $4.00 over the next few weeks while some of the cheapest stations in the country may be seen selling a gallon of gas for under $3.00. This is important because it has major implications for the CPI through lower energy costs either directly or from secondary effects.
Twitter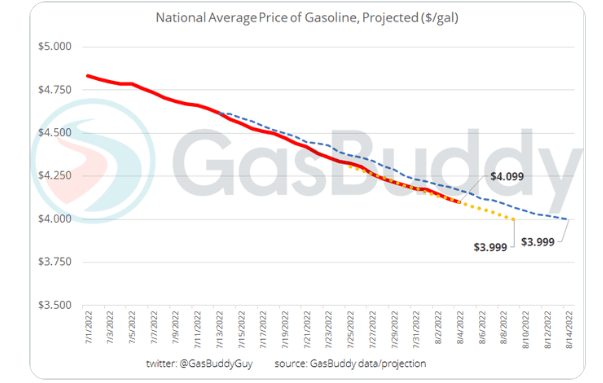
The latest climate change/tax reform bill moving forward in Congress titled “The Inflation Reduction Act of 2022″ likely has little impact in the near term on the CPI, but our take is that the incentives towards renewable energy and even electric vehicles further help to improve the long-term inflation outlook.
The key here is to recognize that a trend of lower inflation going forward is not a result of a “demand destruction” or even the effects of the recent Fed rate hikes, but includes some easing or normalization of what were major supply chain disruptions in most industries. As it relates to gas prices, data shows consumers cut back on driving amid the record prices, but producers also took the step of increasing output to capitalize on the high prices.
While we don’t expect a straight line lower in oil or gas, a sense of stability here is a welcomed turn of events. A market equilibrium for oil under $100 barrel is something the economy can work with. It’s not just gas prices. Another encouraging development has been all the reports of major retailers moving to discount inventory as a downward pressure on consumer goods pricing. Other headlines that food prices are dropping at the “fastest pace since 2008” is also a positive development.
Investors can look forward to the July CPI report this week on Wednesday, August 10th where the current consensus is for an 8.7% y/y print, down from 9.1% in June. A confirmation that inflation can trend lower over the next few months should be very positive for risk assets.
Macro Conditions Improving
It’s fair to say that economic indicators have been generally mixed between the strong labor market conditions evident by this last non-farm payrolls report against the negative Q2 GDP print, confirming a “technical recession”. There is also the record low consumer sentiment even as consumer spending came in stronger than expected in June.
The key here to recognize is that some of these soft spots are backward-looking while the “leading indicators” end up being influenced by the historical data. For us, it goes back to that cooling inflation outlook. A lower CPI this week should go a long way to helping improve consumer sentiment as one of the most positive developments.
Trading Economics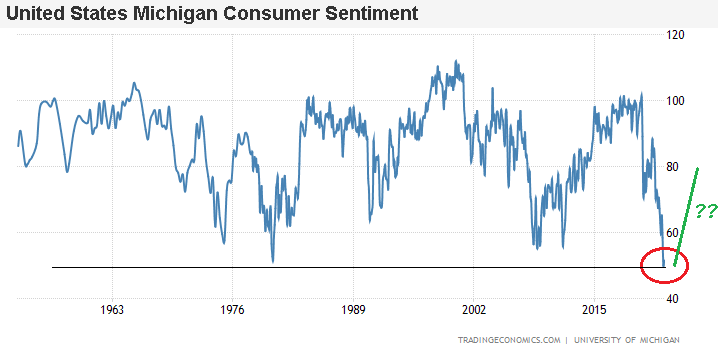
The insight we offer is that the drop in gas prices supports stronger economic activity both in the U.S. and globally. Consider that the U.S. consumes an estimated 349 million gallons of gasoline per day. Connecting the dots, the near $1 drop in the national average over the past eight weeks translates into a savings of $349 million per day or $10 billion over a month for the overall economy. This ends up working as a mini-stimulus with millions of consumers each saving $10-$20 filling up a gas tank that helps balance other discretionary spending categories.
The takeaway here is that there is room for macro data to turn higher and surprise to the upside. The bears sort of need another shoe to drop in the macro picture which we don’t see happening.
The Fed’s Strategy May Actually Work
Our call is that the Fed’s plan to engineer a “soft landing” where inflation cools while the economy generates better than expected data can be very bullish for stocks. Whether the Fed funds rate ends the year at 3.5% or 5%, the important point is that economy doesn’t need to crash as the bearish case in stocks contends.
Chairman Powell has already said the policy is data-dependent, and in this case, the data may be on their side. The Fed can deliver another 75 or 50bps hike at the next September meeting, but this won’t be a problem if the labor market continues to add jobs and inflation trends lower. The reality is that there is no rule written in stone where higher interest rates must destroy the economy and crash the stock market.
While Q1 and Q2 GDP were weak, the setup for a stronger second half with inflation trending lower and improving consumer sentiment is a more positive development. Stocks should benefit from a “recovery” narrative driving an expansion of multiples. If we’re correct that inflation trends lower, it gets more interesting into 2023 when further tightening is no longer required putting the Fed at neutral.
Again, it’s not that “prices” are ever going back to 2019 levels, but simply that the rate of change in annual inflation will slow through 2023. From the 9.1% level in June, an outlook for the CPI closer to 4% by this time next year is all the Fed needs to claim victory. Hiking the Fed funds rate into infinity may not be necessary to achieve this goal, regardless of what the labor market is doing.
An important signal we’re watching is a narrowing of credit spreads in recent weeks. Fixed income markets demanding a lower yield premium over Treasuries imply that the general risk of companies defaulting has declined. While levels are still elevated compared to 2021, the signal here is towards stability in both financial conditions and the economy.
St. Louis Fed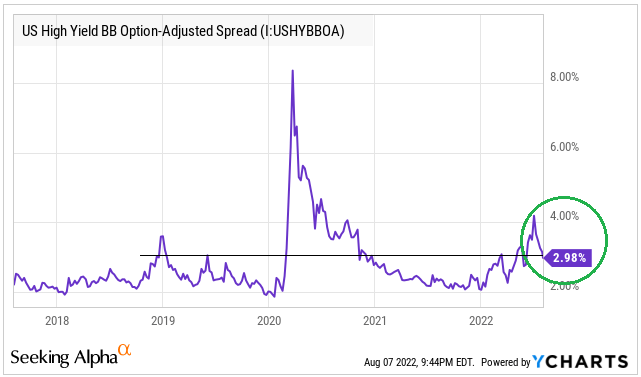
Strong Earnings
It’s well recognized that earnings growth is one of the main drivers of stock market performance. In this regard, the bears have a problem because earnings keep climbing. We’re a few weeks into Q2 earnings season and the takeaway thus far has been that companies, by and large, are successfully navigating the current environment.
With 87% of S&P 500 companies already reporting, the data shows that a whopping 75% of companies ended up beating the consensus EPS estimate for the quarter. While the average earnings growth rate of 6.7% was the lowest since Q2 2020, during the depths of the pandemic, keep in mind that the results this year were against a historically strong Q1 2021. Spin it the way you want, but there is no sign here of a pending crash in operating or financial conditions for major corporations.
FactSet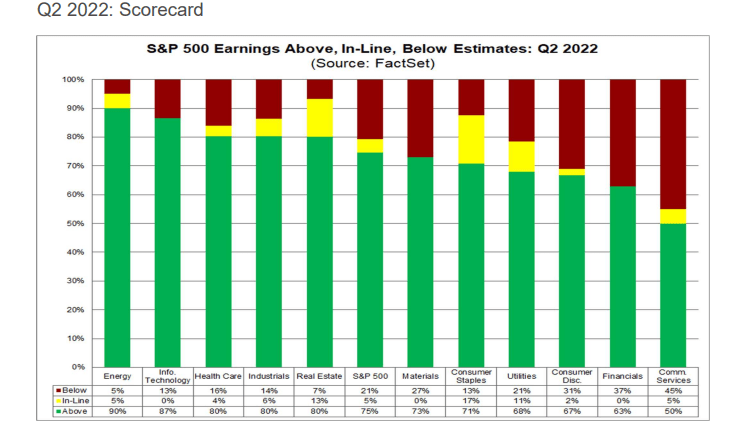
The current consensus is for 2022 S&P 500 bottom-up EPS to climb 9% from 2021 to $227.27, as an aggregate of all companies in the index. For 2023, the outlook is for earnings to climb another 8%. Any call for the stock market to crash lower nearly requires these estimates to be drastically wrong, and end up significantly lower. We don’t see that happening. The bears were wrong in Q2 earnings and may end up being wrong again over Q3 and Q4 with room for margins to improve based on lower cost pressures.
FactSet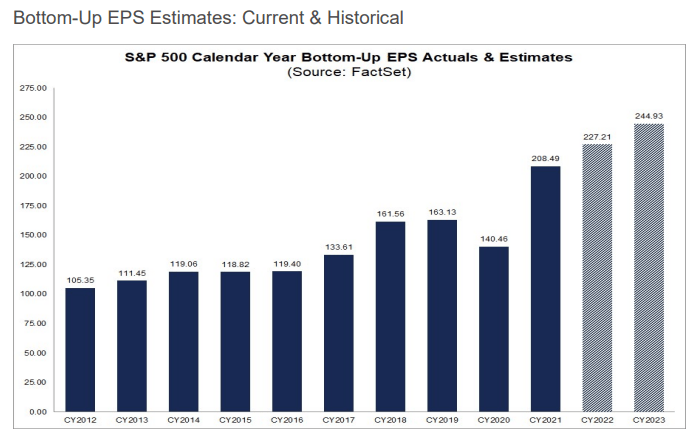
The other point here is on valuations. The S&P 500 is trading at an 18x forward P/E multiple based on the consensus 2022 EPS, or 17.5x on forwarding 12 months’ earnings. While a case could have been made that stocks were “expensive” in 2021, the silver lining of the selloff over the past year has helped to balance market premiums. We see value in equities at the current level which can benefit from some multiple expansions as macro conditions improve.
FactSet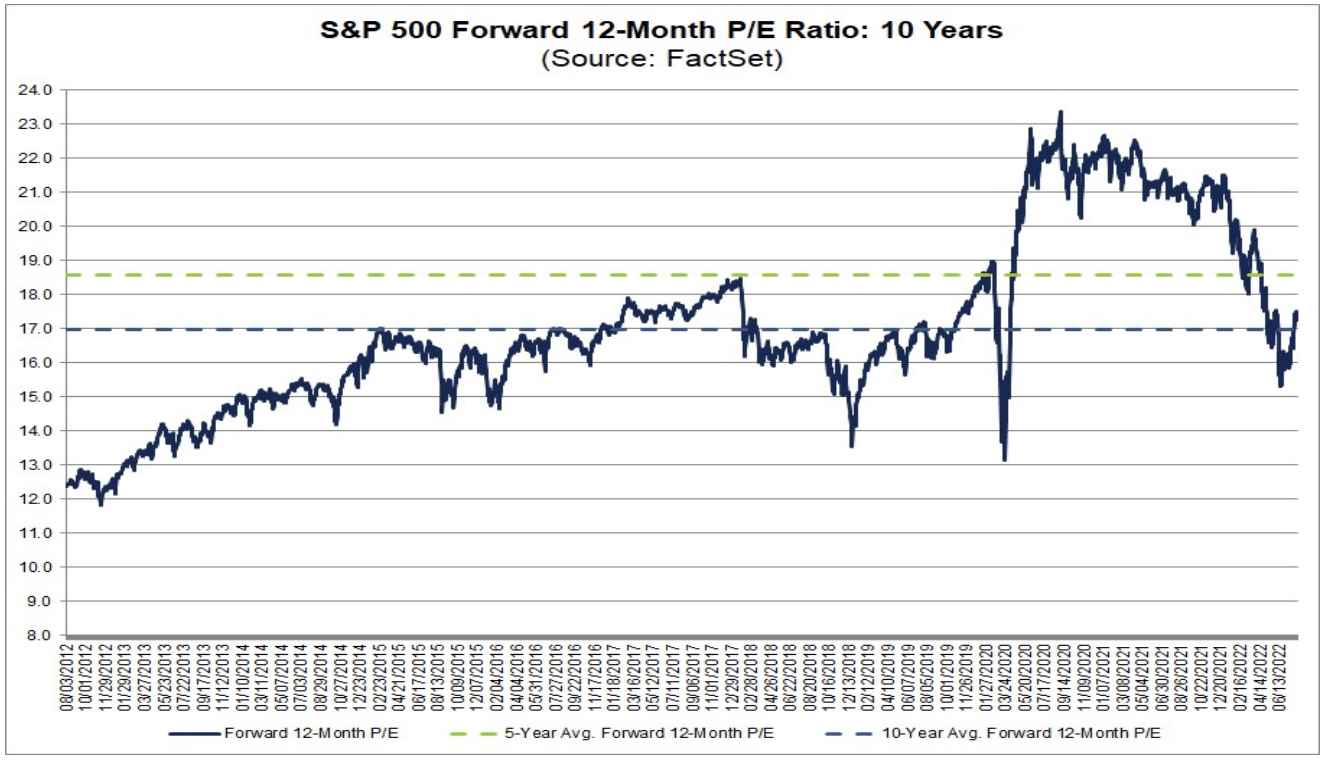
What’s Next?
Anyone short stocks or even waiting on the sideline for a new low needs to be sweating heading into the July CPI report. Recognizing that inflation is a bigger problem than rising interest rates, a “cold” inflation print this week would crumble one of the main talking points in the bear case for stocks, while also working as a catalyst for the next leg higher.
The S&P 500 is approaching a critical resistance level at 4,200 with a breakout higher placing the bulls firmly back in control and supporting a more sustained rally higher. We reiterate our call for the S&P 500 to end the year at 4,500.
finviz.com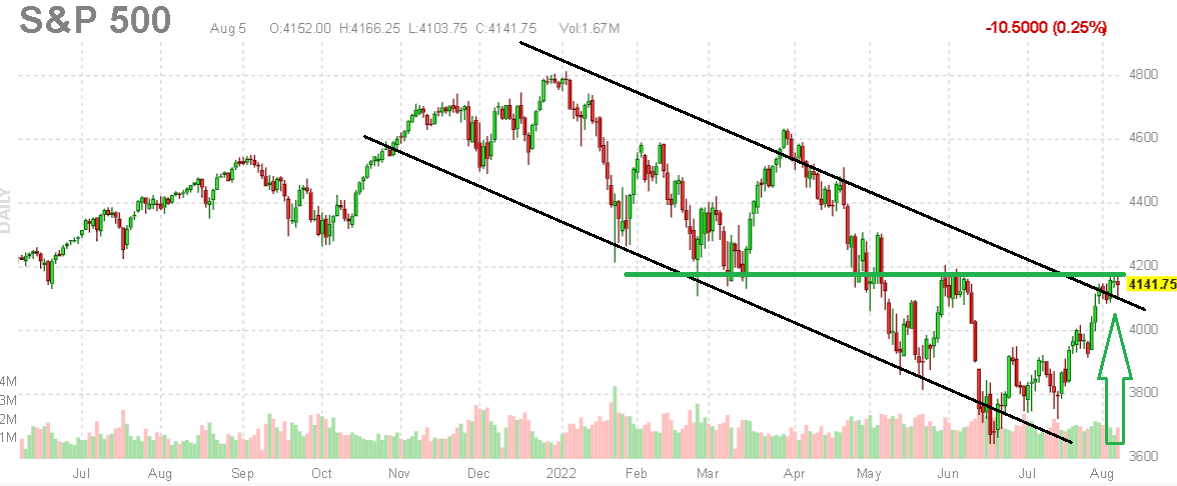
There’s always room to touch on risks to our forecast. The white elephant in the room remains the Russia-Ukraine conflict that remains volatile. An escalation into Europe would throw the macro outlook out the window. Sharply higher energy prices, which we would say is oil above $120 a barrel, could also lead to a resurgence of inflation and undermine the current outlook.
Be the first to comment