

shapecharge/iStock via Getty Images
This article was first released to Systematic Income subscribers and free trials on June 18.
Welcome to another installment of our BDC Market Weekly Review where we discuss market activity in the Business Development Company (“BDC”) sector from both the bottom-up – highlighting individual news and events – as well as the top-down – providing an overview of the broader market.
We also try to add some historical context as well as relevant themes that look to be driving the market or that investors ought to be mindful of. This update covers the period through the third week of June.
Be sure to check out our other Weeklies – covering the Closed-End Fund (“CEF”) as well as the preferreds/baby bond markets for perspectives across the broader income space. Also, have a look at our primer of the BDC sector with a focus on how it compares to credit CEFs.
Market Action
BDCs had the worst week of the year with a -8% weekly return. Underperformers were some of the weakest BDCs such as FCRD and MRCC but also previous high-fliers such as CSWC and TPVG.
Year-to-date all BDCs are in the red with a total return of around -15%.
Systematic Income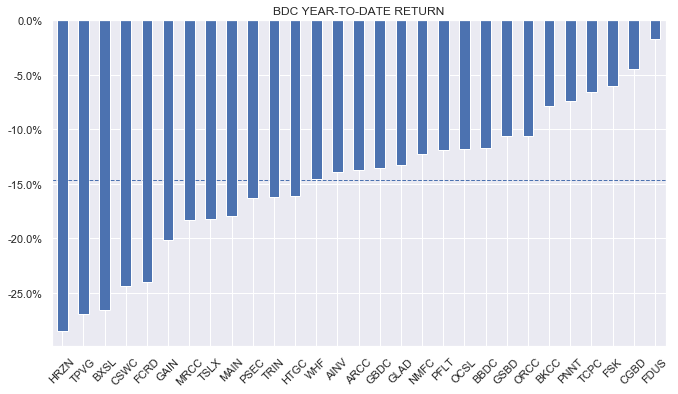
This year is evolving to be the worst year for BDCs (as for many other income assets) since the GFC. Overall, however, investors who bought at the end of 2020 are still likely sitting on solid gains.
Systematic Income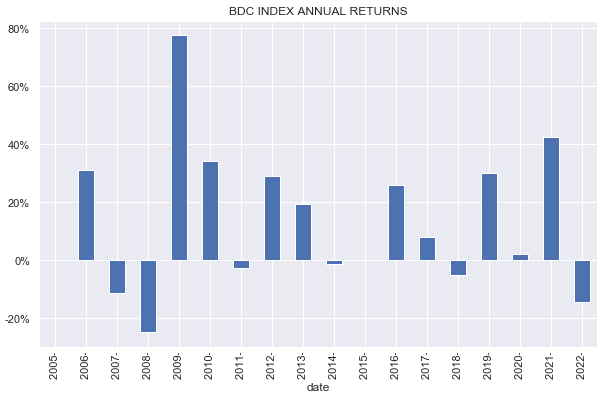
The sector is down about 22% from its peak though it remains above its pre-COVID level.
Systematic Income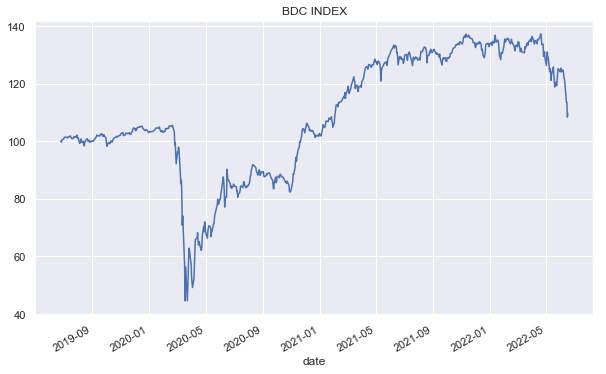
The average trailing twelve-month dividend yield is now north of 11% – it has only been significantly higher during exceptional periods such as the GFC, the Energy shock and the COVID shock.
Systematic Income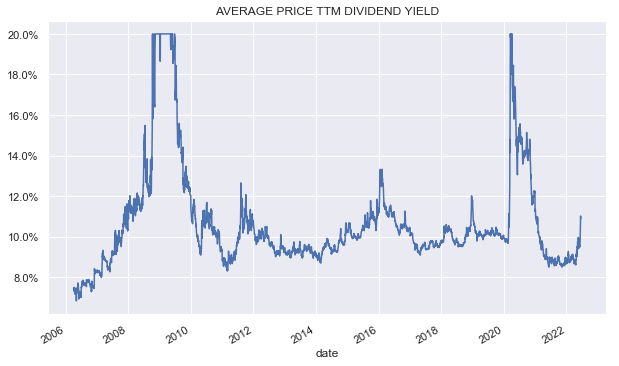
This is the third month in a row for negative returns in the sector.
Systematic Income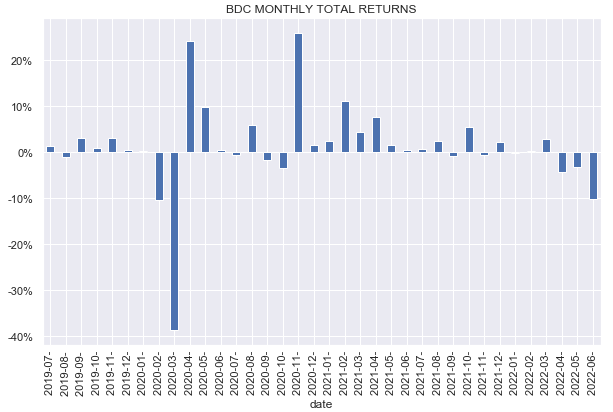
The average sector valuation (in our 29-name coverage universe) sits at 87%, roughly matching the level of the height of the Euro crisis in 2012 and not far off the Energy shock of 2015. Interestingly, the current valuation is also tracking the previous Fed-related tantrum in 2018 which bottomed around 80%. It’s important to note, however, that current valuations are all relative to Q1 NAVs and Q2 NAVs are likely to be lower. This means that current valuations are somewhat understated i.e. lower than they would be based on likely Q2 NAVs.
Systematic Income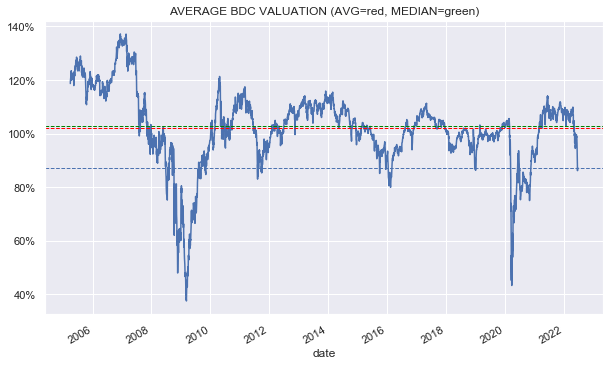
Market Themes
In this section we highlight a couple of BDC allocation strategies that appear to be common but are unlikely to outperform in the longer-term in our view.
One strategy is what is commonly called a value trap strategy that allocates to BDCs primarily on the basis of valuation. For instance, a recent headline stated that the BlackRock Capital Investment Corp (BKCC) is an “average” BDC at a cheap valuation.
In fact, there is nothing average about BKCC when we look at its ability to generate wealth for investors. It is the worst performer across 3Y and 5Y horizons in total NAV return terms of the BDCs in our coverage.
Systematic Income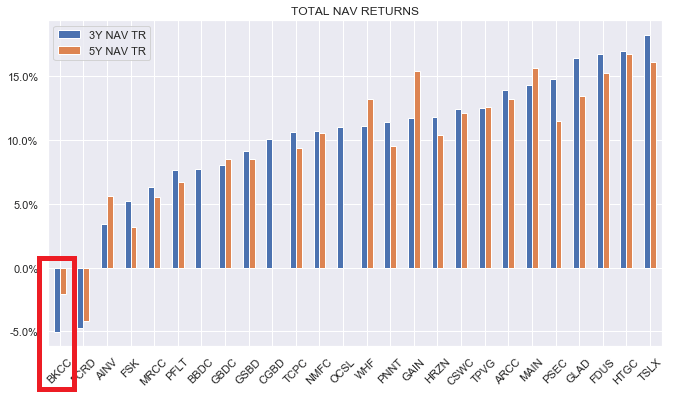
Granted, gauging total NAV returns can be quite tricky in the BDC sector which is why you don’t often hear about it in BDC commentary but it’s essential to avoid value traps like BKCC.
The other strategy that is likely to underperform in our view, though to a smaller extent, is buying strong-performers without regard to valuation. The problem here isn’t that these BDCs deliver poor total NAV return – they typically outperform the sector. However, their elevated valuation is totally out of line with how much outperformance they have delivered in total NAV terms historically.
For example, BDCs like CSWC and HRZN spent much of 2021 trading at silly valuations of 150-170% which was around 40-60% above the sector average.
Systematic Income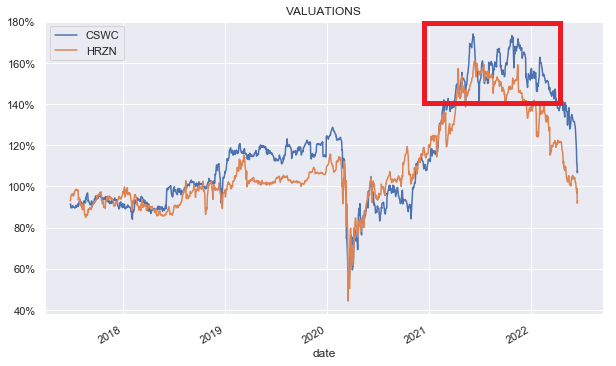
This is despite delivering performance that was only 0-20% above the sector average level over the past 3-5 years in total NAV terms (and lower more recently).
Systematic Income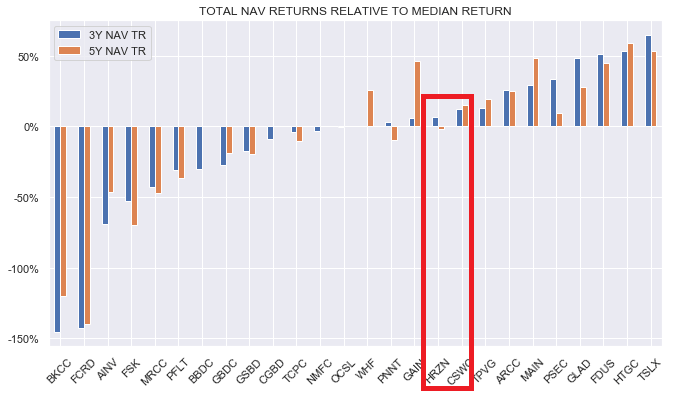
In short, once valuation is taken into account, these BDCs typically deliver a lower return on investor capital than the sector average. Higher-valuation BDCs also tend to be priced for perfection and see significant valuation compression in periods when not everything lines up perfectly, such as 2022.
In our view, avoiding value traps and making sure that the valuation investors pay are justified by a similarly high or even higher total NAV outperformance can increase the likelihood of investors reaching their investment goals in the sector.
Market Commentary
Trinity Capital (TRIN) raised its regular dividend by $0.02 to $0.42. In addition to the quarterly $0.15 special (scheduled each quarter for the remainder of the year) that comes out to an annualized yield of 15.91% based on a $14.33 price as of this writing. At that price the stock is trading at a 95% valuation on Q1 NAV. Q2 NAVs are likely to be lower. However, at least for TRIN, the dividend increase suggests it’s probably not a horror show.
Like TRIN, TriplePoint Venture Growth is another venture debt style BDC. These BDCs have all fallen significantly this year. For instance, HRZN is down 25%, HTGC down 16%, TPVG down 26%. This is versus a 11% median drop for the sector. TPVG valuation (on Q1 NAV) is 90% – about 3% above the average sector valuation. TPVG spent 2021 trading at valuations of 120-140% or about 10-20% the sector average. Given its valuation has collapsed does it offer value at current levels?
Systematic Income BDC Tool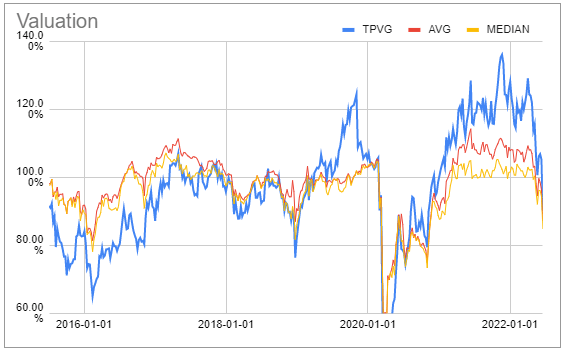
This one is not all that obvious. If we look at its quarterly NAV performance we see that it did really well from 2017 to 2020 but has kind of fizzled since then. For instance, it underperformed the sector in 6 of the last 7 quarters.
Systematic Income BDC Tool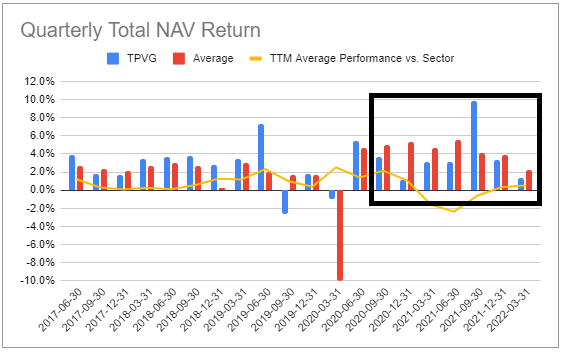
The reason it’s doing OK in absolute terms is that the one other quarter was fantastic which made up for the rest of the underperformance. That said, it’s hard to have a lot of conviction in this kind of performance profile.
The other risk is that a venture debt BDC like TPVG is more likely to underperform in the environment when private equity activity is muted and stocks are weak. TPVG has a relatively high equity / warrant footprint at 14% of the portfolio versus a median level of 6% in the sector. Given the current weak trading environment may last for another year if we do indeed enter a recession in 2023 as many analysts now expect, we are likely to see better entry points in TPVG.
Stance & Takeaways
This is how BDC valuations have shifted since the end of Q1. It is very clear from this chart that the previously high-valuation BDCs are precisely those that have seen their valuations compress harder.
Systematic Income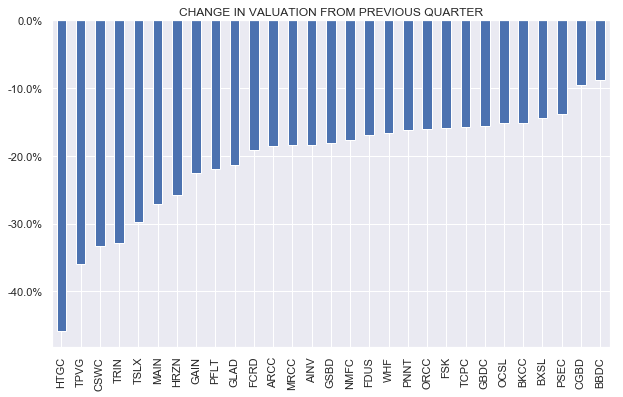
All of our BDC holdings since the start of the year are in the right half of the chart which allowed our BDC sleeve to remain much more resilient relative to the rest of the sector. This has also allowed us to take advantage of this valuation compression with an initial position in TRIN, for instance.
We also made a rotation away from BXSL which traded up to a very expensive valuation level of being around 8% above the sector average.
Systematic Income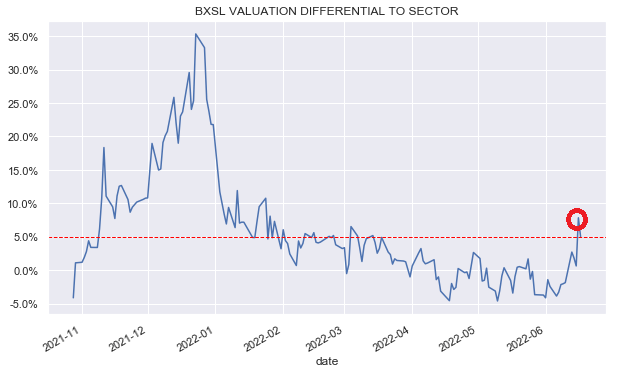
Over its admittedly short holding period, BXSL was the best performer (albeit at a negative absolute return) in our coverage universe which provided a nice opportunity to pick up more beaten down BDCs.
Systematic Income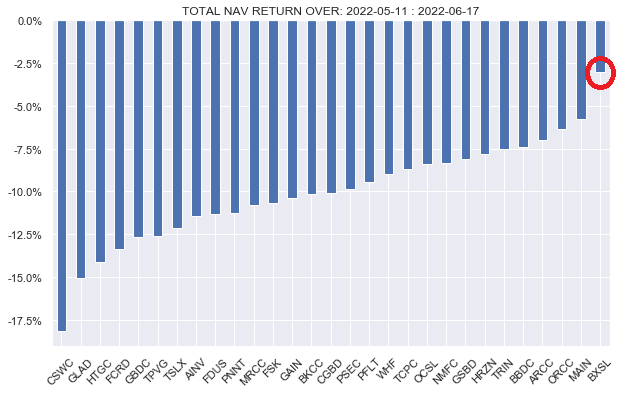
Be the first to comment