

shapecharge/iStock via Getty Images
This article was first released to Systematic Income subscribers and free trials on Mar. 25
Welcome to another installment of our BDC Market Weekly Review where we discuss market activity in the Business Development Company sector from both the bottom-up – highlighting individual news and events – as well as the top-down – providing an overview of the broader market.
We also try to add some historical context as well as relevant themes that look to be driving the market or that investors ought to be mindful of. This update covers the period through the fourth week of March.
Be sure to check out our other Weeklies – covering the CEF as well as the preferreds/baby bond markets for perspectives across the broader income space. Also, have a look at our primer of the BDC sector with a focus on how it compares to credit CEFs.
Market Action
BDCs had a very strong week with a 2% total return, lagging only MLPs and Utilities with only three companies posting negative returns. Month-to-date, FDUS and TRIN remain in the lead on the back of strong earnings announcements and dividend hikes.
March is shaping up to be a decent month after the flat months of January and February. BDCs have mostly ignored the recent rise in Treasury yields – very likely due to the bounce-back in equities as well as the rise in short-term yields which are expected to boost BDC incomes over the coming quarters.
Systematic Income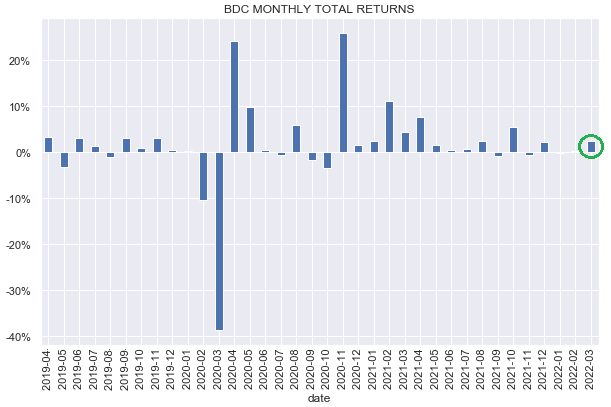
Year-to-date, all of our BDC holdings are in the green so far, with 4 of our total 6 holdings coming in within the top 8 performers.
Systematic Income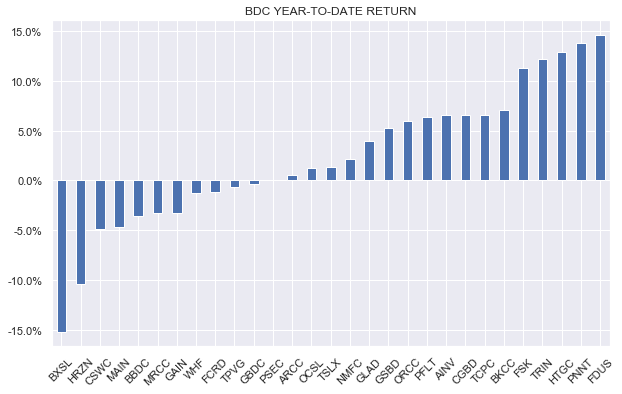
With the earnings season behind us, it’s interesting to take a look at the NAV return trend. Our expectation at the end of last year was for the NAV return trend to continue to decrease and this is indeed what we saw in Q4. That said, the average NAV still managed an above-1% increase for the quarter, generating about a third of the sector’s total return for the period. Going forward, we expect this downward NAV return trend to continue. This is due to the recent weakness in broader risky assets and their impact on asset valuations as well as a reduced number of portfolio exit opportunities (via IPOs or M&A) and the knock-on reduction on prepayment fees.
Systematic Income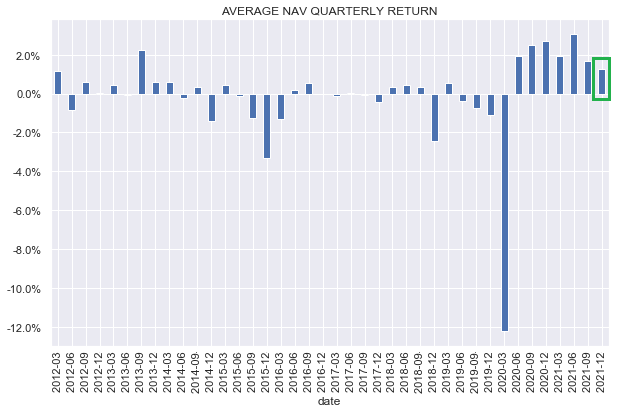
Market Themes
Investors who follow the BDC market fairly closely have probably noticed some unusual behavior in Ares Capital Corp (ARCC). The company’s Q4 results were very strong – it delivered a total NAV return of 4.6% versus the sector average of 3.8% and median of 3.0% – continuing its history of outperformance. The company also increased its regular dividend and declared a special dividend as well.
Systematic Income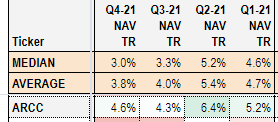
So, of course, the stock proceeded to fall sharply. The chart below shows the price of ARCC over the past year with the red lines showing quarterly results announcement dates. The arrow points to the most recent Q4 results announcement. This is not explained by any obvious broader market moves. While the recent market environment has been a challenging one, to say the least, the rest of the BDC sector has held up just fine year-to-date.
Systematic Income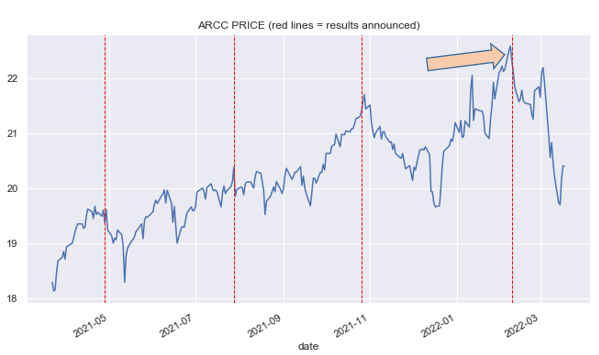
Interestingly, over the past year the stock moved sharply lower after the announcement, each of which were pretty strong. So why are we seeing such odd behavior where the stock moves lower despite positive news?
A flippant answer would be that this is just an example of “buy the rumor, sell the news”. The market has learned to expect strong results from ARCC and knows to preposition for it, dumping the stock after the news is released. The chart below shows that ARCC has delivered pretty consistent NAV growth over time with an average quarterly rise in the NAV of about 0.6% or around 2.5% annualized. This trend has been even stronger in the post-COVID period.
Systematic Income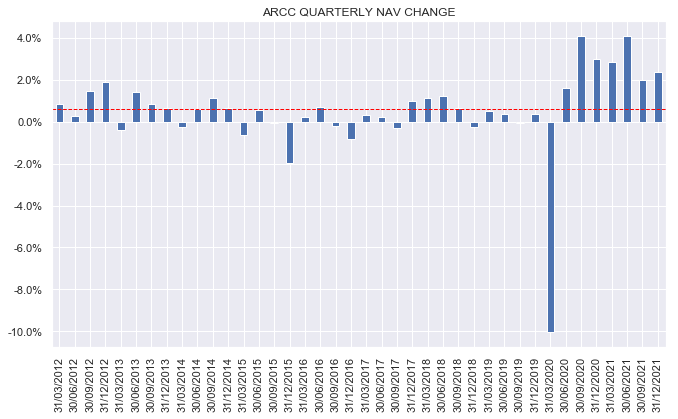
If we look at historic price moves on announcement dates in the chart below, we see that the ARCC price has tended to get a bounce from generally positive results with the average and median daily return way in excess of what they should be in a perfectly efficient market (i.e. they should be pretty close to zero on those days). However, what the chart also shows is that these bounces have been more random and less reliable more recently.
Systematic Income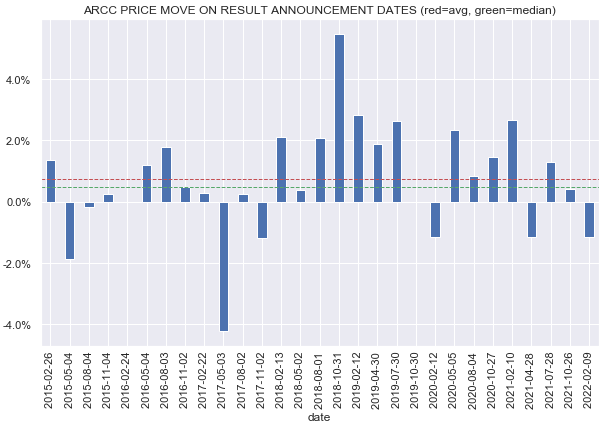
This technical dimension does seem a likely culprit for this odd behavior. However, a related reason this has happened is for the simple reason that the company’s valuation has tended to rise quite sharply ahead of its announcement. Whenever this happens, it leaves much less margin of safety for investors even if the results are good.
Systematic Income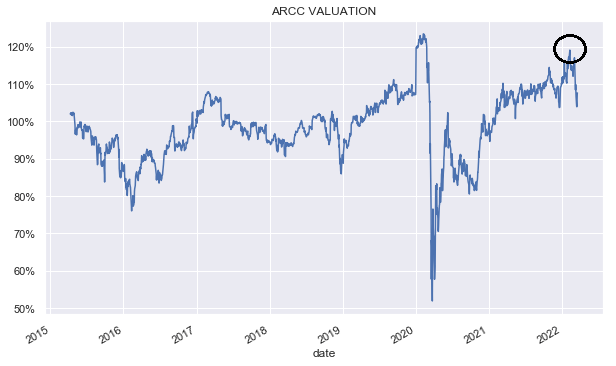
The key takeaway here for the broader CEF sector, and particularly for those BDCs that have shown consistent returns above their yields, is that, absent a run-up in valuation, picking up some more shares in a BDC like ARCC a few weeks or days prior to the results announcement is a very reasonable thing to do, both for more tactical and buy-and-hold investors. In large part, this is because the valuation will likely be slightly understated on average for those BDCs that have historically generated a steady increase in the NAV, offering an attractive entry point for a marginal allocation.
Market Commentary
Trinity Capital (TRIN) raised its dividend at the end of the previous week by 11% to $0.40 and declared a $0.15 supplemental dividend. That equates to an 11.15% total dividend yield based on the price as of this writing.
The company’s NII has only risen above $0.40 once in the last 7 quarters, so this is more a reflection of the company’s recent ability to generate unrealized gains.
Systematic Income BDC Tool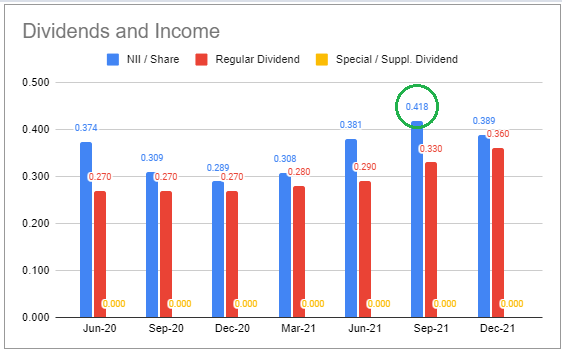
TRIN has one of the highest equity / warrant allocations (double the average BDC) which largely explains its strong NAV performance. We’ve seen a very similar dynamic in FDUS. It’s no coincidence that, in a period of strong public equity returns, FDUS and TRIN had two of the best Q4s in the sector with quarterly total NAV returns of 11.3% and 14.1%.
The Golub Capital BDC (GBDC) valuation has moved lower to a 98% valuation the other day before rising slightly to 99% as of this writing. GBDC valuation has lagged that of the broader sector over the last year or so though it has tended to stay above 100%. Over the previous few years, GBDC has tended to boast a higher valuation relative to the sector as the following chart also shows.
Systematic Income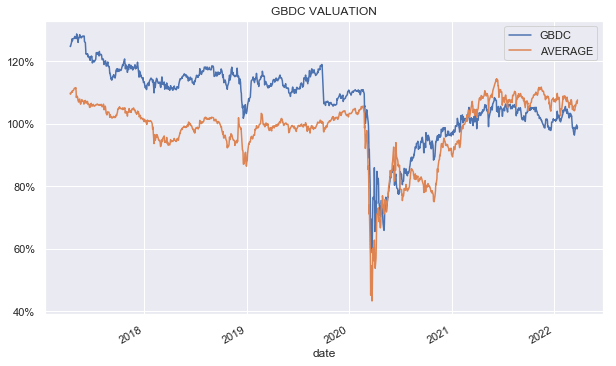
GBDC is generally regarded as a boring higher-quality, low-equity allocation BDC. It also benefits from very low debt interest cost and a cheap management fee structure. Recent total NAV returns have been below the sector average – primarily due to the low equity allocation and low yield on assets (a likely indication of a stronger credit profile). NII has been growing steadily and coverage is north of 100%, which should allow them to lift the dividend in the medium term back to the pre-COVID level. Current valuation gap of near 10% is historically unusual and we expect this to close, particularly if the equity market remains weak. GBDC trades at an 8% dividend yield.
Systematic Income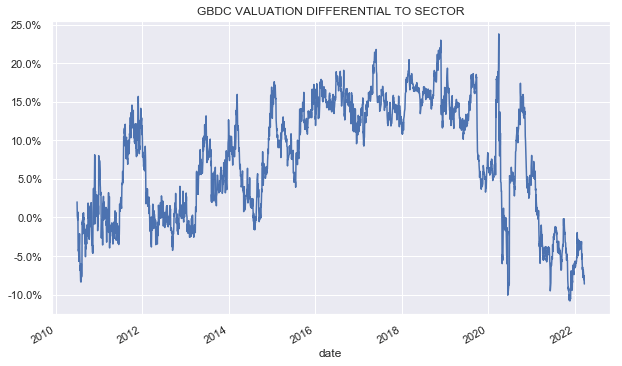
Stance And Takeaways
The recent commentary by Chair Powell in favor of potential 50bp hikes (and their positive impact on BDC income levels) as well as the recovery in equity markets have continued to support the sector. The key question for the BDC sector is whether the Fed’s acknowledgement of the inflation problem and their willingness to overtighten to solve it will lead to a recession. And while the BDC sector generally fared well over the brief 2020 recession, a more traditional extended recession could dent company revenues, particularly as they may also be squeezed on the other side by higher interest costs due to the rise in Libor – the base rate for most BDC loans. This may lead to higher non-accruals and ultimately portfolio losses in the sector. This protracted recession risk remains a key one to watch for investors in the sector.
For this reason, we think it makes sense for investors to hold some allocations to BDCs that are likely to remain more resilient through a downturn such as GBDC as well as OCSL, both attractive at sub-100% valuations or below $15.40 and $7.40 respectively.
Be the first to comment