

gchapel/iStock via Getty Images
The Q4 earnings season for the Gold Miners Index (GDX) is set to begin next month, and one of the most recent companies to report its results is Barrick Gold (GOLD). Unfortunately, while the company had a strong finish to the year, gold production was down on a year-over-year basis, impacted by no contribution from Porgera and a softer year at its Nevada operations. This is a disappointment relative to peers, but with Barrick falling 40% from its highs, the weak results look mostly priced into the stock. Given Barrick’s attractive valuation and continued exploration success across its properties, I would view any pullbacks below $18.65 as low-risk buying opportunities.
Gold Pour – Barrick Gold Operations Company Presentation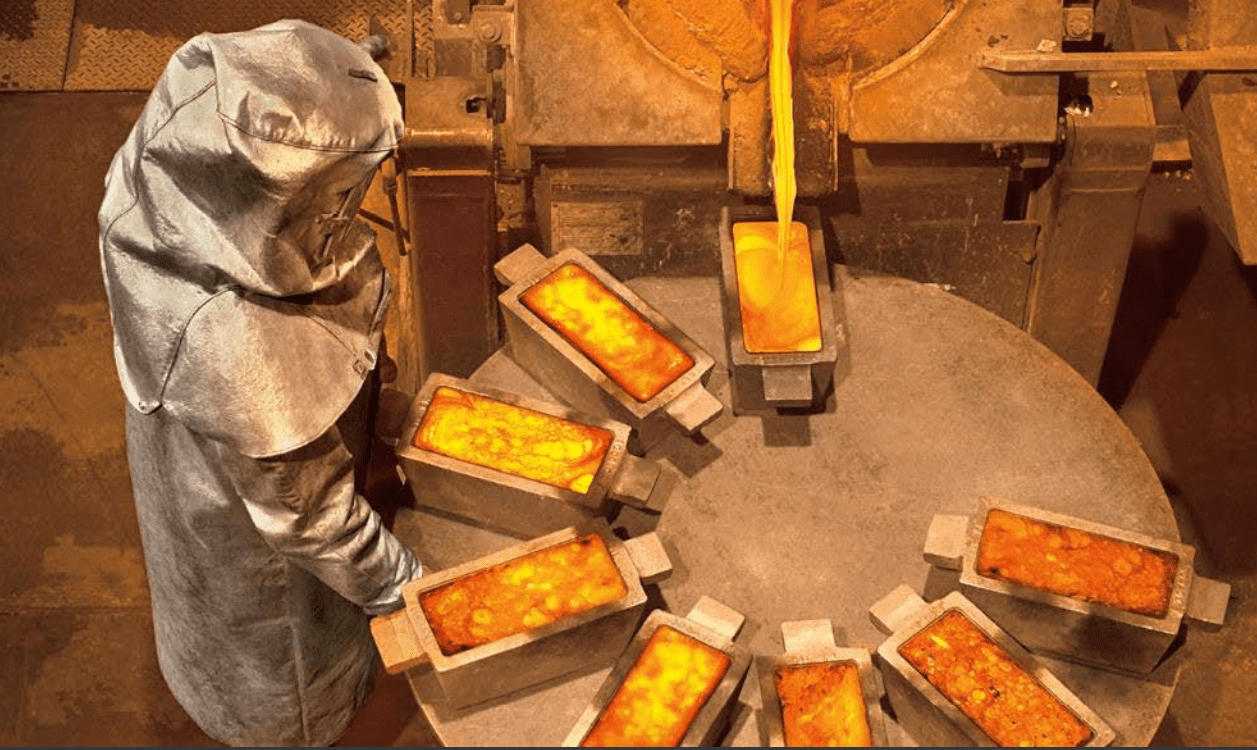
Barrick Gold released its Q4 and FY2021 results this week, reporting quarterly gold production of ~1.20 million ounces, which was flat on a year-over-year basis. Meanwhile, copper production came in slightly higher than Q4 2020 levels, up just over 5% to 126 million pounds (Q4 2020: 119 million pounds). Unfortunately, despite the strong finish to the year, production was down on a year-over-year basis for both metals, with annual production estimated at ~4.44 million ounces of gold and 415 million pounds of copper. This represented a miss on the company’s FY2021 guidance mid-point and should result in a decline in annual EPS year-over-year based on the most recent estimates ($1.12 vs. $1.15).
Barrick Quarterly Gold Production Company Filings, Author’s Chart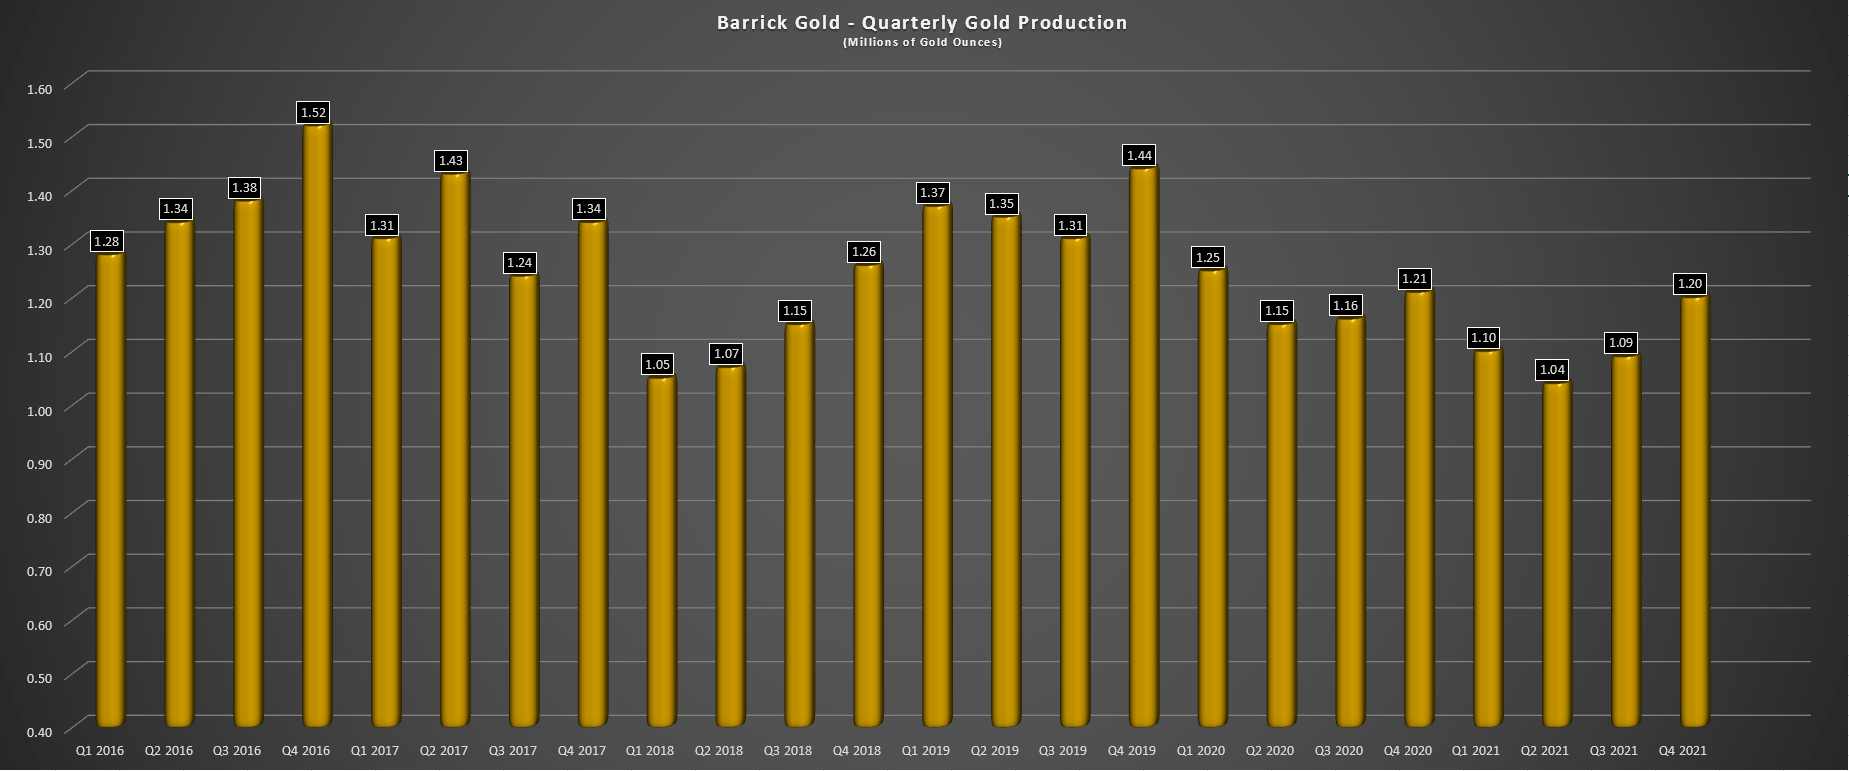
Looking at Barrick’s quarterly gold production above, this marginal decline in gold production follows a sharp decline in production in the prior-year period (~1.21 million ounces vs. ~1.44 million ounces), so at first glance, it would appear that the company was up against easy comps. However, it’s important to note that Porgera was offline in 2021 vs. production of ~90,000 ounces in 2020. In addition, the company was lapping the sale of its interest in the Australian Super Pit (KCGM) in 2019. Therefore, on a continuing operations basis, with Porgera waiting to be restarted and KCGM no longer in the portfolio, it’s no surprise that production is down on a two-year basis, especially when we add in COVID-19 related headwinds.
Barrick Mine by Mine Production Company Filings, Author’s Chart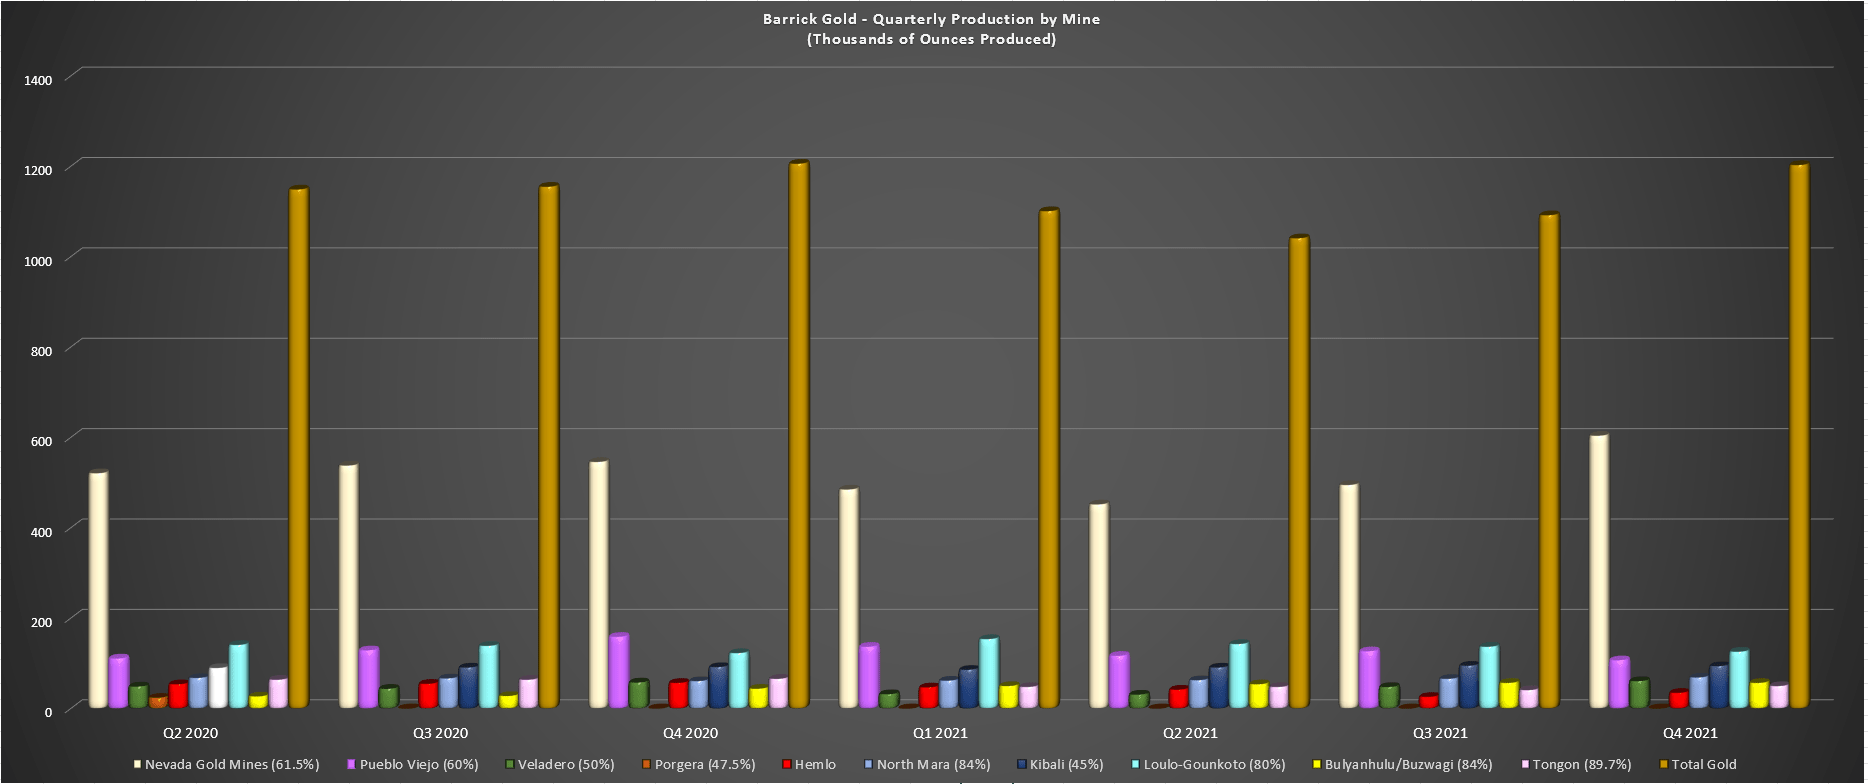
Digging into Barrick’s gold production above, we can see that the improved production on a sequential basis (~1.2 million ounces vs. ~1.09 million ounces) was driven by a sharp increase in output from Nevada Gold Mines (~604,000 ounces vs. ~495,000 ounces). This was related to the Goldstrike roaster being back in action after a mechanic mill failure earlier this year, allowing for increased contribution from both Carlin and Cortez with this processing capacity back online. Meanwhile, Veladero also had a solid quarter, with the production of 61,000 ounces, up 6% year-over-year. Finally, Kibali had a strong finish to 2021, with Barrick’s attributable production coming in at ~94,000 ounces.
On the negative side, Hemlo had a softer quarter, producing just 35,000 ounces (Q4 2020: ~57,000 ounces), Pueblo Viejo production was down sharply to just ~107,000 attributable ounces, and production at Tongon was also down more than 20,000 to ~50,000 attributable ounces. The lower production at these operations partially offset the recovery at Nevada Gold Mines, and the slight increases at Kibali, Loulo-Gounkoto, Bulyanhulu/Buzwagi, hence why Barrick saw flat production year-over-year despite a huge quarter at its Nevada Gold Mines joint-venture. Based on annual production of ~4.44 million ounces of gold, below the guidance mid-point of ~4.55 million ounces.
Barrick Gold Copper Production Company Filings, Author’s Chart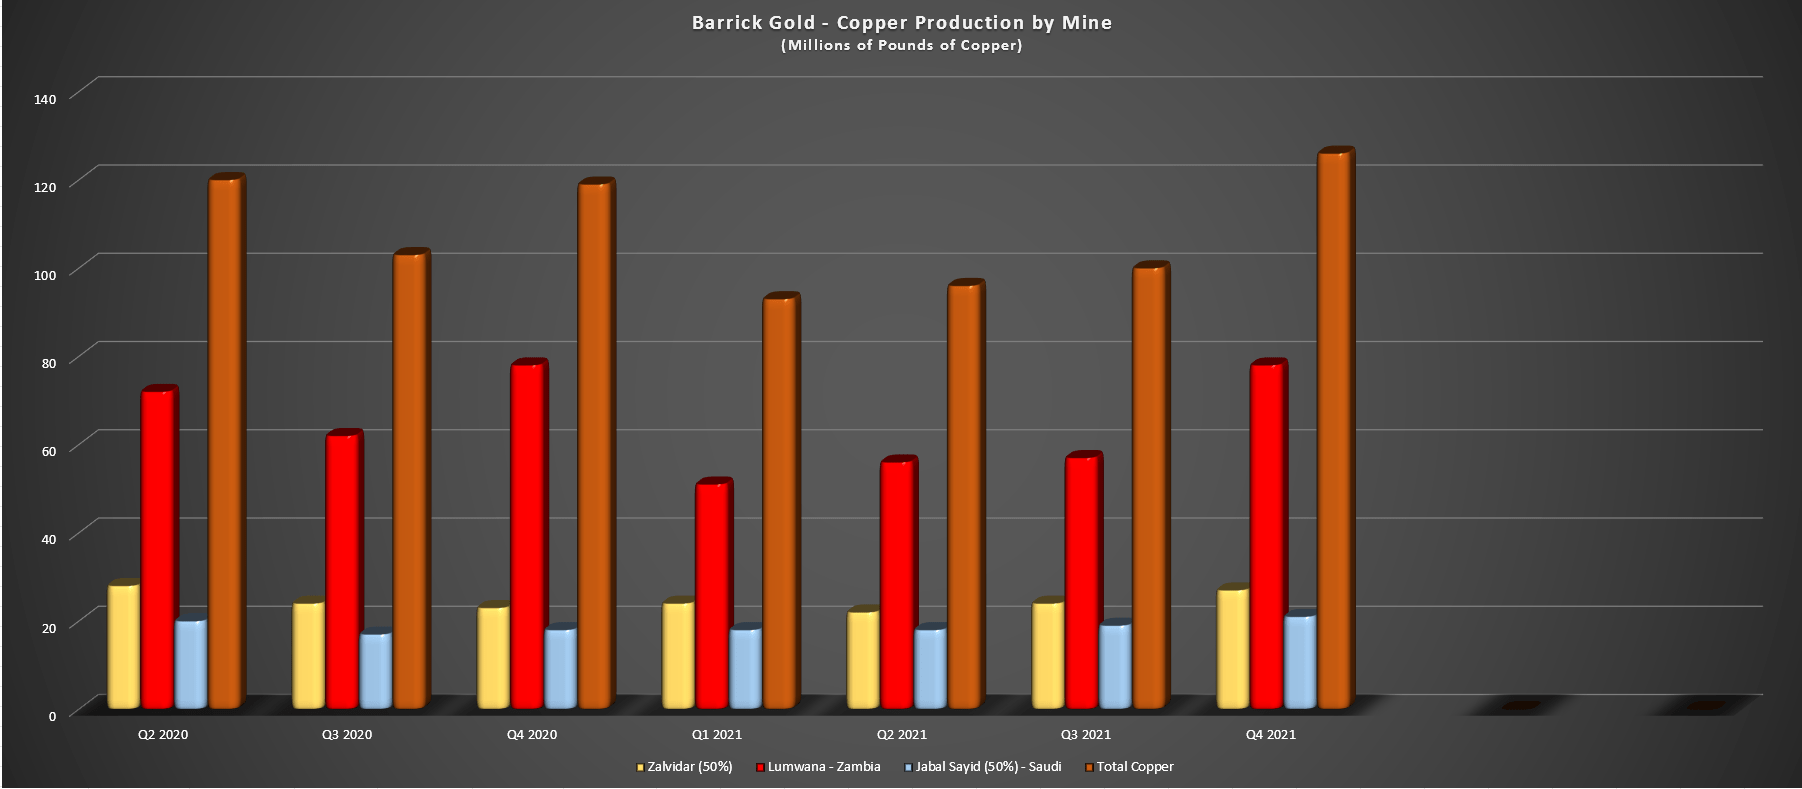
Moving over to copper production, it also came in strong during Q4 but was down on a year-over-year basis due to softer production in Q1 and Q2. During Q4, Barrick produced a total of ~126 million pounds of copper, with Lumwana having a very strong quarter, producing ~78 million pounds, its highest production since Q4 2020. Barrick noted that copper sales came in much lower than production due to the timing of sales, which will translate to slightly lower revenue (13 million pounds produced that were not sold in the quarter), or a ~$57 million headwind to revenue.
Copper All-in Sustaining Costs & Average Realized Price Company Filings/Estimates, Author’s Chart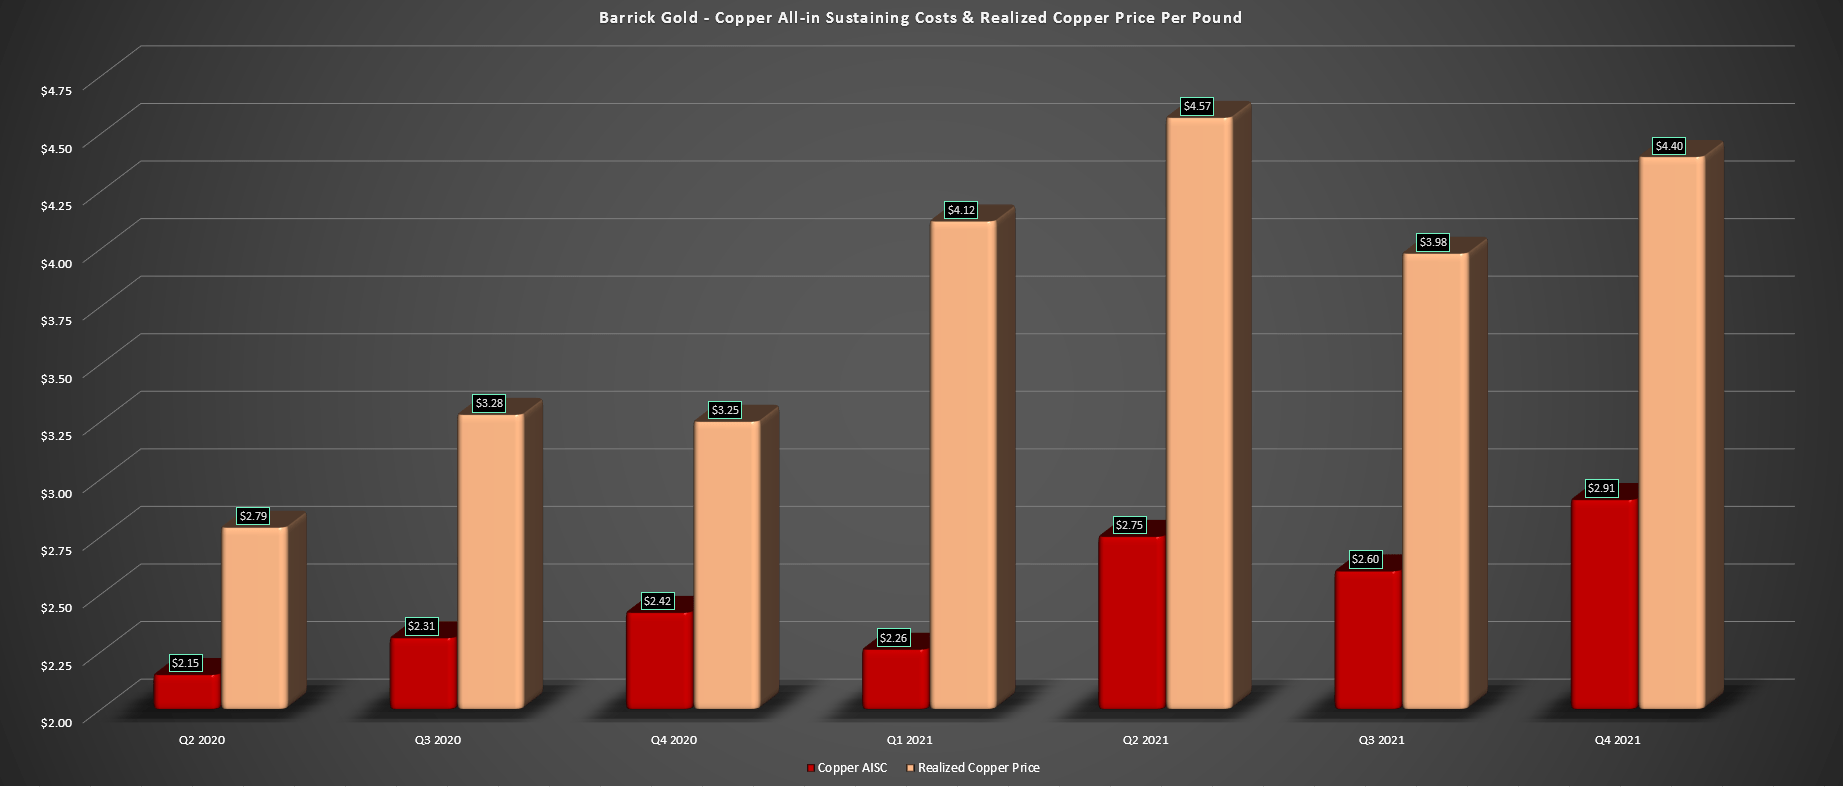
Despite all-in sustaining costs for its copper business expected to increase sequentially and year-over-year to ~$2.91/lb, margins have improved considerably, thanks to the strength in the price of copper. This is shown above, with all-in sustaining cost margins expected to increase 79% year-over-year, from $0.83/lb in Q4 2020 to ~$1.49/lb in the most recent quarter. It’s worth noting that while all-in sustaining costs were up in the period ($2.91/lb vs. $2.42/lb), this was partially due to increased capital expenditures, with the company purchasing new mining equipment as well as stripping costs. So, we would have seen further margin expansion in the period if not for the increased capex. Let’s take a look at Barrick’s earnings trend:
Barrick Gold Earnings Trend FactSet, Author’s Chart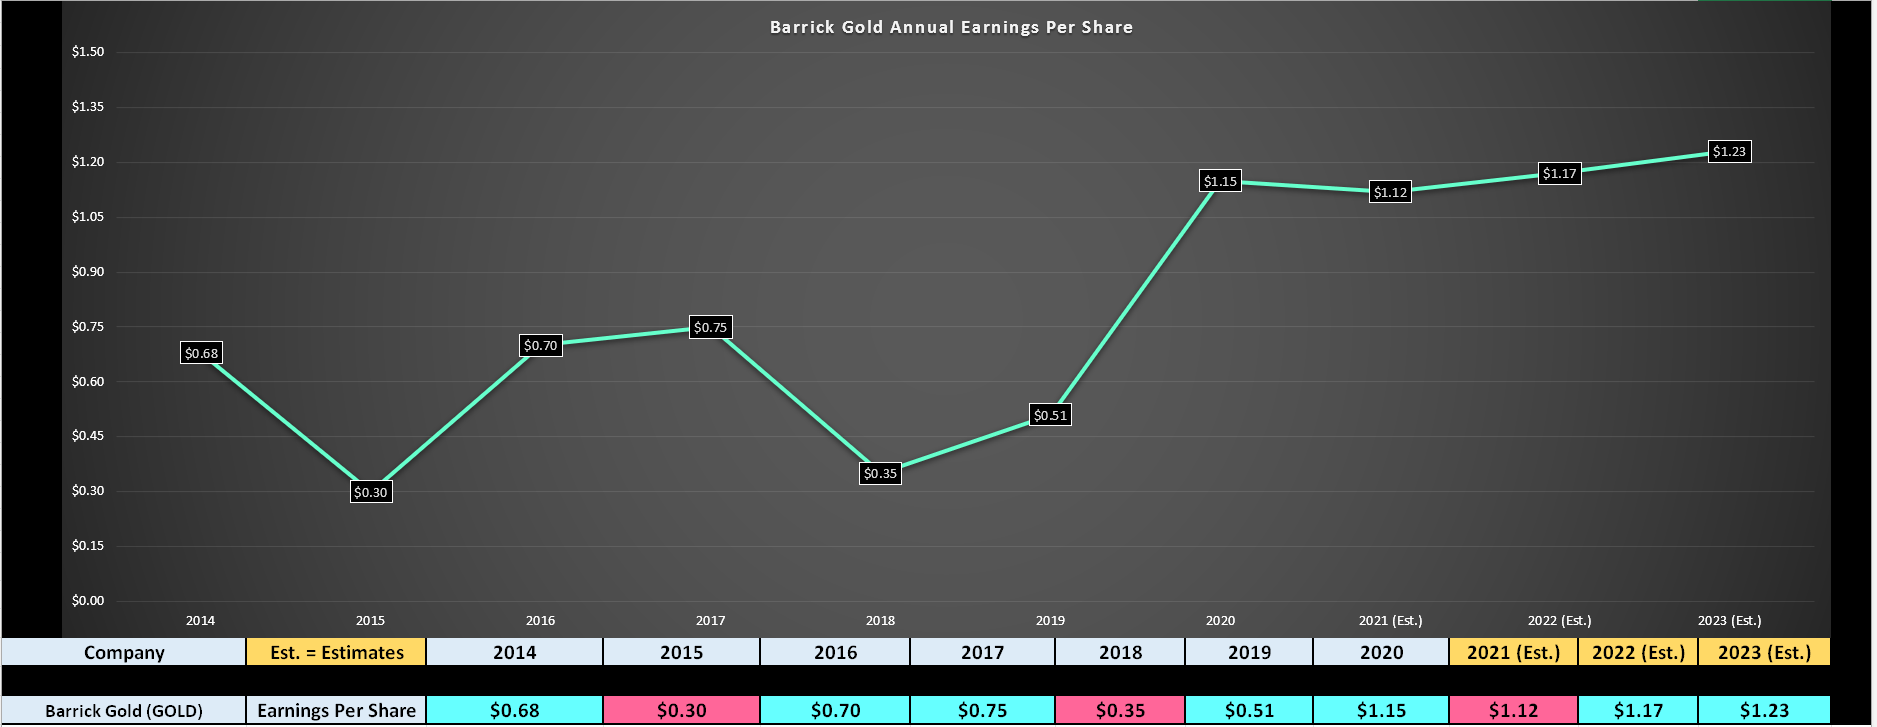
Unfortunately, despite the significant improvement in margins for its copper business, Barrick was up against tough year-over-year comps for its gold business, with a record average realized gold price in H2 2020. This is expected to result in a 2% decline in annual earnings per share in FY2021 vs. FY2020 levels. Having said that, a 2% decline in annual EPS following a more than 125% gain ($1.15 vs. $0.51) is not the end of the world, and annual EPS should hit new highs in FY2022 and FY2023 if copper prices can remain above $4.15/lb.
Some investors will point Barrick in a bad light and remain negative on the stock due to the expected marginal decline in annual EPS, but I don’t see this decline as an issue. This is because the company had to operate with continued COVID-19 headwinds, which affects productivity at some mines, it saw no contribution from Porgera, it had a one-time issue with the Goldstrike roaster, and it was up against difficult year-over-year comps from the gold price contributing to the decline in annual EPS. In fact, given all of these headwinds, the fact that it should retain 95% of last year’s earnings is actually commendable.
Cortez Complex Production Estimates Company Presentation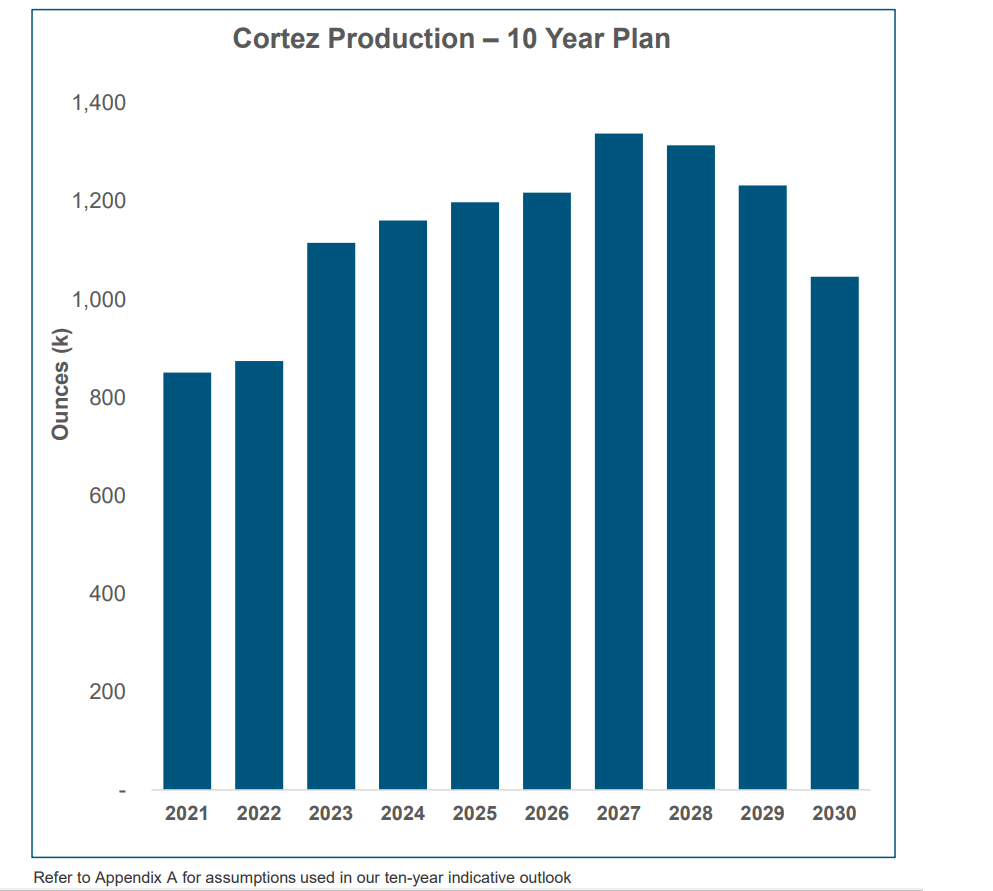
The good news is that looking out over the next two to four years, Porgera should be contributing again in Papua New Guinea, and Cortez is expected to see much higher production with added contribution from Goldrush and Robertson. Meanwhile, I would expect a continued bid under the copper price due to the attractive supply/demand picture with the recent trend towards electrification and a torrid pace of electric vehicle adoption. If we add in the potential for a much better two years ahead for gold after an 18-month hiatus from its bull market, the forward earnings outlook should be much better, with a possibility for annual EPS of $1.30+ in FY2023 (current estimates: $1.23).
Copper Supply/Demand Estimates Wood Mackenzie Research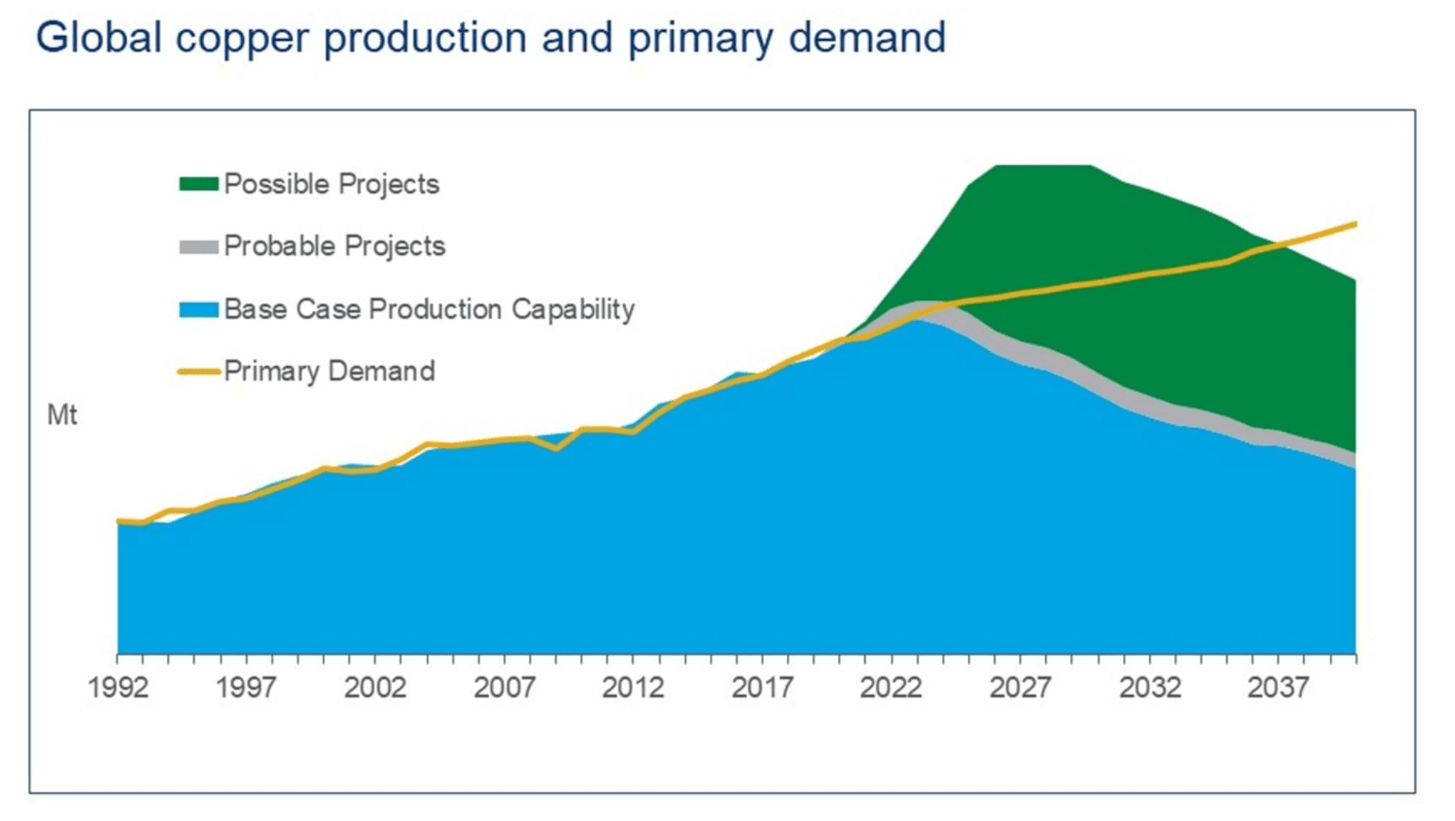
Valuation & Technical Picture
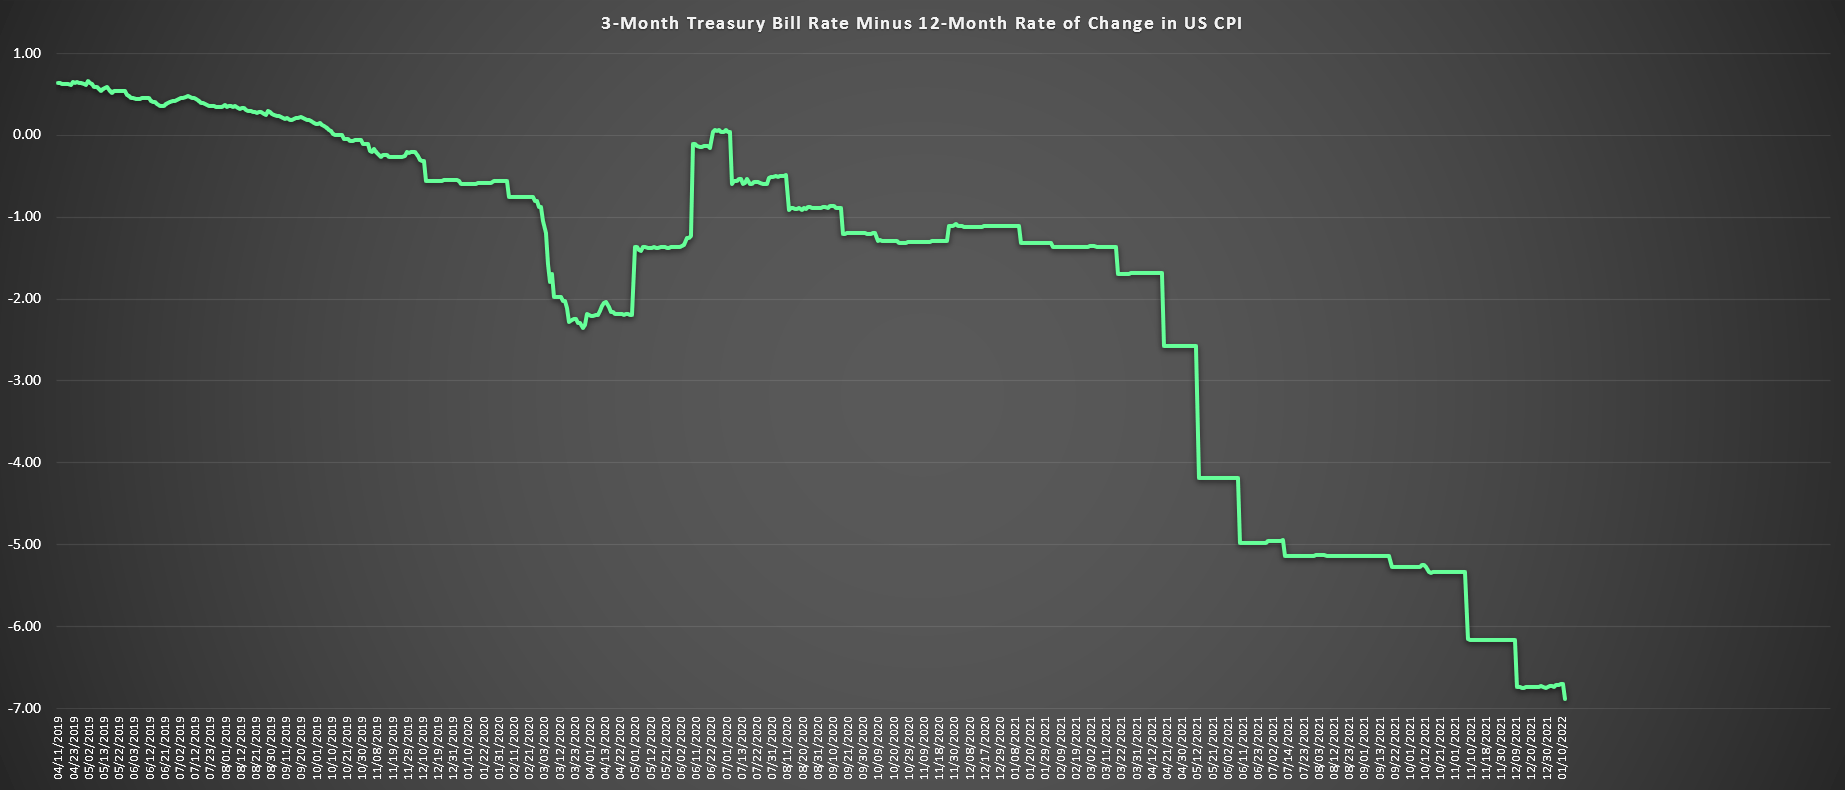
Over the past two decades, Barrick has traded at an average cash-flow multiple of ~11, with an average cash-flow multiple of 9 since the bull market for gold began in 2016. If we use the mid-point of this range at 10, which I would argue is more conservative, given that Barrick’s margins are the best they’ve been since 2016, this translates to a fair value of $27.10 based on FY2022 estimates. This price target also assumes no upside in the gold price, which appears likely if negative real rates continue to remain in sharply negative territory. Currently, real rates are sitting at a reading of negative 6%, which is one of the lowest readings we’ve seen in decades. This presents a favorable backdrop for gold, even if the metal has not responded yet.
Barrick Gold Historical Cash Flow Multiple FASTGraphs.com Negative Real Rates YCharts.com, Author’s Chart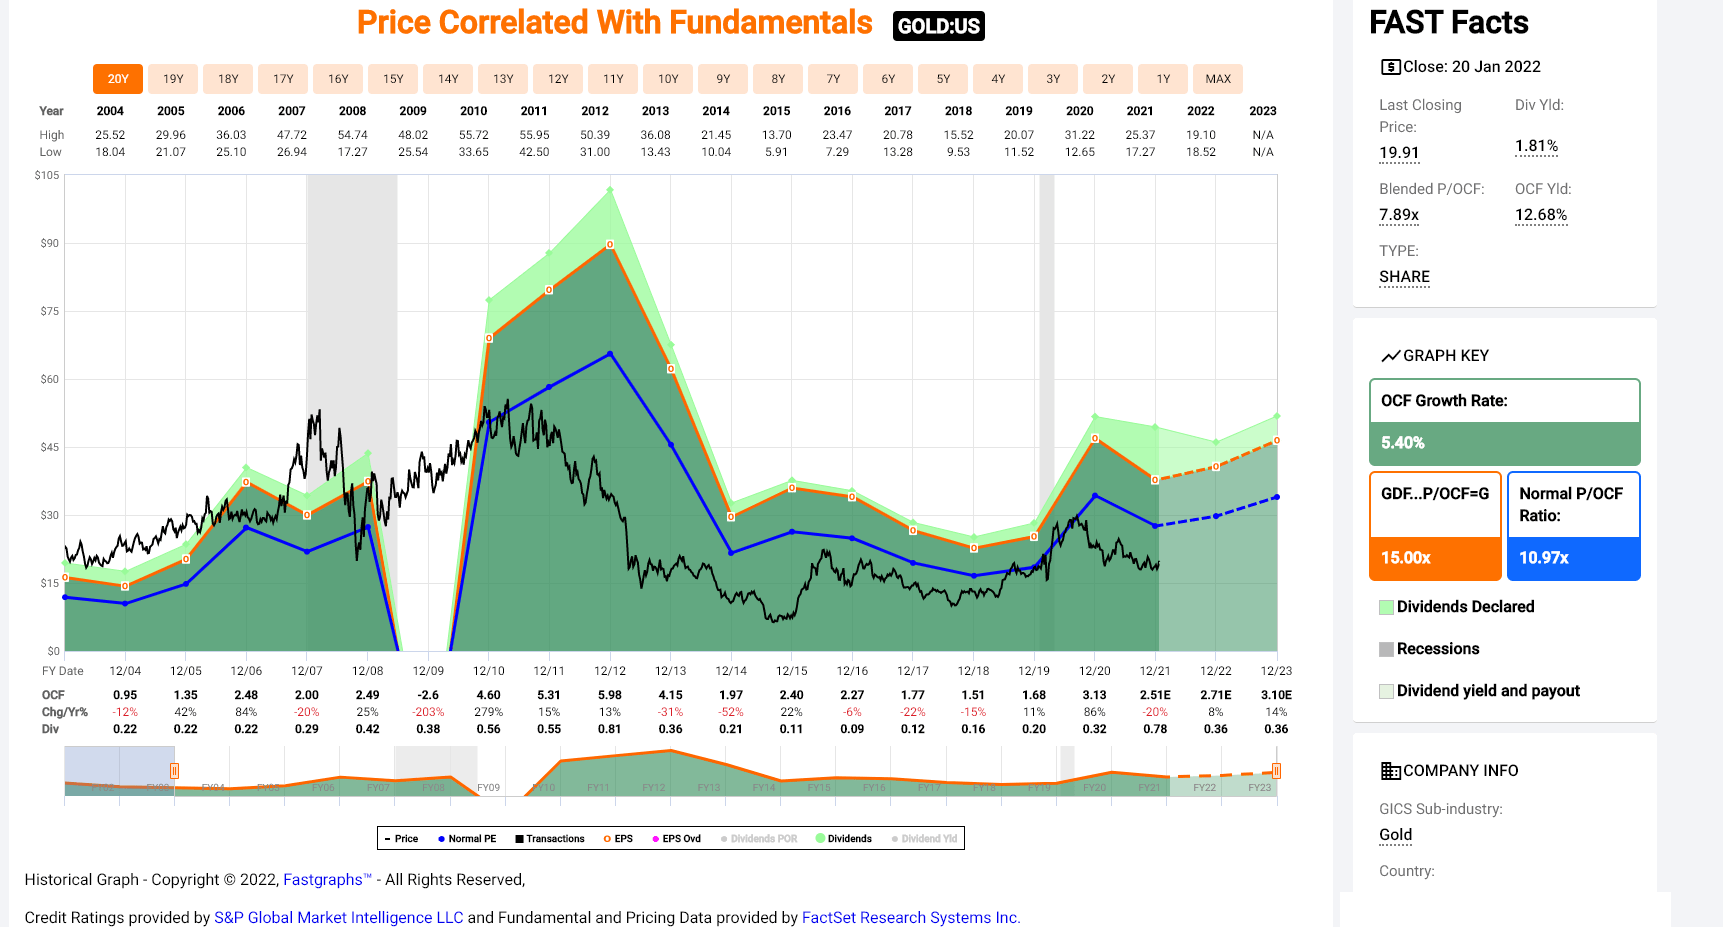
Meanwhile, from a net asset value standpoint, I have estimated Barrick’s total project NPV (5%) at ~$37.5 billion, with its net asset value coming in at ~$36.1 billion after subtracting out corporate G&A. If we divide this figure by ~1.78 billion shares outstanding, Barrick’s fair value comes in at $20.30 per share. However, there is no reason that Barrick should trade at 1.0x P/NAV as the world’s 2nd largest gold producer with exposure to copper as well. Instead, it should trade closer to 1.25x P/NAV, where it has historically traded.
Based on a P/NAV multiple of 1.25, Barrick’s fair value comes in closer to $25.60 per share, pointing to a nearly 30% upside from current levels. It’s important to note that this assumption of net asset value is based on a $1,750/oz gold price, so these estimates also appear conservative if gold decides to finally wake up from its 18-month slumber. To summarize, from a price-to-earnings, price-to-cash-flow, and book value standpoint, Barrick is the cheapest it’s been in years and offers a meaningful margin of safety for investors.
So, is the Stock a Buy?
As I’ve pointed out in previous updates, the ideal spot to buy Barrick Gold is at $18.20 or lower, where the stock is not only very attractively valued but also hugging its uptrend line off its 2016 lows. After a more than 9% rally off these lows, Barrick may still have meaningful upside to its conservative fair value ($25.60 – $27.10), but it’s just outside of its Strong Buy zone near $18.00. So, while the stock is very attractively valued and is a low-risk way to secure a 2.0% dividend yield and exposure to gold and copper, I am short-term neutral at a share price of $20.00.
Barrick Gold Ratings – TipRanks TipRanks.com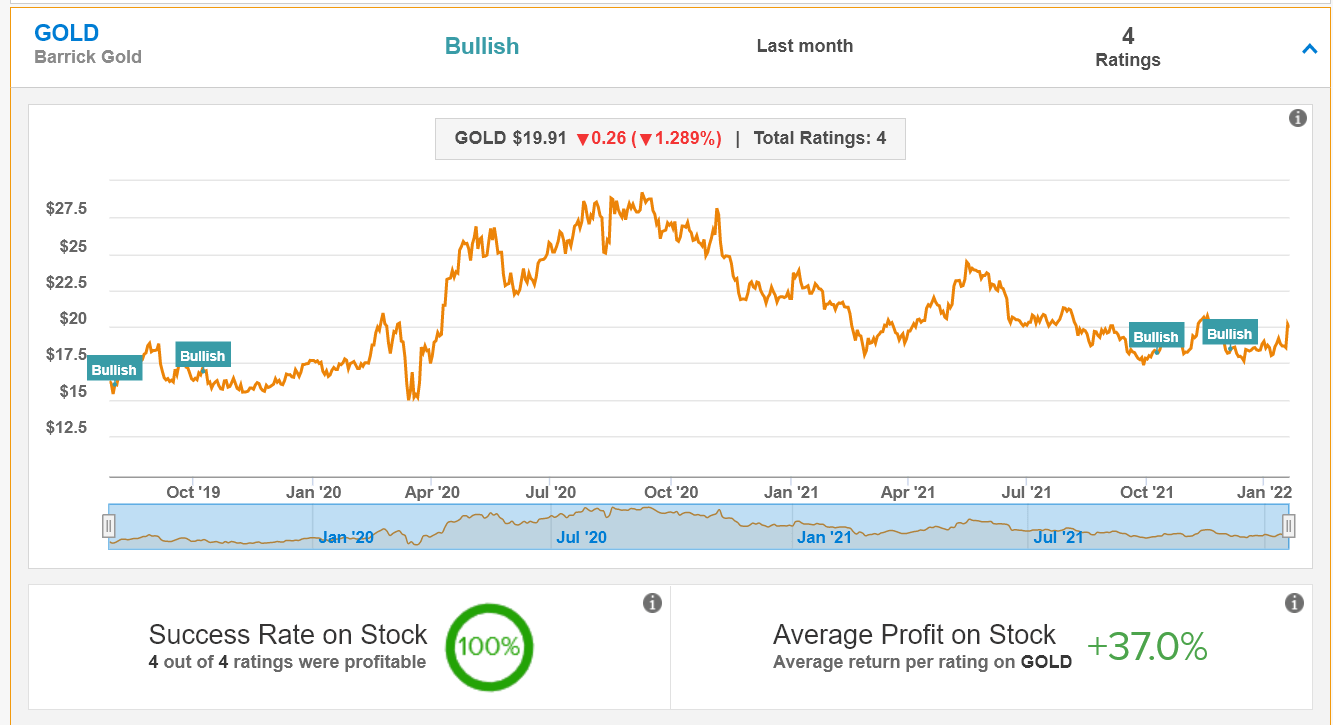
Having said that, the long-term outlook for Barrick has rarely been better, and while many are pessimistic regarding the name after a ~40% correction, it’s hard not to be very optimistic when looking at the below quarterly chart. As we can see, while Barrick has seen consistently lower lows and remains in a steep downtrend on its daily chart, which has contributed to negative sentiment, no real technical damage has been done to the long-term picture. In fact, Barrick looks to be correcting in a very controlled manner, with a similar setup to what we saw in Q3 2018. So, as long as Barrick holds the $17.00 level, a trade above $25.00 in the next 18 months looks likely, which would fit with the pattern we saw coming out of the Q3 2018 correction.
GOLD Technical Chart TC2000.com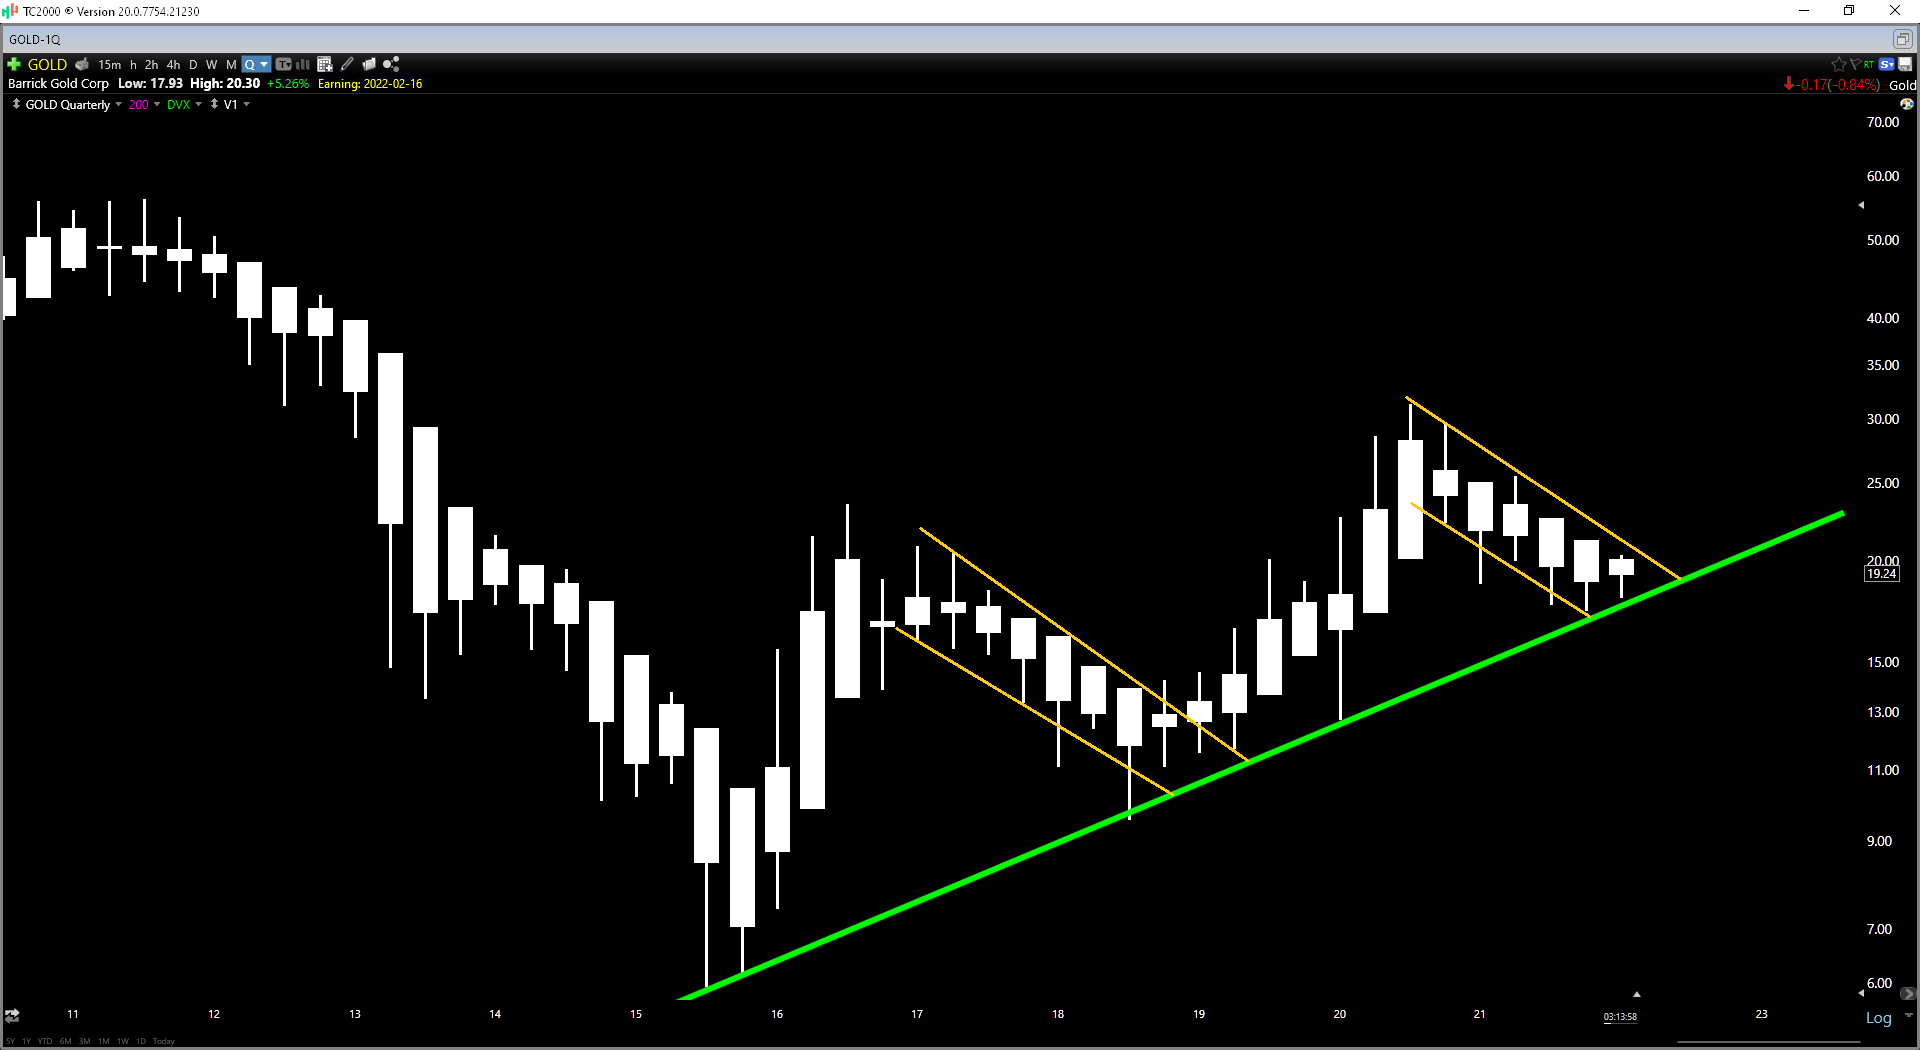
Finally, from a fundamental standpoint, the best time to buy in miners is when the majority have thrown in the towel and given up on them, with gold being a very emotional trade among investors, with extremes in both directions. As the chart below shows, bullish sentiment for gold just came off its worst readings in three years, with the last time it was this hated also being Q3 2018. Obviously, this time could be different, but generally, the time to be accumulating gold miners is when no one else wants to touch them, and it’s hard even to give the shares away.
Bullish Sentiment for Gold DSI Data, Author’s Chart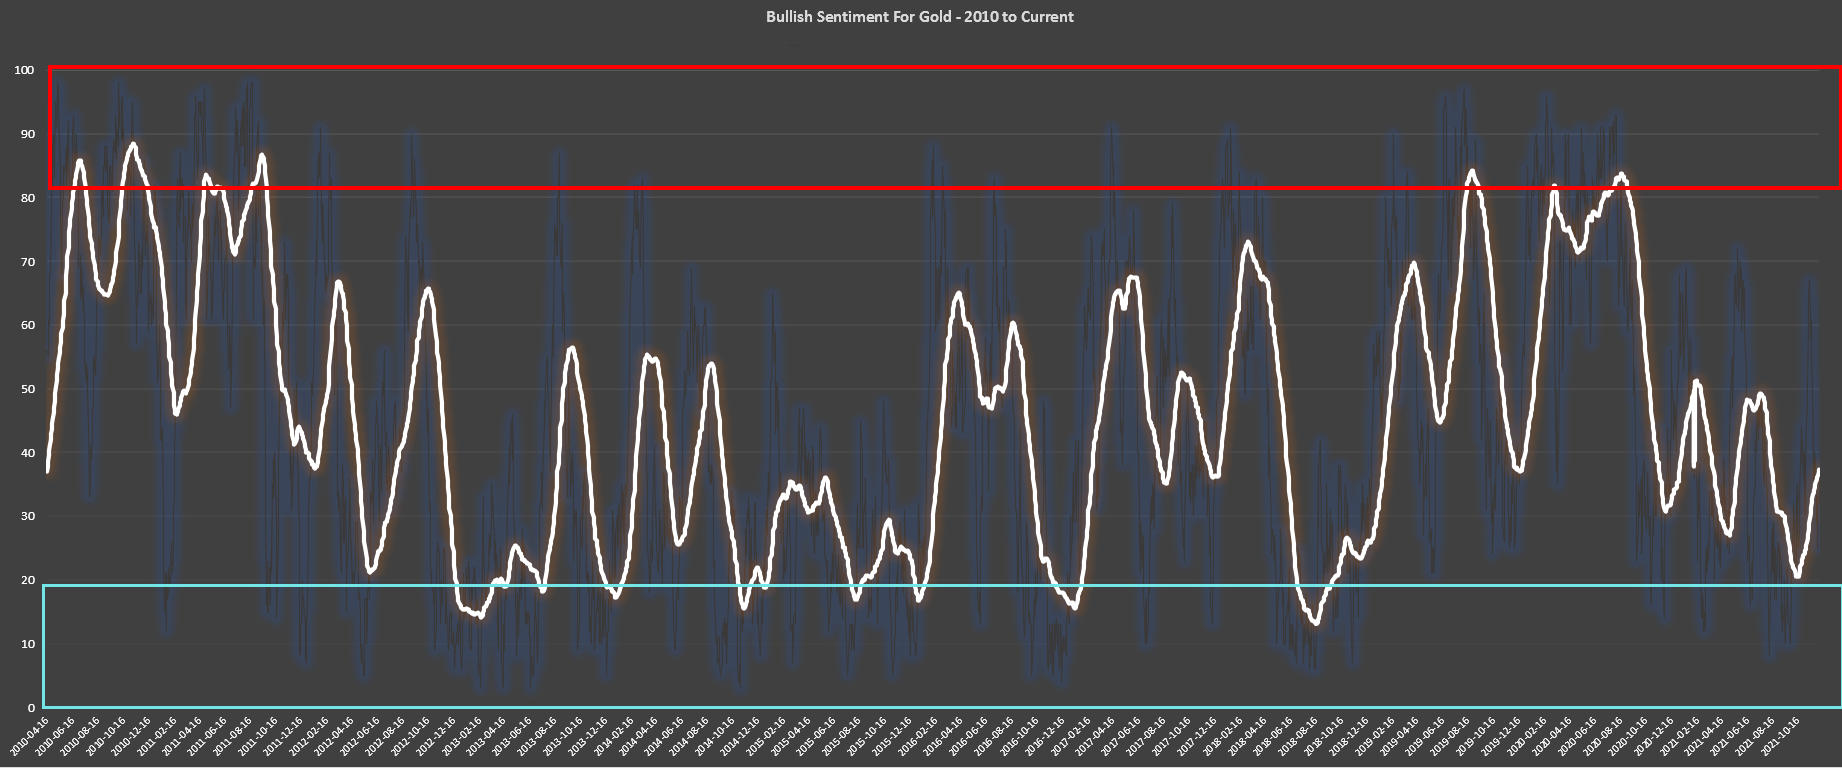
The amazing thing about this recent sentiment reading, though, is that we are seeing this despondency just 10% from all-time highs, and the last time readings were this bad was when gold was making multi-year lows near $1,160/oz. So, investors seem to be giving up on the metal and gold producers when they’re returning the most capital they ever have to investors and enjoying their best margins since this bull market began. In summary, while the past 18 months were certainly not kind to investors in the space, the ingredients are in place (negative sentiment, negative real rates, overbought readings reset) for the next 18 months to be much better.
Nevada Gold Mines’ Operations Barrick Gold Presentation
While there are no sure bets in the market, and past performance is not indicative of future returns, one method that has worked to consistently beat the market is buying something for much less than its fair value when it’s deeply out of favor. We have finally crossed this road for Barrick Gold, with the stock sitting at its most attractive valuation since Q1 2020 and Q3 2018 while enjoying record margins for its copper business and near-record margins for its gold business. Therefore, the price is right from a valuation standpoint. Given its attractive valuation and continued exploration success across its properties, I would view any pullbacks below $18.65 as low-risk buying opportunities.
Be the first to comment