

NeilLockhart
Just over two weeks ago, I wrote on Barrick Gold (NYSE:GOLD), noting that too much negativity was out there currently in the gold space and that 2023/2024 should be much better years, suggesting this was a buying opportunity. This call was brutally early and wrong, with the stock plunging over 7% on earnings with lower cash flow, lower revenue, and less positive commentary than I anticipated on moderation in inflation for some key consumables. That said, while the report was softer than many hoped for and didn’t provide much reason for optimism from a cost standpoint near-term, I see the decline as a massive overreaction.
For starters, Barrick was already trading at a massive discount to its historical cash flow multiple heading into the report, sitting at ~5.9x FY2023 cash flow per estimates. In addition, FY2022 and FY2023 are unusual years, with extreme inflationary pressures exacerbated by supply chain headwinds and elevated sustaining capital spending. Third, production should only head higher from here, and its Nevada JV looks the best it has in years. It’s set to benefit from higher production from Turquoise Ridge, future contributions from new mines (Goldrush, Fourmile, North Leeville, REN, Robertson) and Pueblo Viejo (PV) is on the eve of a major expansion. So, while it’s easy to point out the negatives, I see this as the perfect time to be a contrarian and buy the dip.
Barrick Gold Operations (Company Presentation)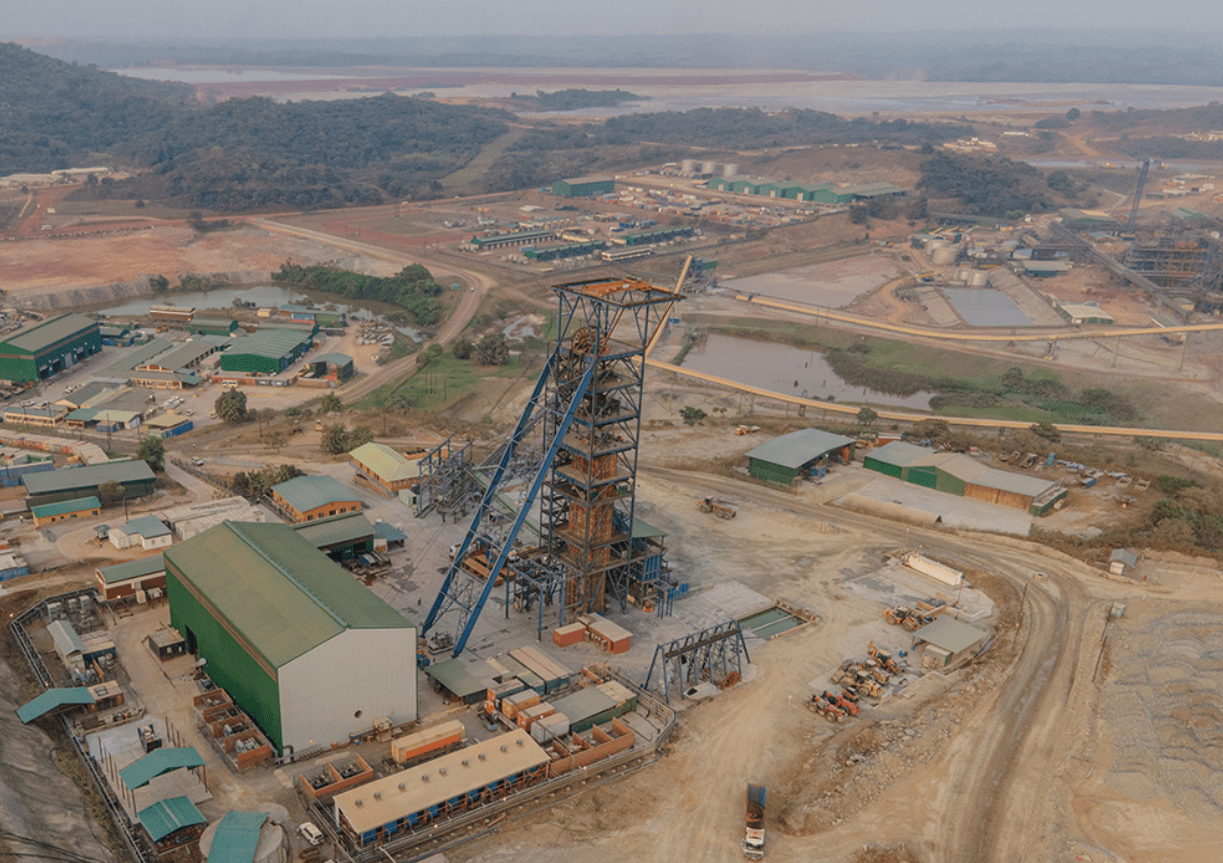
Q3 Production & Sales
Barrick reported quarterly production of ~0.99 million ounces of gold and ~123 million pounds of copper, translating to a 9% decline in gold production year-over-year, while copper production increased 23% vs. Q3 2021. The lower gold production was related to the completion of Phase 1 mining in May at Long Canyon and much lower production at Cortez, Turquoise Ridge, Bulyanhulu, and Kibali on a year-over-year basis. The decline in production at these assets was partially offset by higher production at Hemlo, North Mara, and its shared Carlin Complex. Still, it wasn’t enough to overcome the decline in output at key assets. That said, a very strong Q4 is ahead, allowing the company to deliver on production guidance for a fourth consecutive year under new CEO Mark Bristow.
Barrick Gold – Quarterly Production by Mine (Company Filings, Author’s Chart)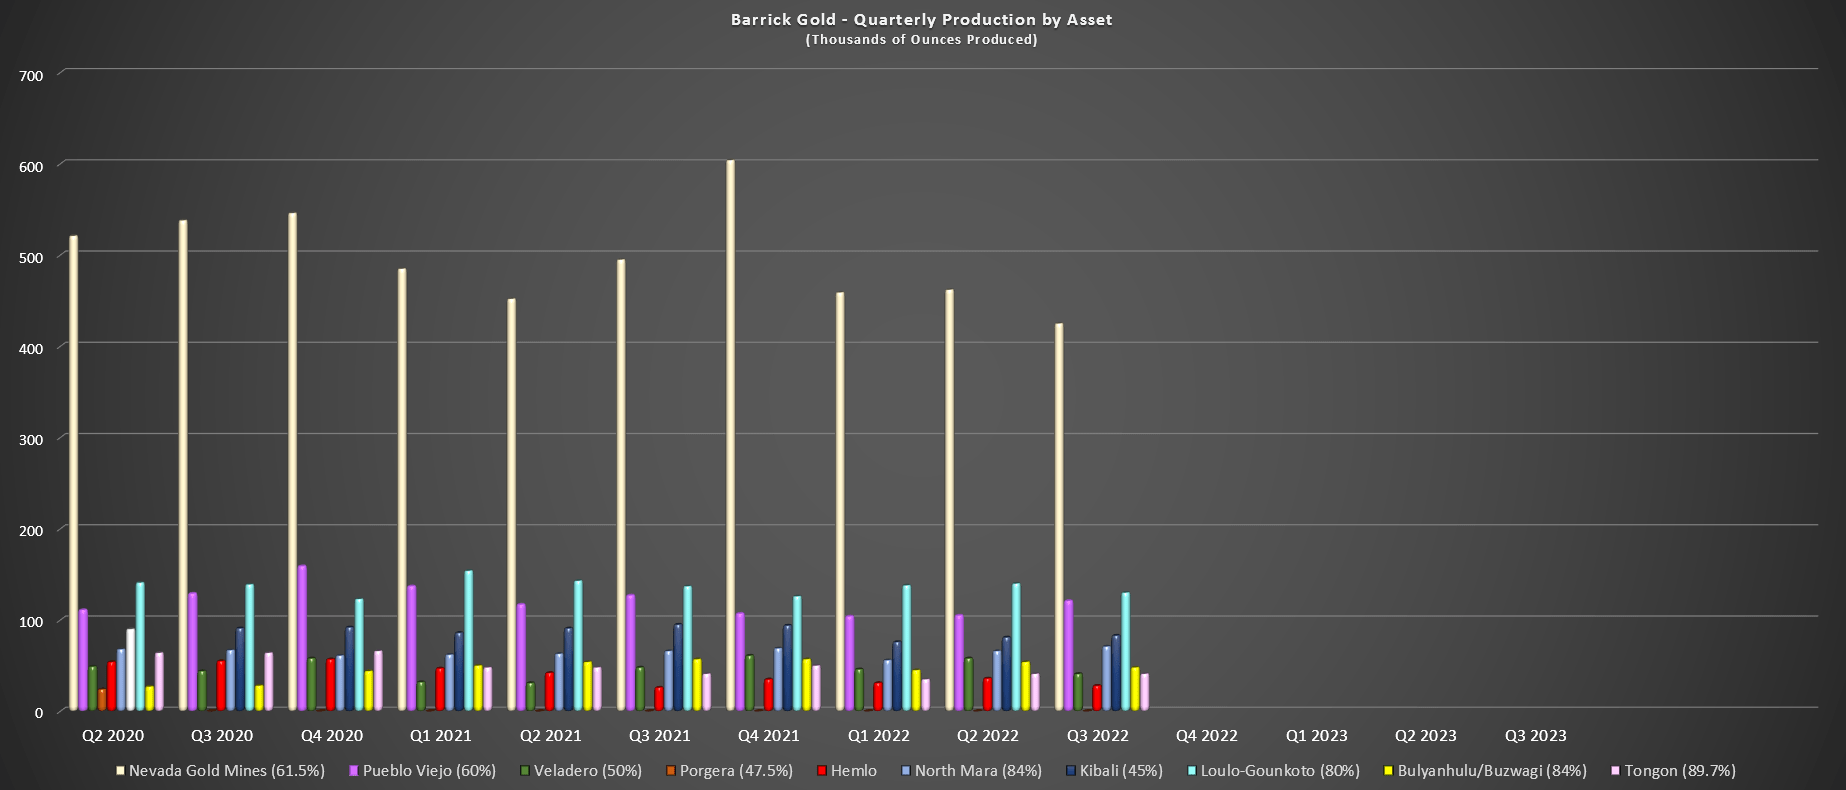
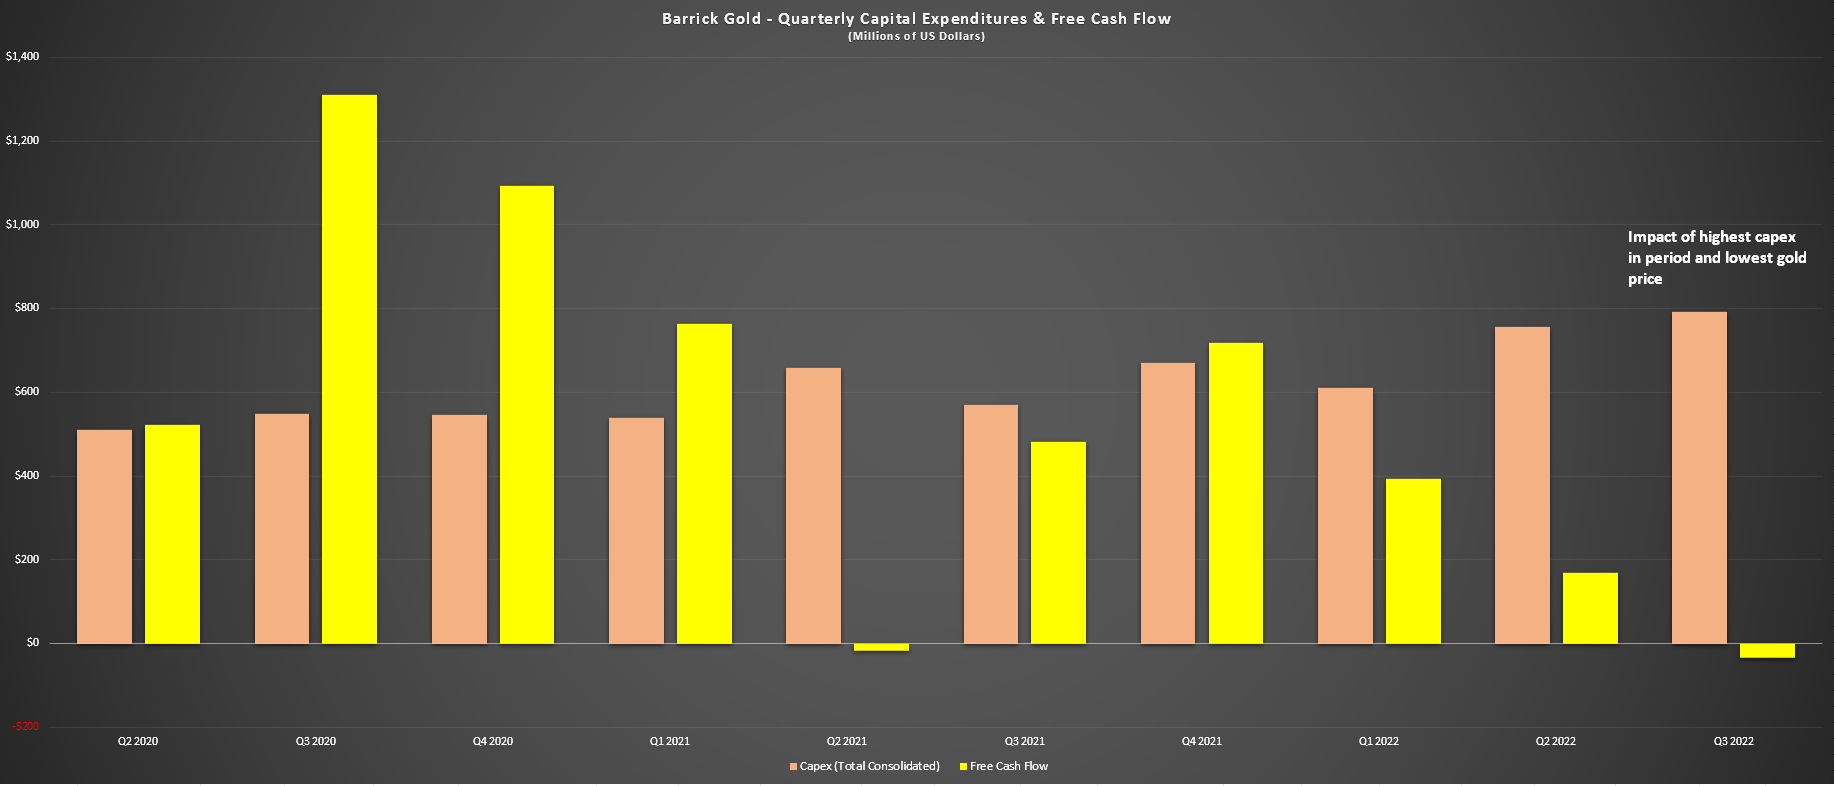
From a sales standpoint, Barrick’s gold sales came in at ~1.0 million ounces, a 7% decline from the ~1.07 million ounces produced in the year-ago period. Unfortunately, this decline in sales volume combined with a much lower gold price put a severe dent in revenue, with its average realized gold price sliding from $1,771/oz to $1,722/oz, a decline of nearly 3%. The result was that quarterly revenue plunged to $2.53 billion, a drop of 11%, and free cash flow dipped into negative territory, similar to what we saw from some other major producers in Q3. However, it’s important to note that Barrick’s free cash flow was impacted by 39% higher capital expenditures ($792 million), and adjusted for similar capex to Q3 2021, free cash flow would have been comfortable in positive territory ($189 million vs. negative $34 million).
Barrick – Quarterly Revenue (Company Filings, Author’s Chart) Barrick Gold – Quarterly Capex & Free Cash Flow (Company Filings, Author’s Chart)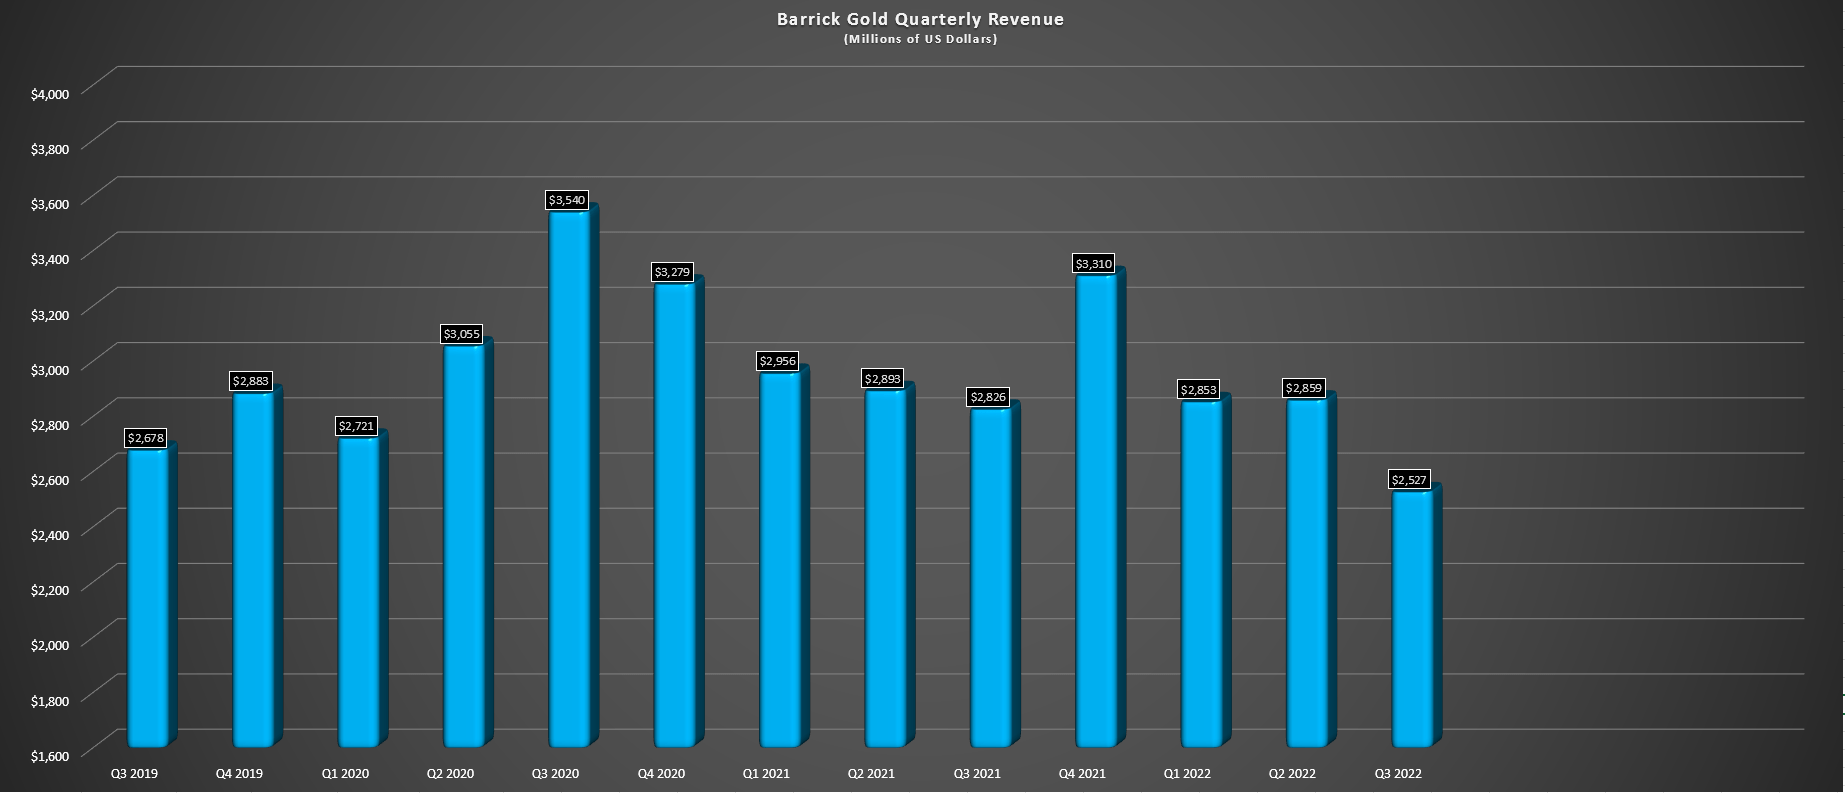
Costs & Margins
Moving over to costs and margins, I had initially assumed all-in-sustaining costs (AISC) of $1,250/oz in Q3 2022 and AISC margins of $480/oz with expectations of a slightly higher average realized gold price ($1,730/oz). Barrick’s costs came in slightly above my estimates at $1,269/oz, which represented a sharp increase year-over-year, and its average realized gold price was $1,722/oz, resulting in AISC margins of $453/oz. The result was a 38% decline in AISC margins year-over-year, impacted by the lower gold price, lower gold sales volume, inflationary pressures, and elevated sustaining capital in the period ($571 million vs. $386 million). On a full-year basis, Barrick’s costs now look like they will come in above $1,185/oz, a more than 15% increase year-over-year.
Barrick Gold – Quarterly AISC, Gold Price, AISC Margins (Company Filings, Author’s Chart)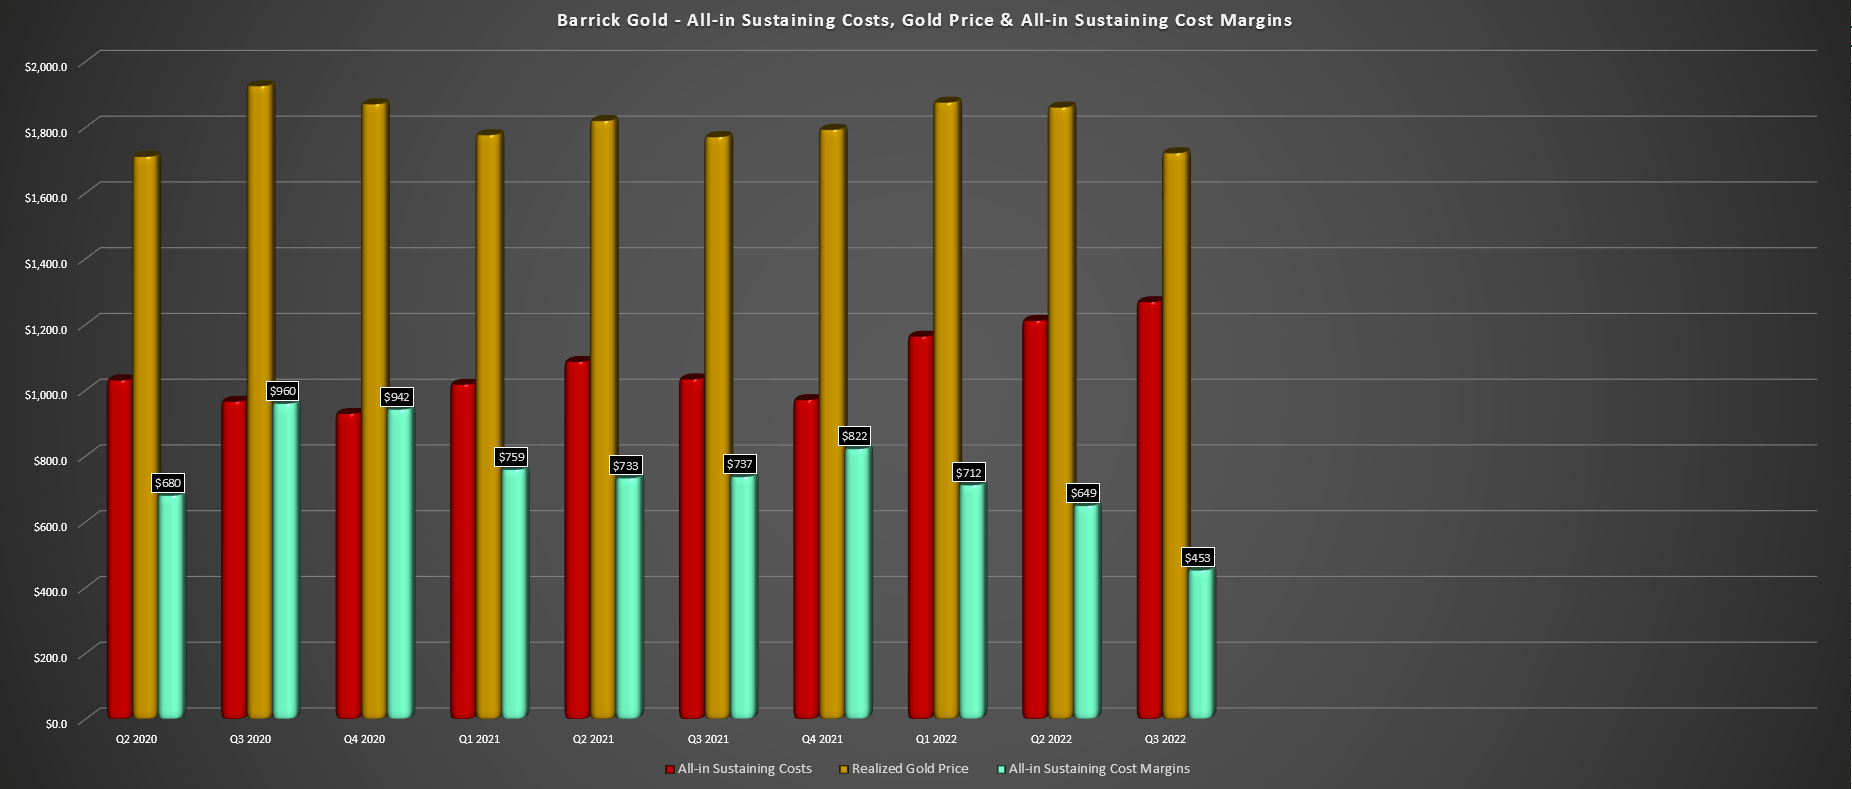
While these headline results are disappointing, it’s important to note that this is not reflective of the company; it’s simply an unprecedentedly challenging operating environment. Producers are dealing with lower gold prices, extreme inflationary pressures (fuel, steel, cyanide, power), and a tight labor market. Supply chain headwinds further exacerbated the higher input costs, making this year even more unusual than periods of solely elevated fuel prices. Finally, Barrick had a more expensive year from an attributable mine-site sustaining capital standpoint, putting further pressure on its all-in-sustaining costs. All that said, there are reasons to be optimistic that we’ve seen the peak.
In discussions on quarterly calls in Q3, many companies have noted that they are seeing some moderation in some areas from an inflationary standpoint, and freight costs appear to be cooling off as well. In addition, Barrick should see slightly higher production next year and lower sustaining capital, providing some relief from a cost standpoint. However, the real change will occur in 2024, with annual production set to increase to well over 4.5 million ounces, with an increased contribution from Goldrush, higher output from the PV Expansion, higher production from Turquoise Ridge, and the potential for additional contribution from Porgera (currently in care & maintenance, but we saw the recent incorporation of New Porgera Limited on September 22nd).
Barrick Gold Pour (Company Presentation)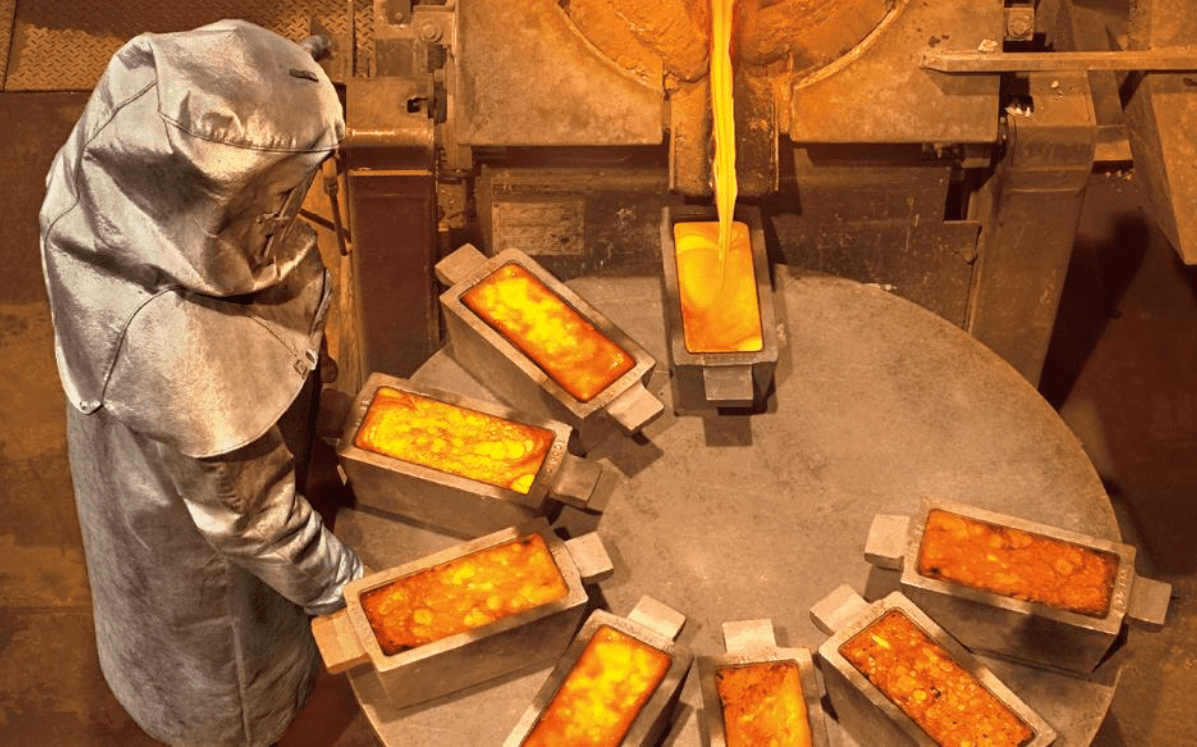
The combination of higher production, lower sustaining capital, and lower fuel prices than in 2022, where we saw spikes above $110.00/barrel, should lead to a dramatic improvement in costs, with the potential for Barrick’s costs to come in below $1,000/oz in FY2024. Obviously, some assumptions are baked in here, and a further and prolonged spike in fuel prices could impact these assumptions, as could the worsening of the supply chain or an even tighter labor market.
Fortunately, Barrick is likely an employer of choice in its jurisdictions due to its size. Plus, it benefits from scale (ability to invest in new technologies to lower costs and increase productivity, economies of scale, and is more effective at global procurement with a vast supplier network), making it one of the best-positioned names to survive this bear market if it continues and thrives when we come out the other end. Plus, its balance sheet is in great shape due to being conservative with its returns to shareholders and not engaging in expensive and over-priced M&A. In contrast, others could be in a difficult position if the gold price remains under pressure.
Barrick Gold – Net Debt, Free Cash Flow, Dividend (Company Filings, Author’s Chart)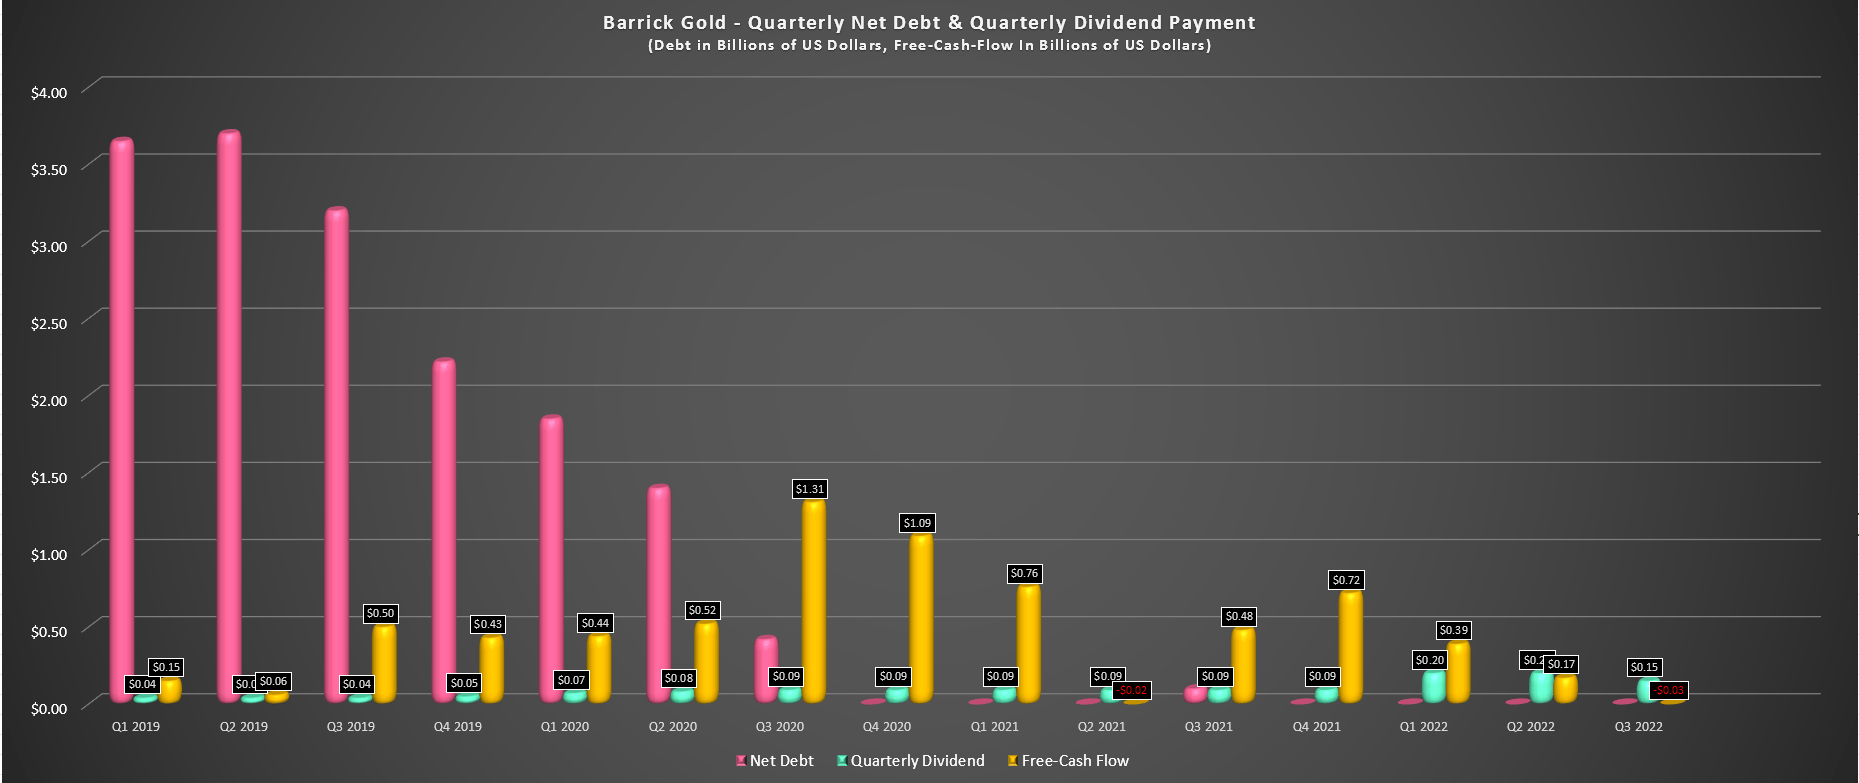
Some investors might believe that owning the smaller producers with the highest torque is the best move in a protracted cyclical bear market for gold, and this strategy has been extolled in previous cycles. The problem this time is that inflationary pressures and supply chain headwinds have led to a dramatic increase in costs, meaning that producers are getting hit on both ends. So, while owning a high-cost producer with a weaker balance might provide considerable torque, leverage works both ways, and owning low-quality names can severely impair one’s investment portfolio if these producers are forced to dilute shares heavily or shutter operations, as we’ve seen from Argonaut (OTCPK:ARNGF), Pure Gold (OTCPK:LRTNF), and Great Panther (OTC:GPLDF), and many others will follow if the gold price remains under pressure.
At the same time, as the risk of additional share dilution has increased for smaller and higher-cost producers, Barrick is aggressively buying back shares; in fact, it’s repurchased 1.0% of its float year-to-date, with ~$670 million left available under its buyback program. So, while Barrick is in a position to retire more shares and potentially scoop up very attractive assets near the trough of the gold market due to its extreme patience, many smaller producers are in rough shape. Hence, while Barrick looks low-risk and high-reward at current prices, other names are still high-risk, high-reward, and high-risk/high-reward is not an investment thesis – it’s gambling. Let’s look at Barrick’s valuation:
Valuation & Sentiment
Based on an estimated 1756 million shares at year-end and a share price of US$13.10, Barrick trades at a market cap of $23.0 billion, a dirt-cheap valuation for a diversified producer that owns several of the world’s Tier-1 mines. From a P/NAV standpoint, this violent pullback has left the stock trading at ~0.70x P/NAV, a very rare discount to net asset value for a company of its size. Meanwhile, from a cash flow standpoint, the stock is now trading at just ~5.6x FY2023 estimates ($2.34), and I would consider these estimates to be quite conservative as they assume minimal recovery in the gold price. Using what I believe to be a fair multiple of 10.0x cash flow on FY2023 estimates, I see a fair value for Barrick of $23.40 – 78% upside from current levels.
Barrick Gold – Historical Cash Flow Multiple (FASTGraphs.com)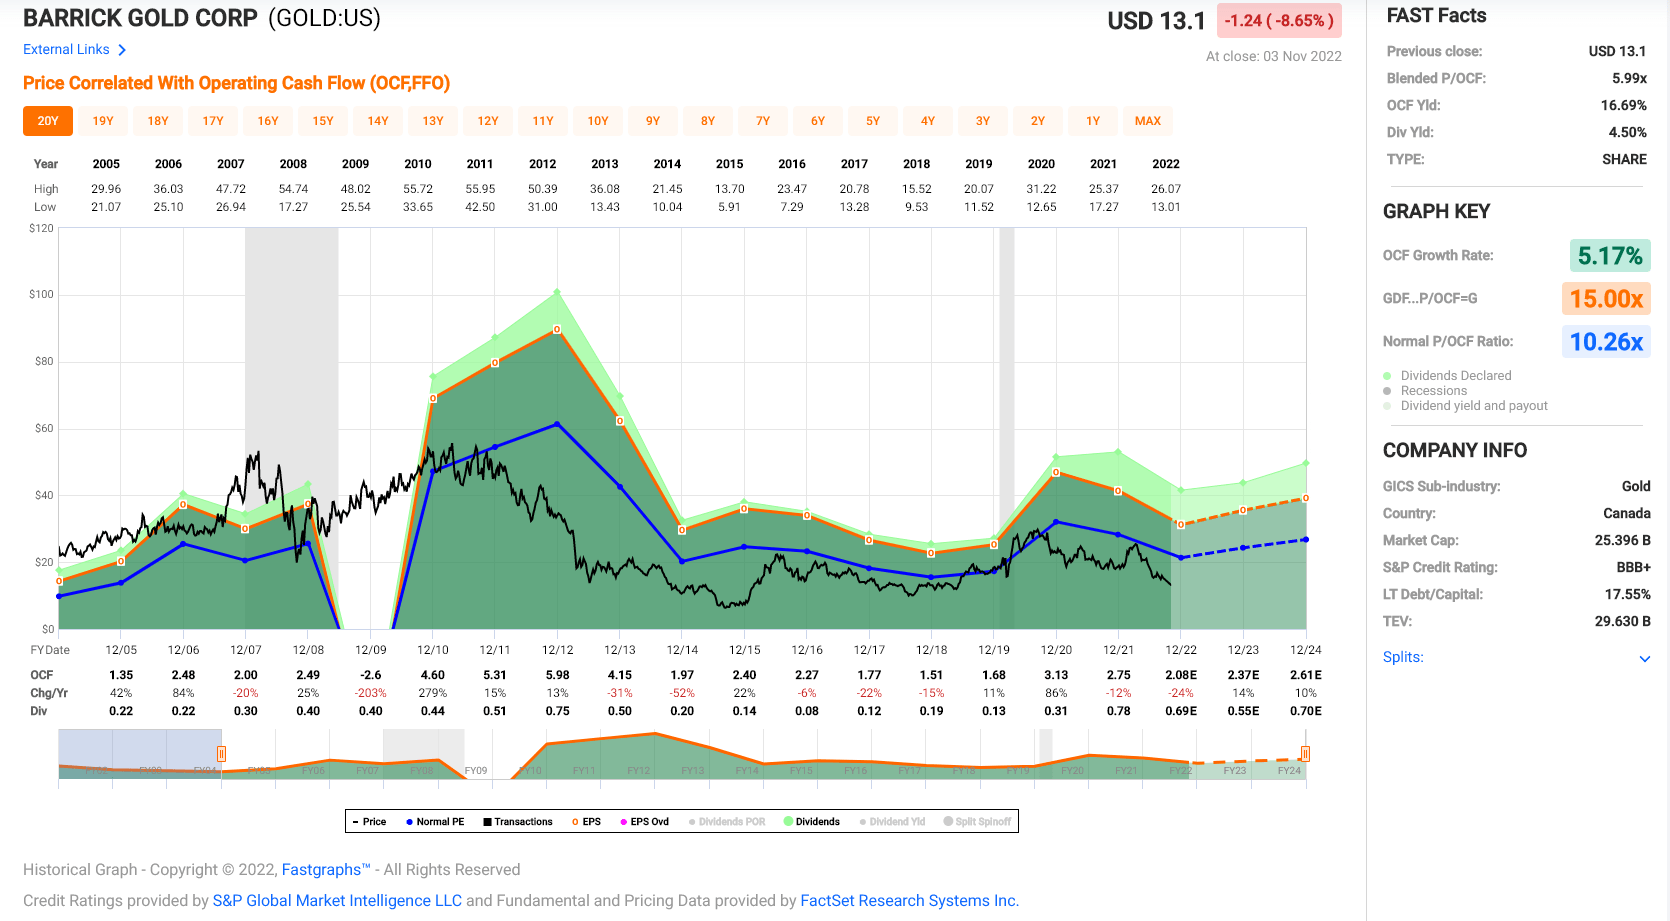
Some investors might argue that the gold price can head much lower from here, and there are no guarantees that it will recover immediately. However, when gold’s returns are deeply negative on a trailing 1-year and 2-year basis, and bullish sentiment has been incinerated, it’s time to be cautiously optimistic and even bullish. Unfortunately, this isn’t how it typically works because human nature never changes. So, when gold’s 1-year trailing returns are strong, like in Q3 2020, the average investor is most bullish, and it’s precisely the time to be much less aggressive and open to taking profits or tightening up stops. This is especially true when many sites are trotting out articles calling for $3,000/oz gold or higher.
Today, we have the opposite setup. It’s difficult to find any calls for $2,000/oz, let alone $1,800/oz, and most investors are looking down, expecting the metal to reach at least $1,500/oz before it’s bottomed. While anything is possible, markets rarely move in straight lines, even if the metal does have a future date with the $1,500/oz level before this bear market is resolved. Besides, when gold as an asset is this loathed historically, its forward returns are quite strong, as we’ve seen in past periods of extreme pessimism. The below chart highlights this, with periods of extreme pessimism leading to average forward 1-year draw-ups of ~23.0%. If this were to play out similarly, gold would trade up to $1,970/oz by November 2023.
Gold Sentiment & Forward Draw-ups (Daily Sentiment Index Data, Author’s Chart & Notes)
This time could be different, and there are no guarantees. However, for investors that employ a contrarian strategy to investing, I continue to see this pullback in Barrick as a gift, even if I have been admittedly early. My conviction in Barrick being a gift below US$14.00 is reinforced by the fact that it’s likely to be an aggressive buyer of its shares at current levels, increasing demand for the stock in the market. In addition, the stock is the most hated that I’ve seen it since 2018, and it looks to be already pricing in $1,500/oz or lower gold prices. So, if the gold prices can recover, the stock is the equivalent of an elastic band stretched to maximum tension over the next year.
Summary
It’s easy to point out the negatives when a sector is hated, and a group of stocks is down 60% from its highs, but there’s not much value in this from an investment standpoint. Instead, when a sector is this beaten up, it makes sense to try and discern whether we could see a shift in sentiment in the future to change the current dynamics, and in my view, this looks highly likely. The reason is that Barrick’s production has nowhere to go but up from here, its unit costs look to have peaked in Q2/Q3 2022, and the gold price is likely a tailwind, with it being the most hated it’s been in years.
For these reasons, I believe now is the time to be bullish on Barrick, especially with a very experienced, quite successful (Randgold), and highly disciplined CEO at the helm, Mark Bristow. In fact, the lower gold price has made Barrick much more attractive than 95% of the sector, given that this business will survive if gold prices do head lower, while many others that engaged in expensive M&A and have all-in costs north of $1,800/oz could have a tough road ahead. To summarize, I see this pullback below US$14.00 as a gift, and I continue to add to my position on weakness.
Be the first to comment