

agnormark/iStock via Getty Images
The Q1 Earnings Season for the Gold Miners Index (GDX) is just around the corner, and one of the first companies to report its preliminary results was Barrick Gold (NYSE:GOLD). Overall, Barrick had a decent start to 2022, with production at 22.5% of its guidance mid-point, with Q1 expected to be the weakest quarter of the year. Fortunately, higher metals prices picked up some of this slack, and this tailwind will remain in place for Q2. With Barrick’s technical picture improving and the company potentially shifting to growth later this decade, I continue to see Barrick as a solid buy-the-dip candidate.
Nevada Gold Mines LLC – Operations (Company Presentation)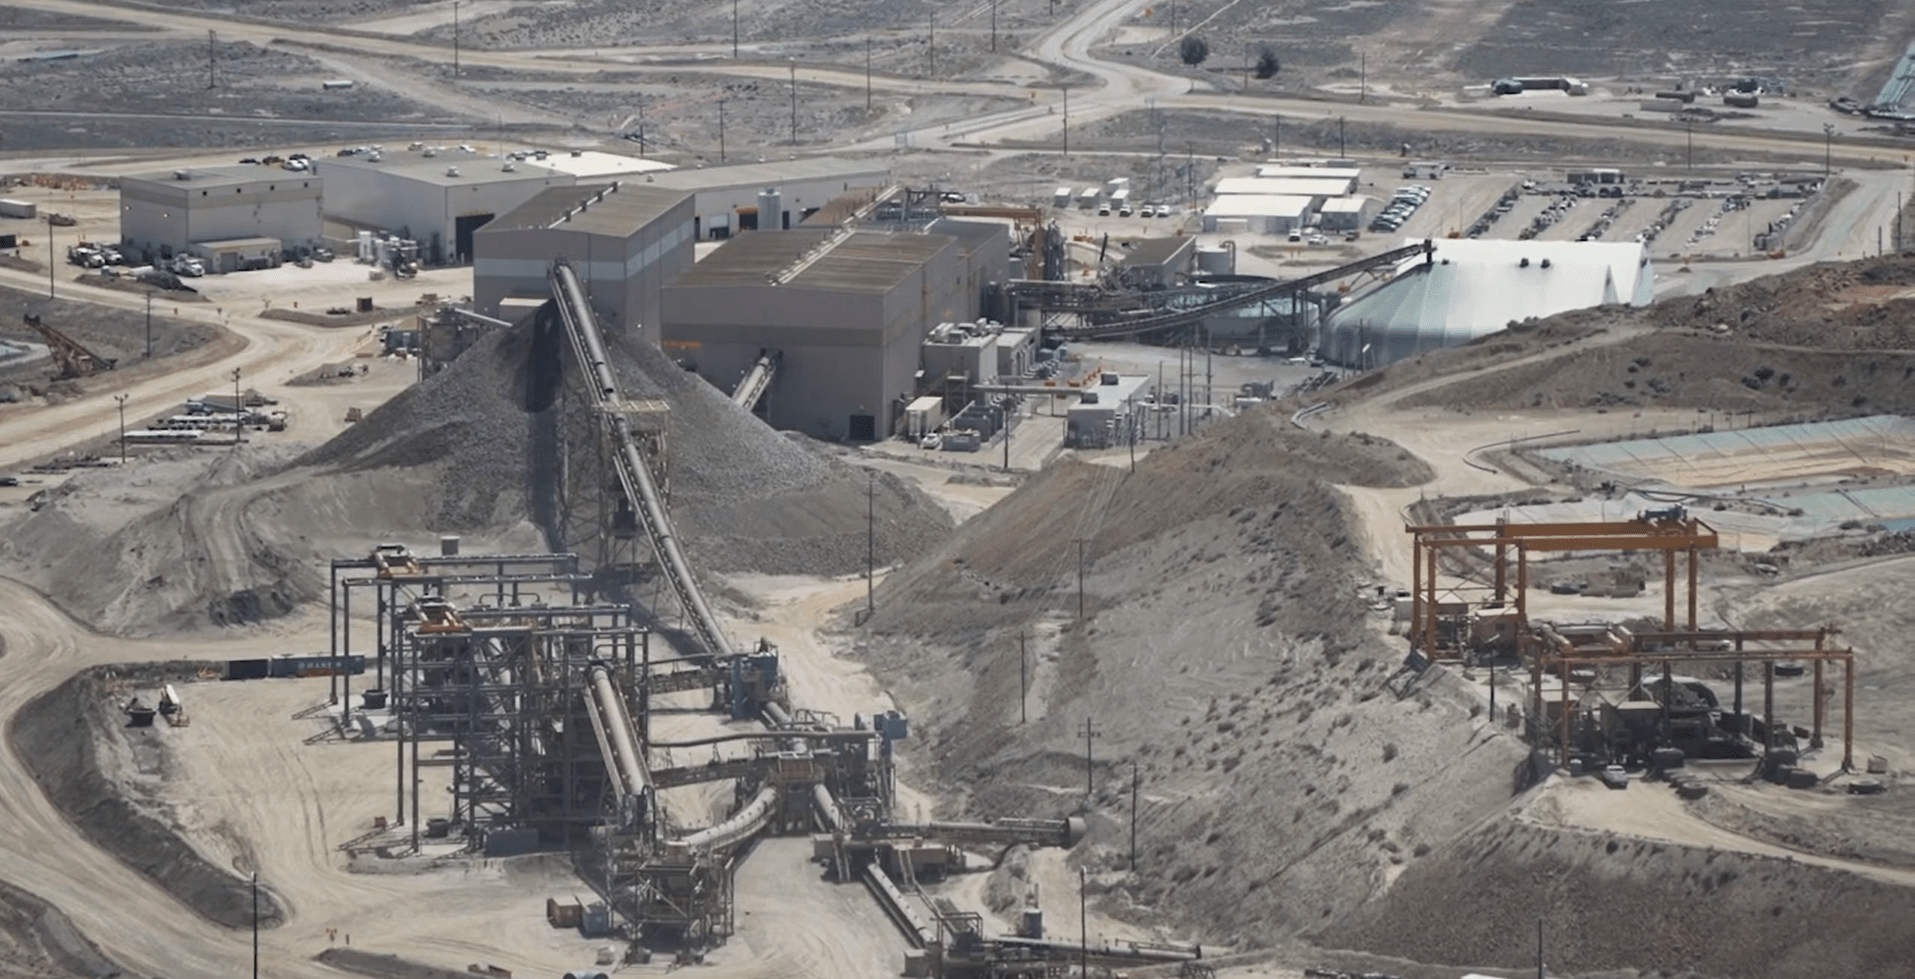
Barrick Gold released its preliminary Q1 results last week, reporting quarterly production of ~990,000 ounces of gold and ~101 million pounds of copper. This translated to a ~10% decline in gold production and an 8% increase in copper production year-over-year. While this might appear disappointing at first glance on the gold side of the business, it’s important to note that the weak Q1 production was largely expected. Besides, even with the softer results, Barrick is well on its way to meeting its guidance mid-point of ~4.4 million ounces of gold. Let’s take a closer look at the quarter below:
As shown in the chart below, Barrick saw its lowest gold production in more than two years, with production coming in at just ~990,000 ounces, down from ~1.10 million ounces in Q1 2021 and ~1.25 million ounces in Q1 2020. However, it is essential to note that there have been changes in the portfolio since then, with Barrick seeing a ~60,000-ounce headwind from Porgera relative to the ~1.25 million ounces produced in Q1 2020, given that the operation remains offline currently following a revised framework with the Papua New Guinea Government. Adjusting for Porgera, which will come back into the portfolio, production is not down nearly as much on a two-year basis.
Barrick Gold – Quarterly Gold Production (Company Filings, Author’s Chart)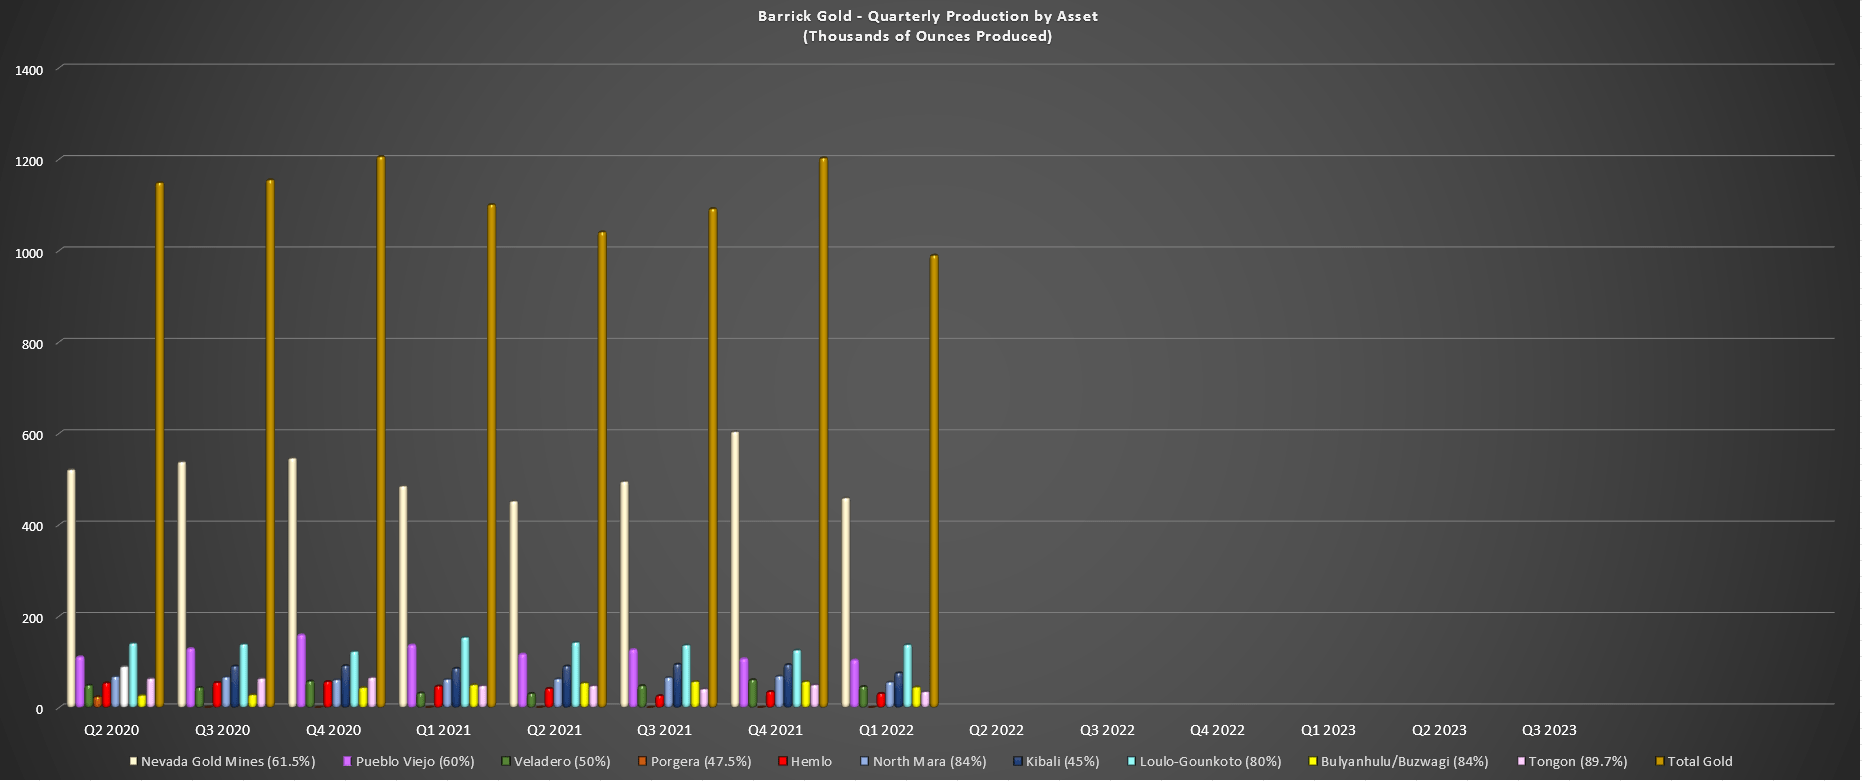
If we dig into the chart a little closer, we can see that it was a solid quarter for Loulu-Gounkoto with ~138,000 ounces produced, but this still led to a decline year-over-year due to tough comps (Q1 2021: ~154,000 ounces). Meanwhile, Veladero had a better quarter, with production up over 40% to ~46,000 ounces. Unfortunately, at nearly every other asset, production was lower. The largest decliners were Pueblo Viejo at ~104,000 ounces vs. ~137,000 ounces in Q1 2021, Tongon at ~35,000 ounces vs. ~48,000 ounces, and Hemlo at ~31,000 ounces vs. ~47,000 ounces.
The lower production at Tongon was related to mine sequencing, while Kibali’s production was more than 10% lower due to planned maintenance. Elsewhere, in Canada, Hemlo has continued to struggle, with the company working on getting that mine back on track. This was partially out of Barrick’s control due to COVID-19 restrictions making it difficult to get Australian teams to Canada, slowing down the ramp-up of underground development. In its Q3 2021 results, the company noted that it could take up to 18 months to pick up momentum at this asset, which fortunately is a very small contributor to Barrick’s production profile.
Barrick Gold – Nevada Attributable Gold Production (Company Filings, Author’s Chart)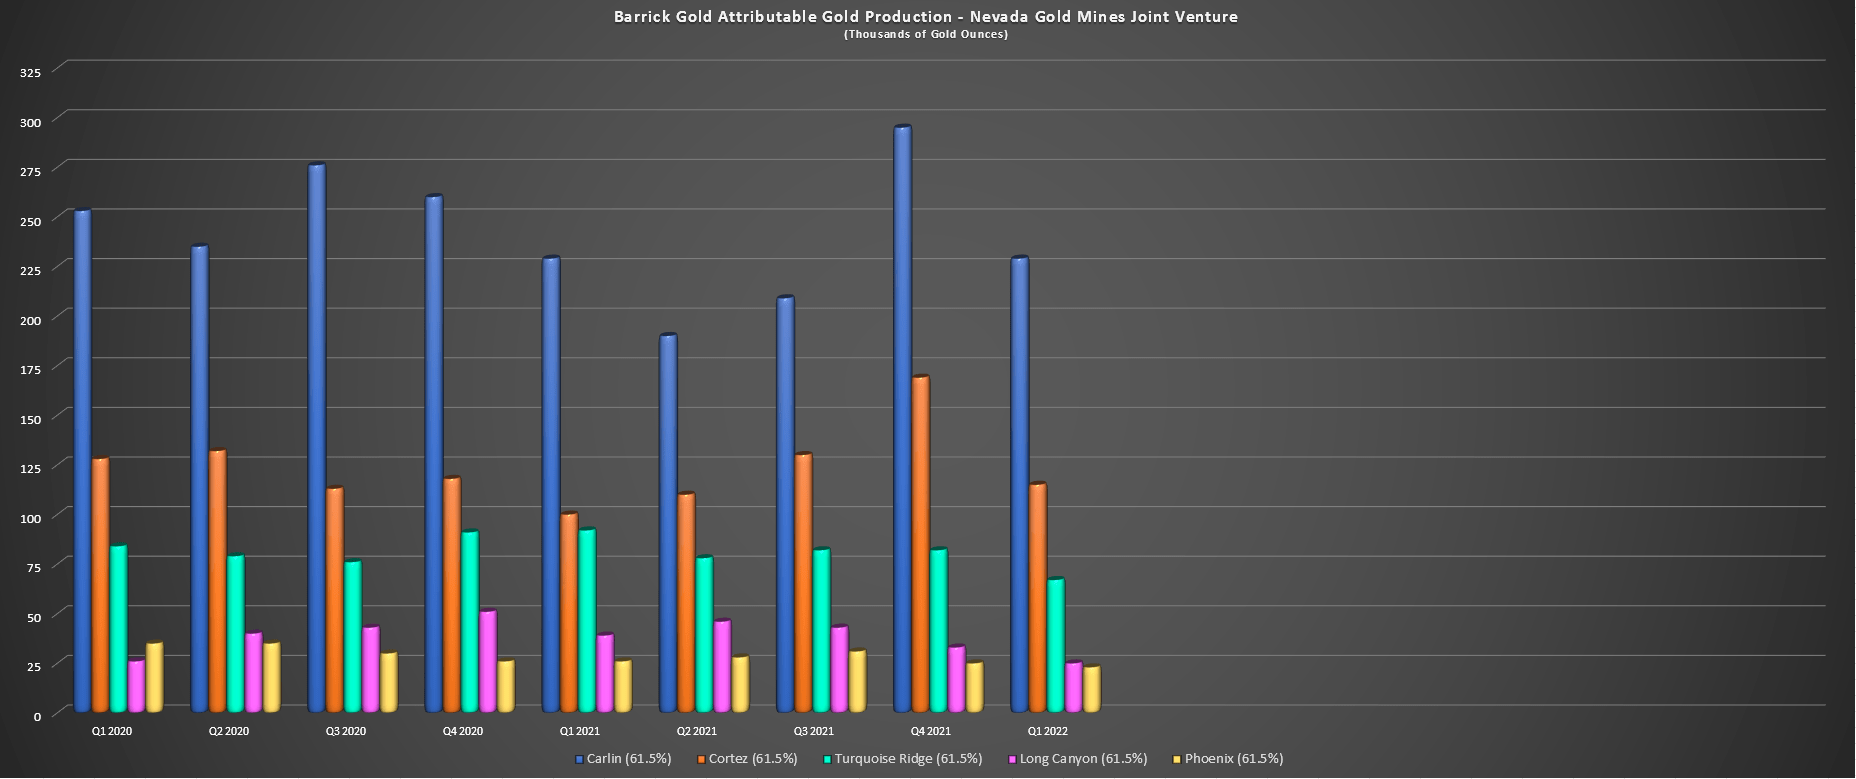
Finally, moving over to Barrick’s shared Nevada operations, it was a much weaker quarter, with just ~459,000 ounces from its share of Nevada Gold Mines LLC, down from ~485,000 ounces in Q1 2021. The lower production in the period was mostly related to Turquoise Ridge, which saw a decline in production due to planned maintenance, with just ~67,000 ounces produced in Q1 (Q1 2021: ~92,000 ounces). Meanwhile, Phoenix and Long Canyon contributed a combined ~48,000 ounces in Q1 2022, down from ~64,000 ounces in Q1 2021.
The two largest contributors, Cortez and Carlin, saw flat production on a year-over-year basis. This was related to the depletion of stockpiled high-grade underground ore processed in Q4 following the mechanical mill failure at the Goldstrike roaster in Q2 of last year. The good news is that while gold production was much lower year-over-year, Barrick will see much of this slack picked up by the higher gold price. The reason is that Barrick’s average realized gold price came in at $1,877/oz in Q1 2022, up from $1,777/oz in Q1 2021, offsetting most of the 10% decline in year-over-year production.
Gold Futures Price (TC2000.com)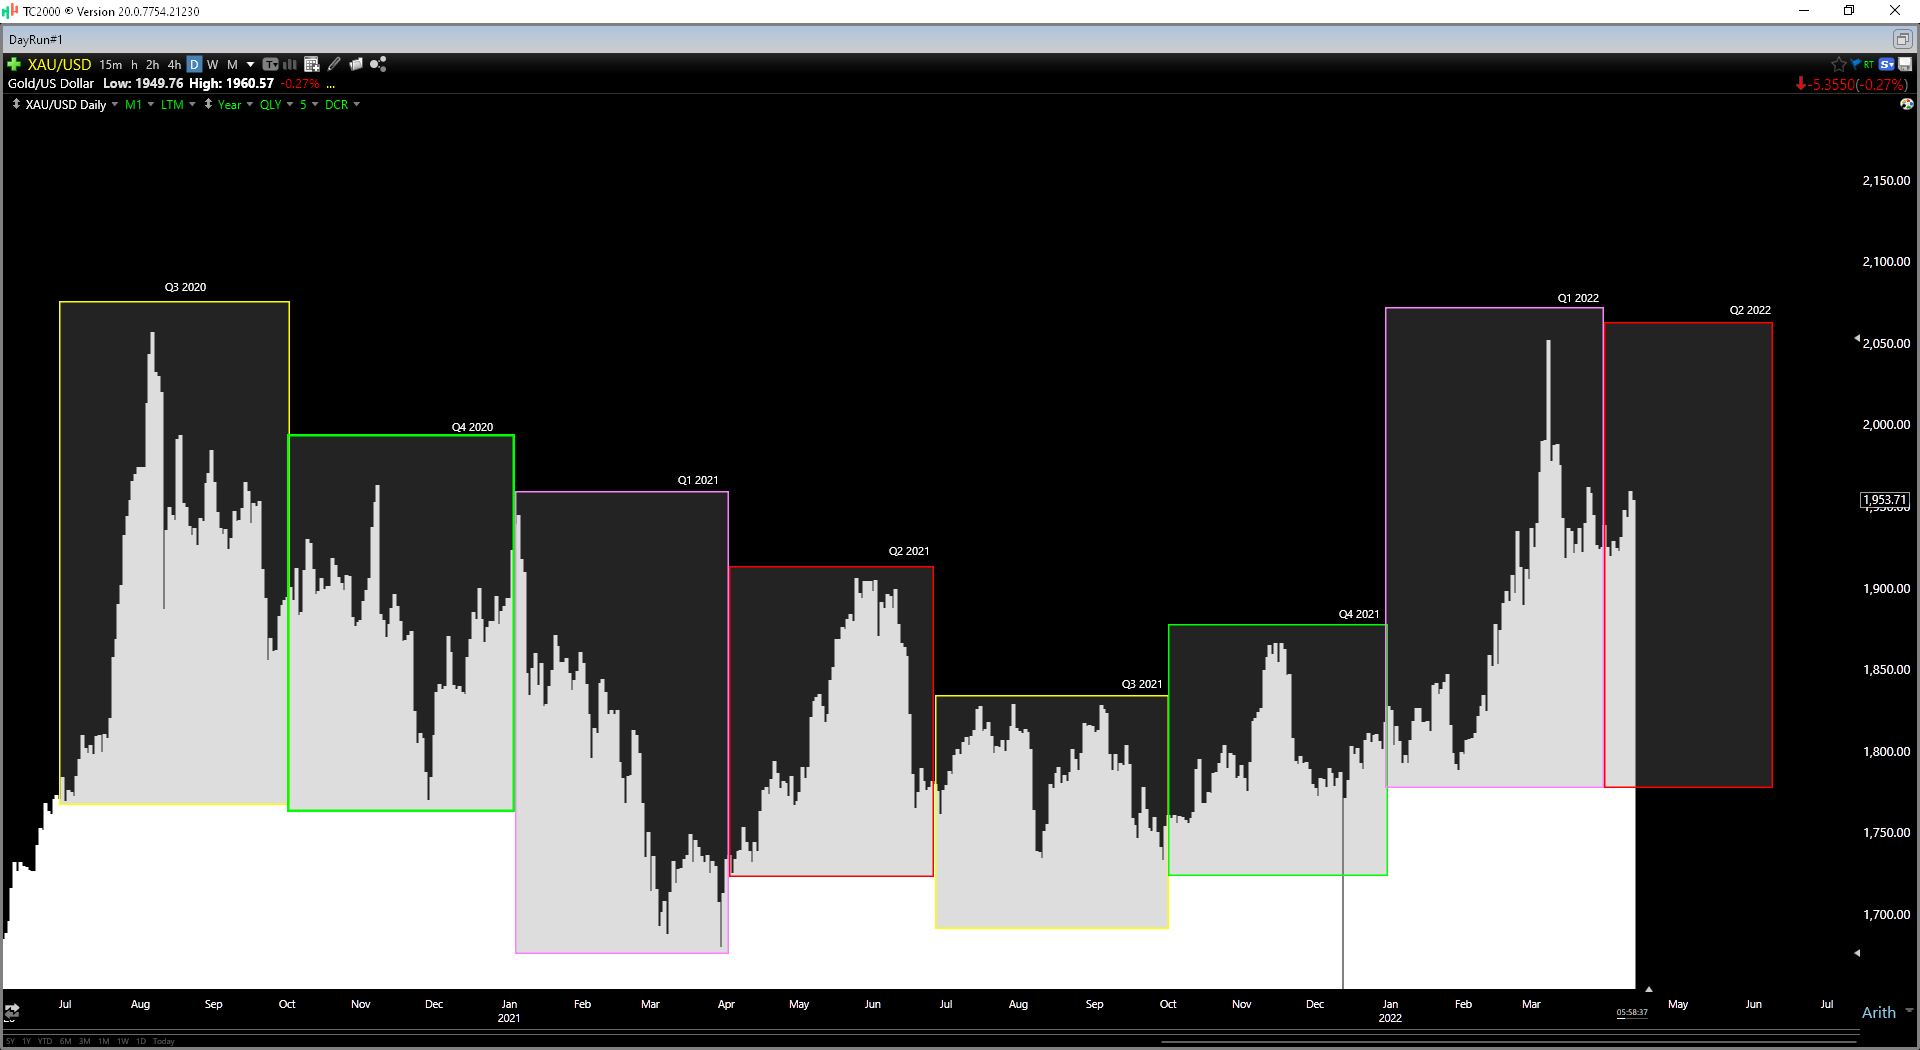
Copper Production
Moving to Barrick’s copper business, which has been a solid contributor thanks to higher copper prices, we saw an 8% increase in copper production to 101 million pounds. This was helped by higher production at all three of its assets, with Zalvidar and Jabal Sayid combining for ~44 million pounds vs. ~42 million pounds last year. Meanwhile, although Lumwana saw a sequential decline in production to 57 million pounds, this figure was up year-over-year and will continue to improve as the year progresses as throughput increases. The combination of higher production and a 10% higher realized copper price will lead to another very strong quarter for the copper business in Q1.
Barrick Gold – Quarterly Copper Production (Company Filings, Author’s Chart)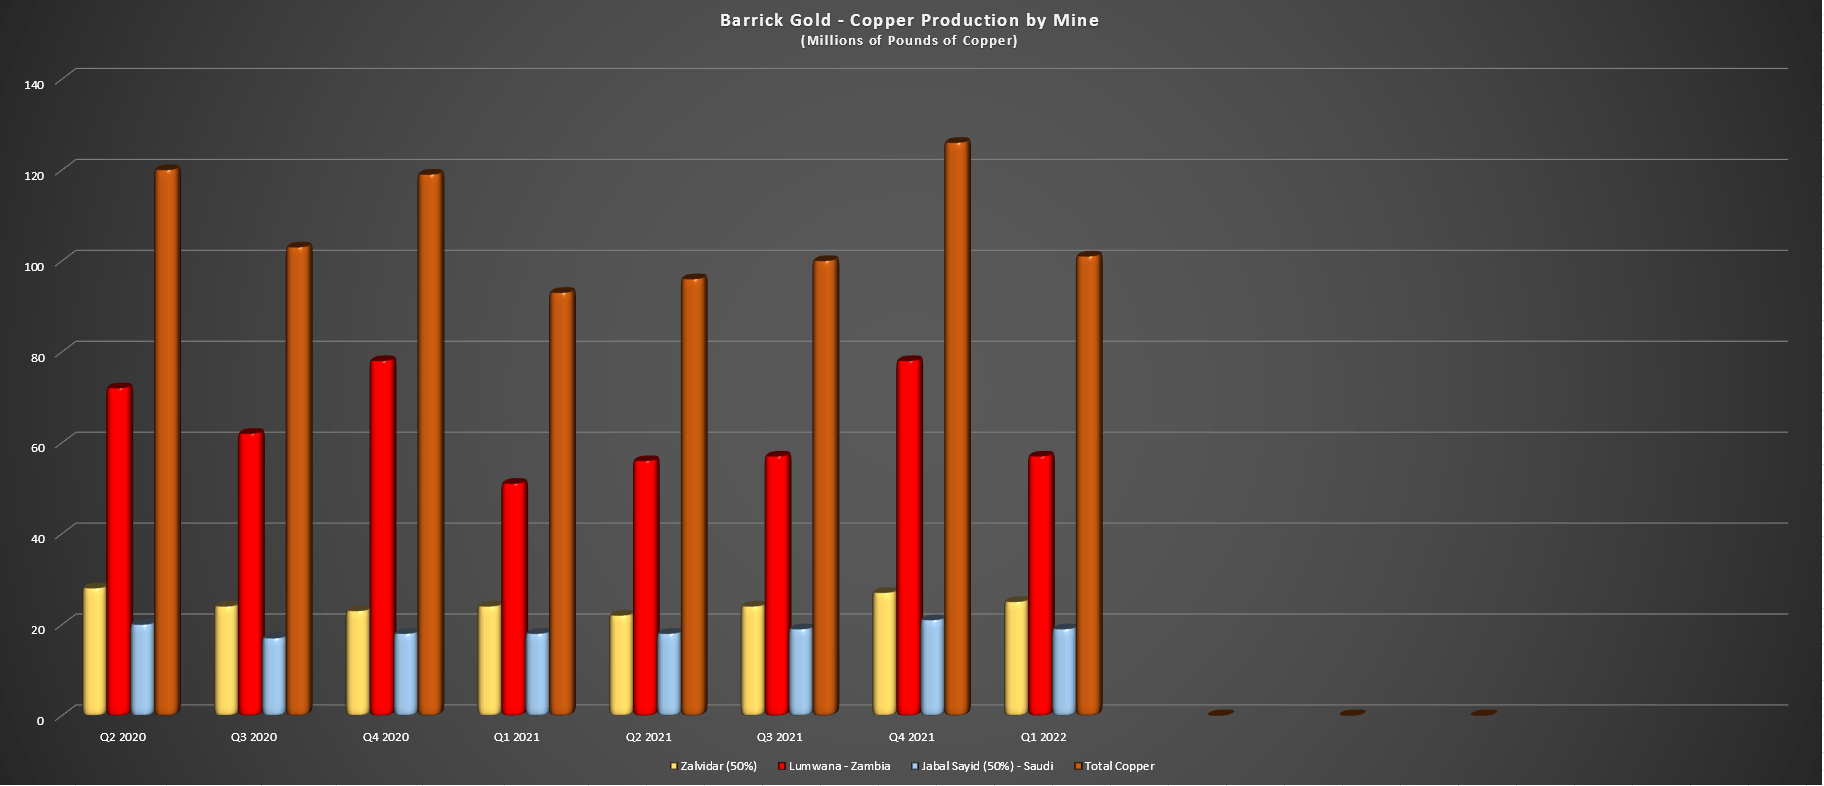
Margins
Looking at Barrick’s AISC margins below, we can see that margins have declined since Q3 2020. This is due to Barrick being up against difficult comps related to reduced impacts from inflationary pressures in the Q3 2020 period relative to more recent periods and a record gold price logged in Q3 2020. Based on Barrick guiding for much higher costs in Q1 2022 vs. Q4 2021 due to the lower production and sales, I would expect further margin compression in Q1 2022, with AISC margins likely to come in below $725/oz. The good news, though, is that this trend should begin to reverse in Q2 2022.
Barrick Gold – Quarterly AISC & AISC Margins (Company Filings, Author’s Chart & Estimates)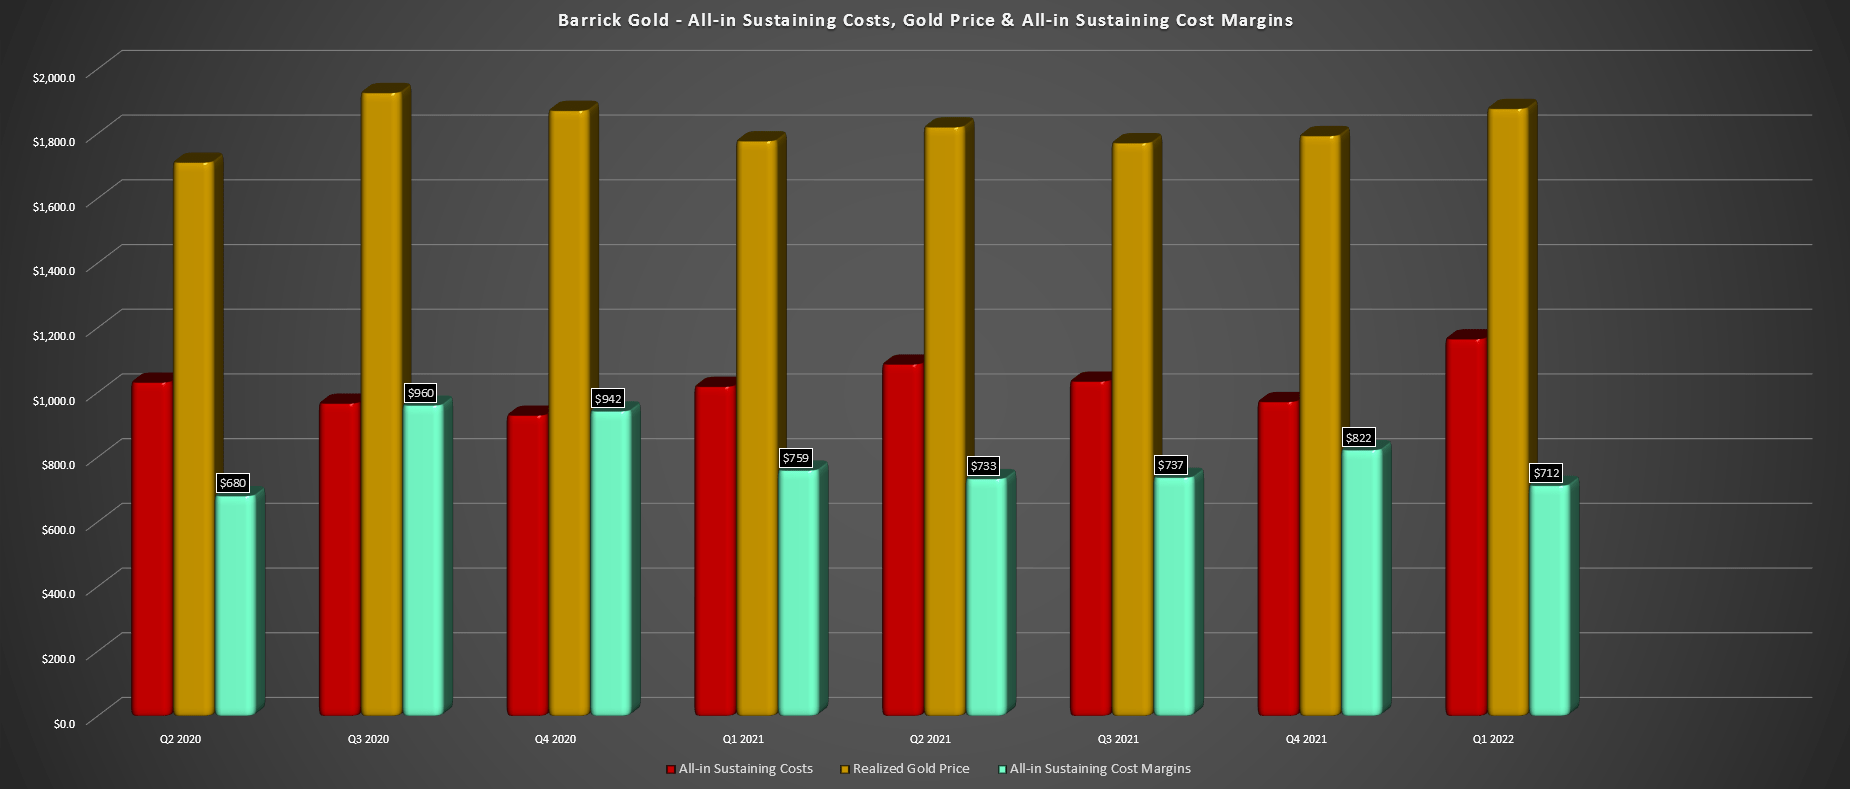
This is because Barrick should enjoy an average realized gold price above $1,910/oz in Q2 2022, while its all-in sustaining costs will decline sharply on a sequential basis, helped by higher sales. This should push AISC margins back above the $800/oz mark, in line with or better than Q4 2021 levels. Meanwhile, with a strong second half planned, and assuming the gold price can hold above the $1,875/oz level, we should see slight margin expansion in H2 2022. So, while I expect weaker margins in Q1, I don’t see any reason to get hung on this short-term margin compression.
Reko Diq
While Barrick has invested heavily in the past couple of years to maintain visibility into its long-term production profile, the one missing piece was growth, which can be quite difficult for a company of its size, similar to Newmont (NEM). However, the surprise positive development at Reko Diq with a new framework in place could fix this issue. This is because Barrick has noted that it could begin production at Reko Diq by 2027, with this massive copper-gold porphyry project potentially adding up to 200,000 ounces of gold and 350 million pounds of copper per annum to its production profile over a 40+ year mine life.
Reko Diq Project – Pakistan (Company Presentation)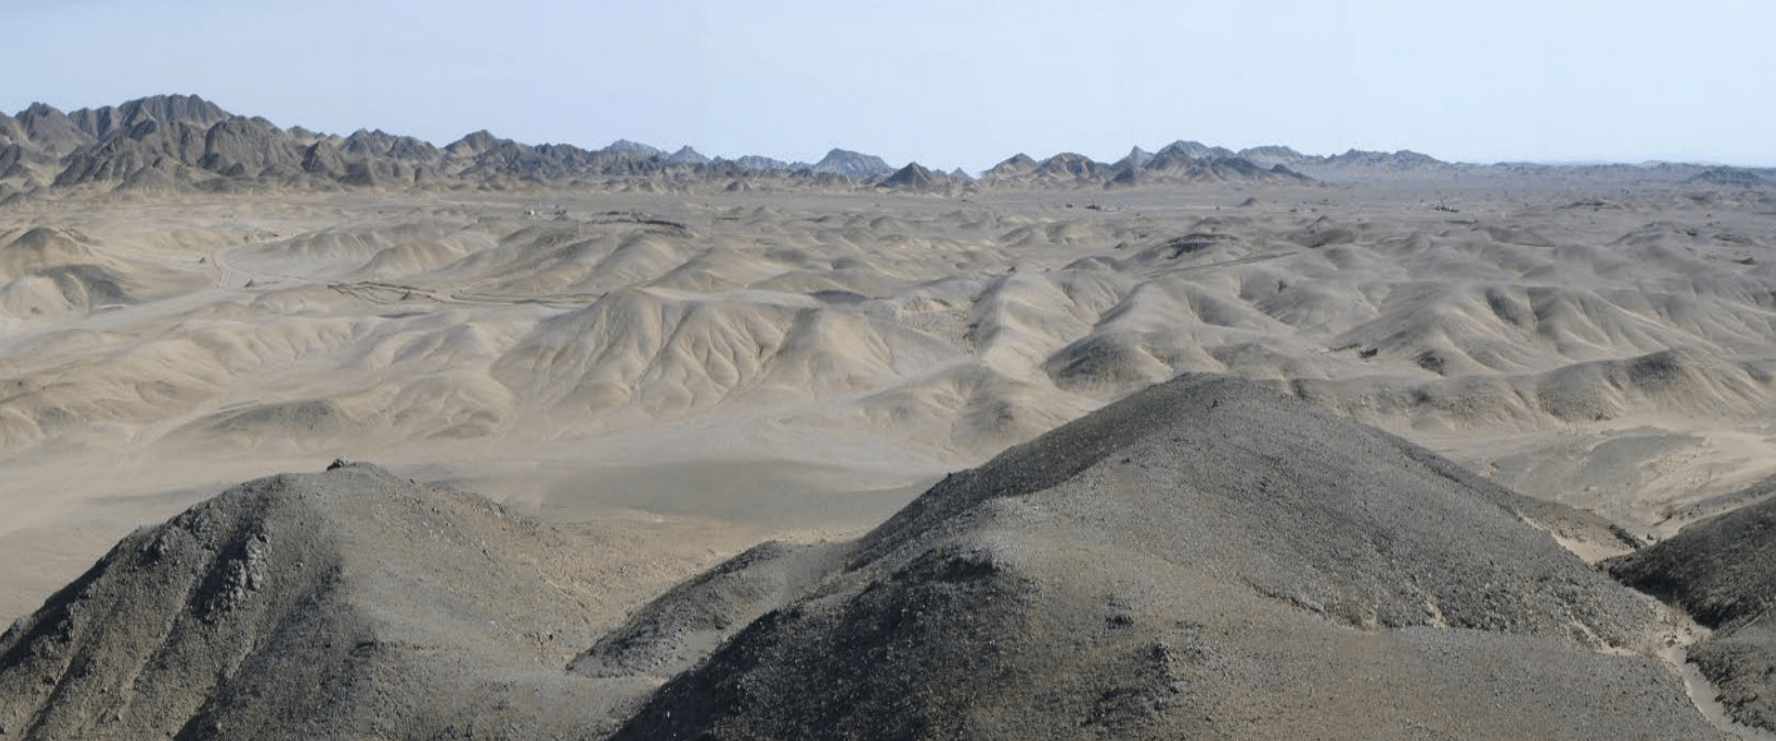
While this wouldn’t move the needle materially from a gold production standpoint, based on its 2026 outlook of just over 4.5 million ounces of gold, it would certainly move the needle from a copper standpoint. This is because Barrick’s FY2026 production under its 5-year outlook was expected to come in at ~500 million pounds but could grow to ~850 million pounds of copper within ten years once Phase 2 is in production (a parallel circuit producing copper-gold concentrate).
At current copper prices, which could be much higher post-2030, this would provide a significant boost to revenue, with the potential for revenue of more than $1.50 billion per annum from Reko Diq’s copper contribution alone. Given that there’s no recent study completed on the project and production is at least five years away (~10 years away for full production in Phase 2), I believe it’s premature to assign more than $850 million in attributable net asset value to the project when factoring in a higher discount rate. However, even at this figure, this increases Barrick’s net asset value by nearly $0.50 per share, placing its total net asset value near $20.00 per share.
Based on what I believe to be a fair multiple of 1.40x P/NAV, I see a fair value for the stock of just over $28.00 per share. Of course, the other bonus outside of a minor increase in net asset value is that Barrick appears like it could have some growth in the copper department, even if its gold production profile may remain relatively flat looking out to 2030, at least under its current assumptions. For NovaGold (NG), this recent discussion on Reko Diq and what appears to be a strong commitment towards the project could be a negative, pushing out potential production at its Donlin Creek Project.
Number of Primary Gold Discoveries (Minex Consulting, Q4 2019) Average Grade of Gold Mined in the World (MinEx Consulting, Mudd (2010))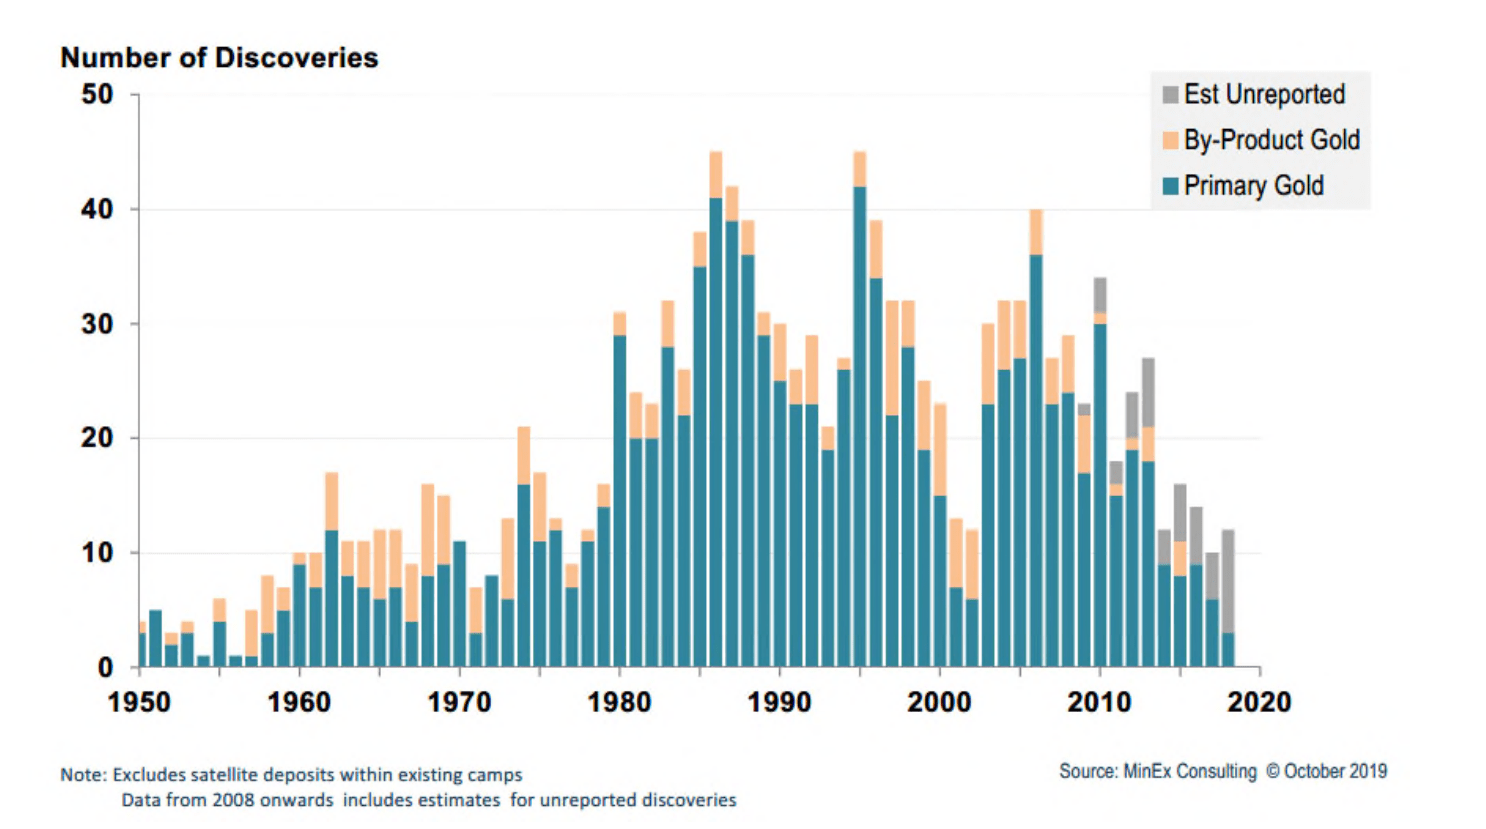
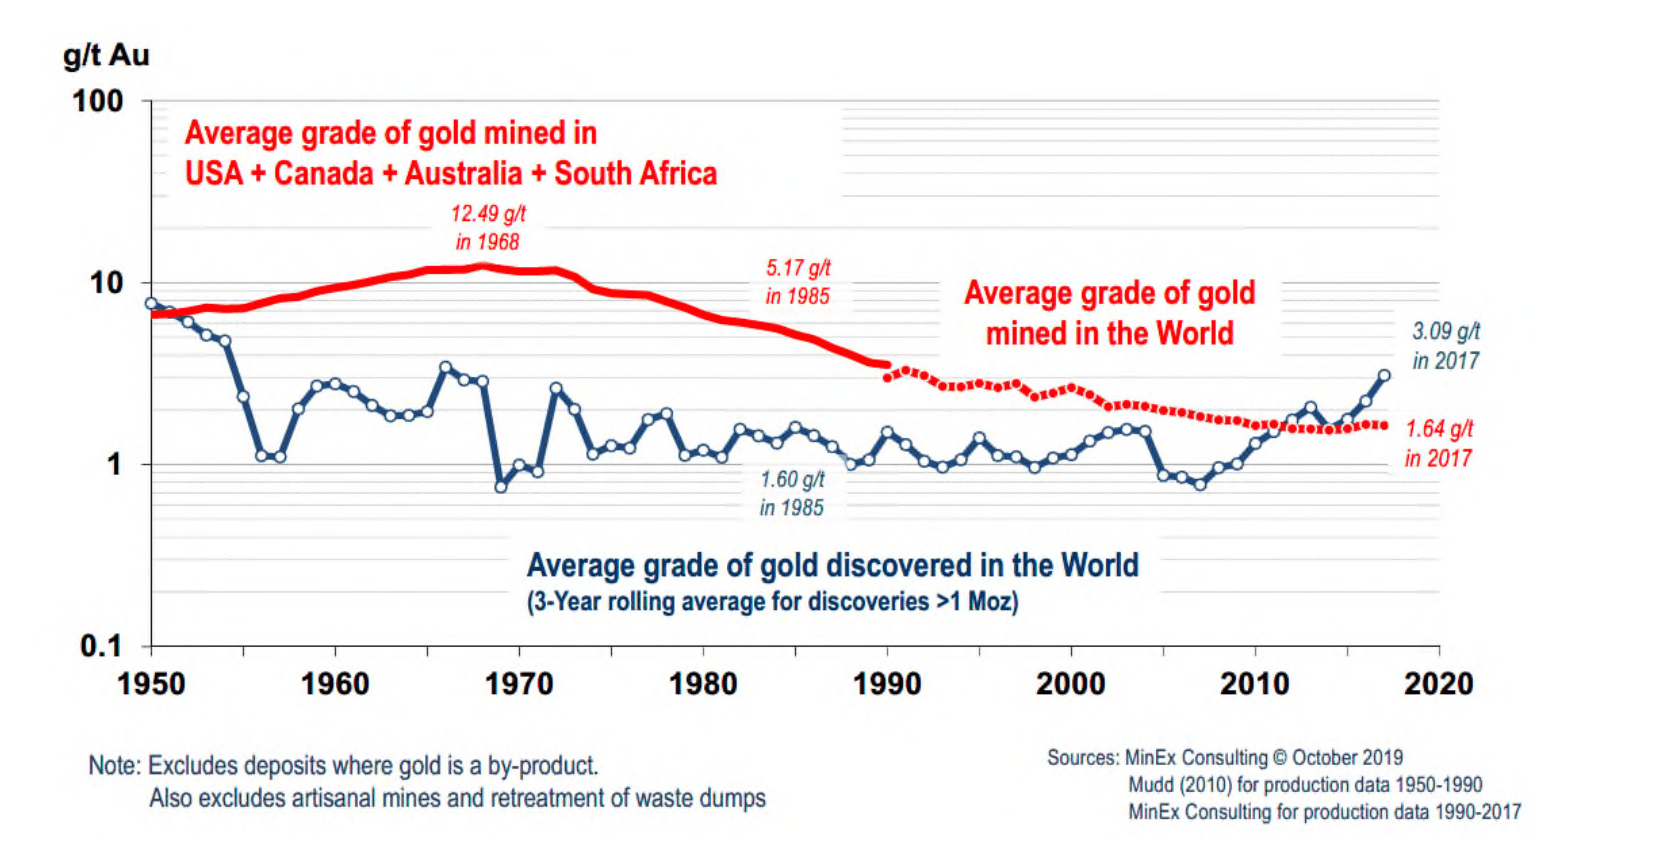
While this growth profile still pales compared to other large producers like Agnico (AEM), which could grow production by 30% by 2030, this is an upgrade for Barrick, which has been otherwise thought of as a no-growth company. This is not a knock against it, given that it is extremely difficult to grow production long-term for a ~5 million-ounce producer. The reason is that it’s very challenging to maintain grades at existing operations, and major new gold discoveries are becoming less significant each year, with much of the “low hanging fruit” already discovered. This is despite increased exploration spending since 2016. So, any potential growth for a company of Barrick’s size would be an impressive feat, and Reko Diq may be the answer.
Technical Picture
Looking at Barrick’s monthly chart below, the best time to own the stock has been when it’s been trending higher above its monthly moving averages (highlighted by the green shaded area). These periods have, in some cases, led to power trends (1986-1994) with a ~51% annualized return, and in other cases, they’ve provided respectable returns (10% annualized from Q2 1995 to Q4 1996). Meanwhile, while not all breaks below the monthly moving averages (red shaded areas) have been disastrous, some have been very turbulent, with a negative 40% annualized return in the 1997-1998 period and a similar return in the 2012-2015 bear market.
Barrick Gold – Monthly Chart (1986-2003) (TC2000.com)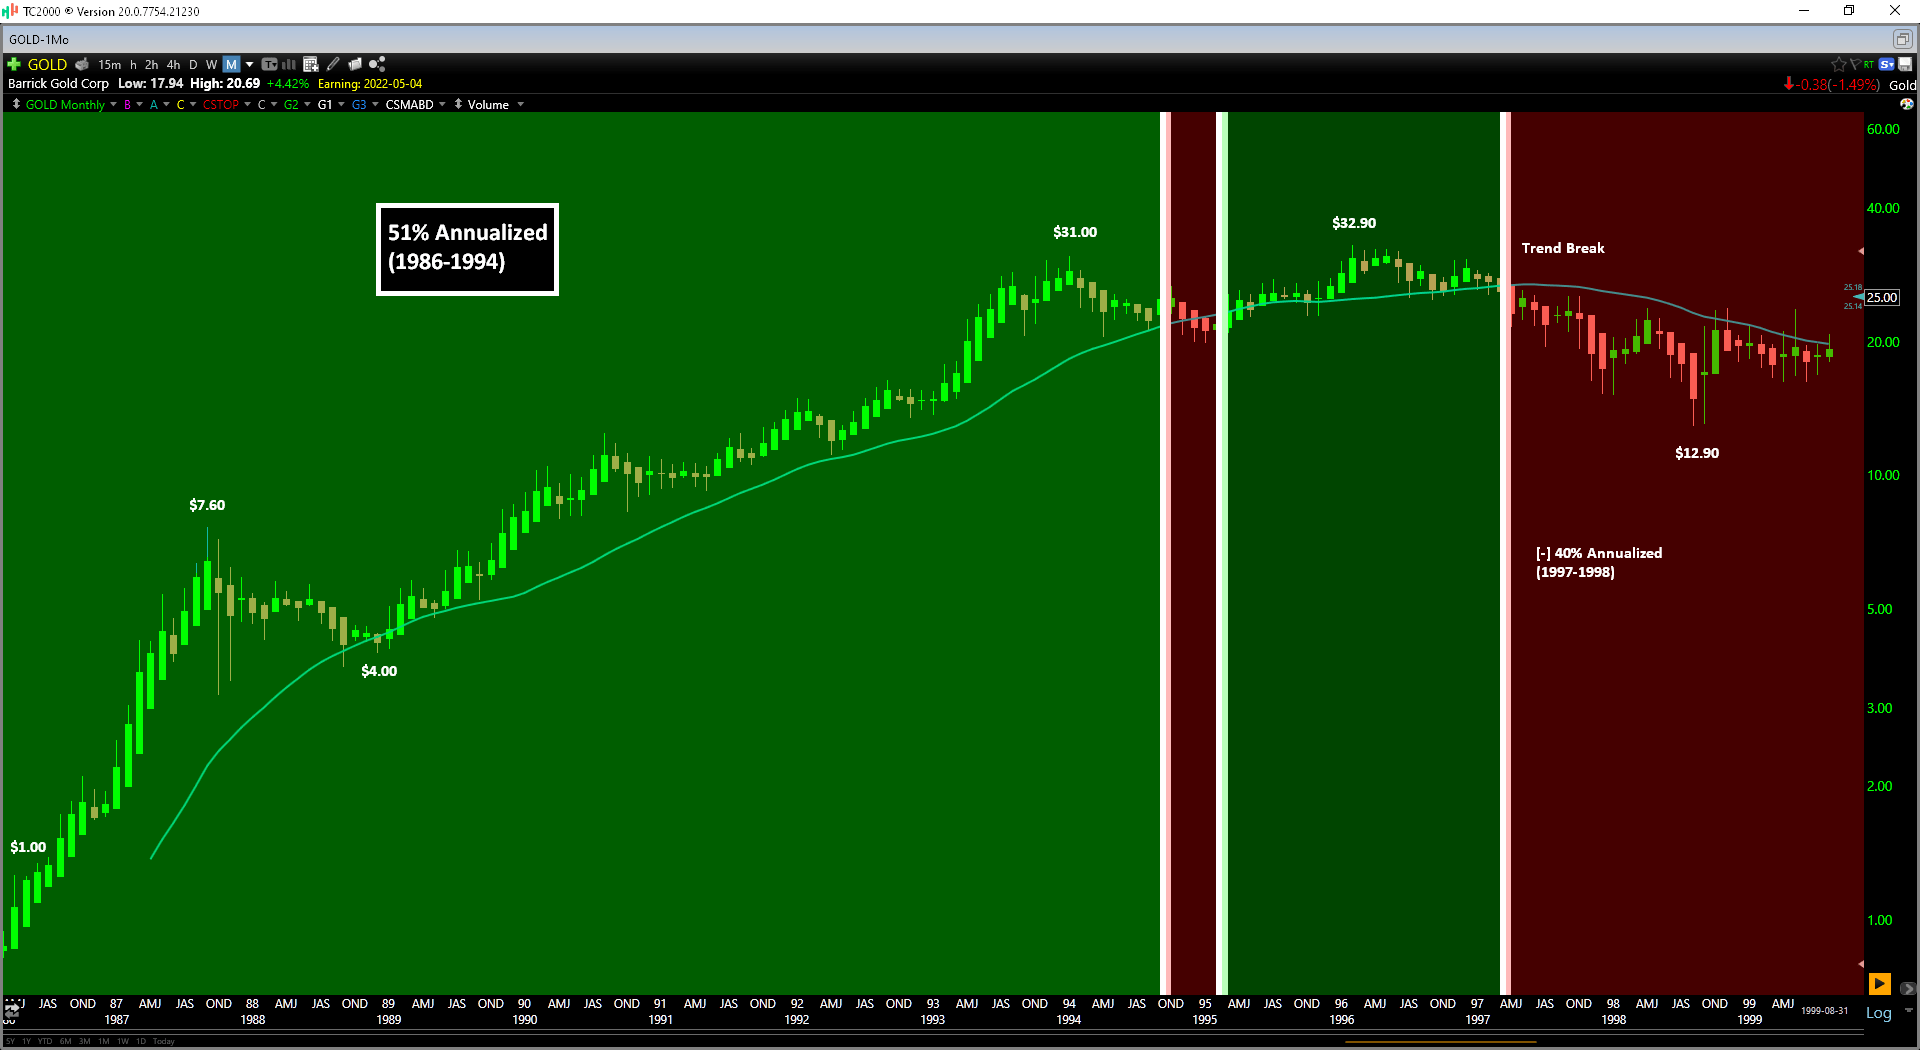
Fortunately, as of March’s close, Barrick has moved back into this favorable zone, reclaiming its key moving averages on March’s close. While this certainly doesn’t guarantee another power trend like the 1986-1994 period, it does increase the probability of sharp pullbacks being bought. We saw this in late 2016 and Q1 2020, with dips to this moving average being bought up immediately. Barrick’s monthly moving average is currently sitting near $21.20, suggesting that this is the likely floor for the stock medium-term if we do see a sharp pullback.
Barrick Gold – Monthly Chart (TC2000.com)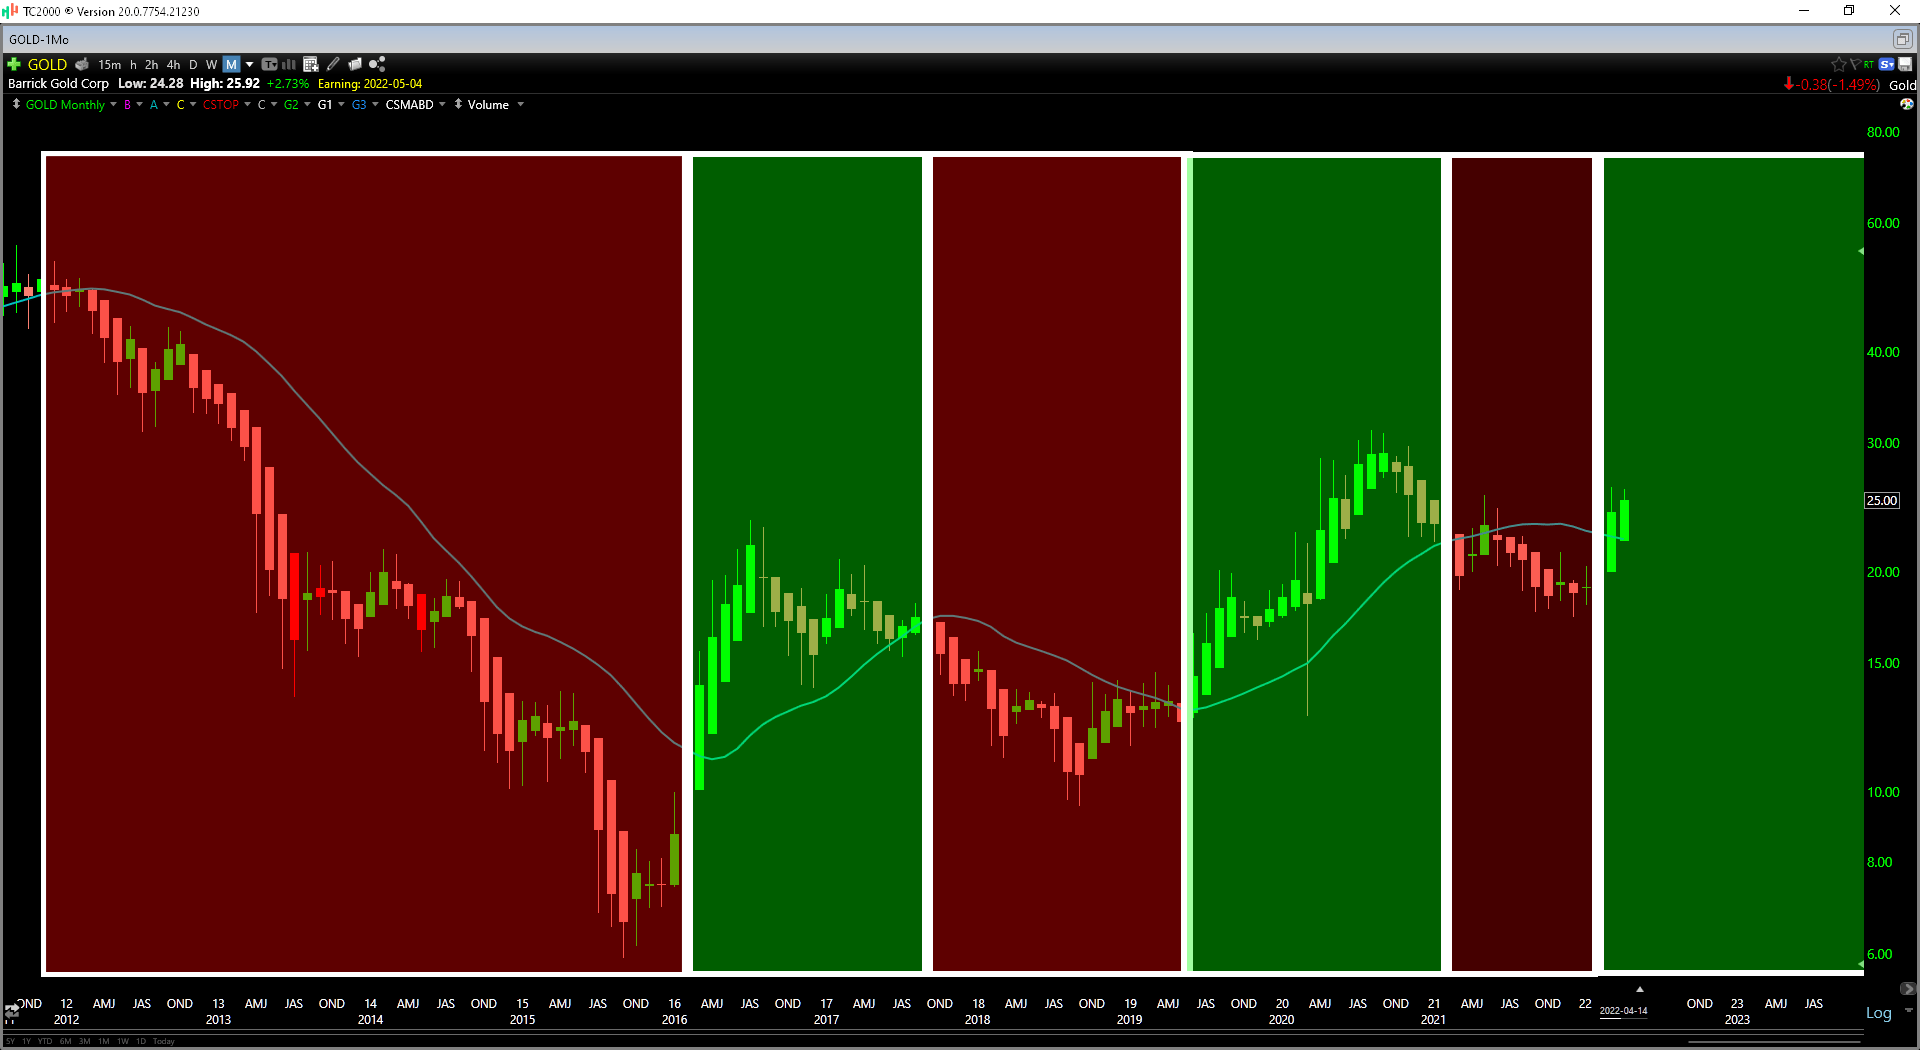
Overall, Barrick had a satisfactory start to the year from a production standpoint, and while margins will decline sharply on a sequential basis in Q1, I would ignore the weak Q1 results. This is because output will steadily increase post-Q1, the stock has reclaimed upside momentum, and it may be able to move back to growth later this decade with the addition of Reko Diq. Given this favorable outlook, combined with a more generous dividend framework, I see Barrick as a Hold. If we were to see a sharp pullback as we head into a weaker seasonal period for GDX in the summer, I would view this as a buying opportunity.
Be the first to comment