

eyegelb
It’s been a rough Q2 earnings season for the Gold Miners Index. While many producers were able to hide mediocre performance in a rising gold environment, chinks in the armor of many producers have been exposed in a rising cost/falling gold price environment. However, B2Gold (NYSE:BTG) has been one of the few exceptions, being a company that serially over-delivers, and 2022 should be no different, at least in areas under the company’s control. Given B2Gold’s continued discipline, operational excellence, and very bright future in Mali, which isn’t given enough credit by the market, I would view further weakness below $3.25 as a buying opportunity.
B2Gold Operations (Company Presentation)
Q2 Production
B2Gold released its Q2 results this week, reporting quarterly production of ~223,600 ounces of gold, a more than 5% increase from the year-ago period. This was driven by a solid quarter from Fekola, which included record mill throughput, and a better-than-expected quarter from Masbate despite grades being slightly below budget. The result was higher revenue due to a higher average realized gold price and increased sales volumes (~2220,100 vs. ~214,400) at costs well below the industry average (~$1,111/oz).
B2Gold – Quarterly Production (Fekola & Group) (Company Filings, Author’s Chart)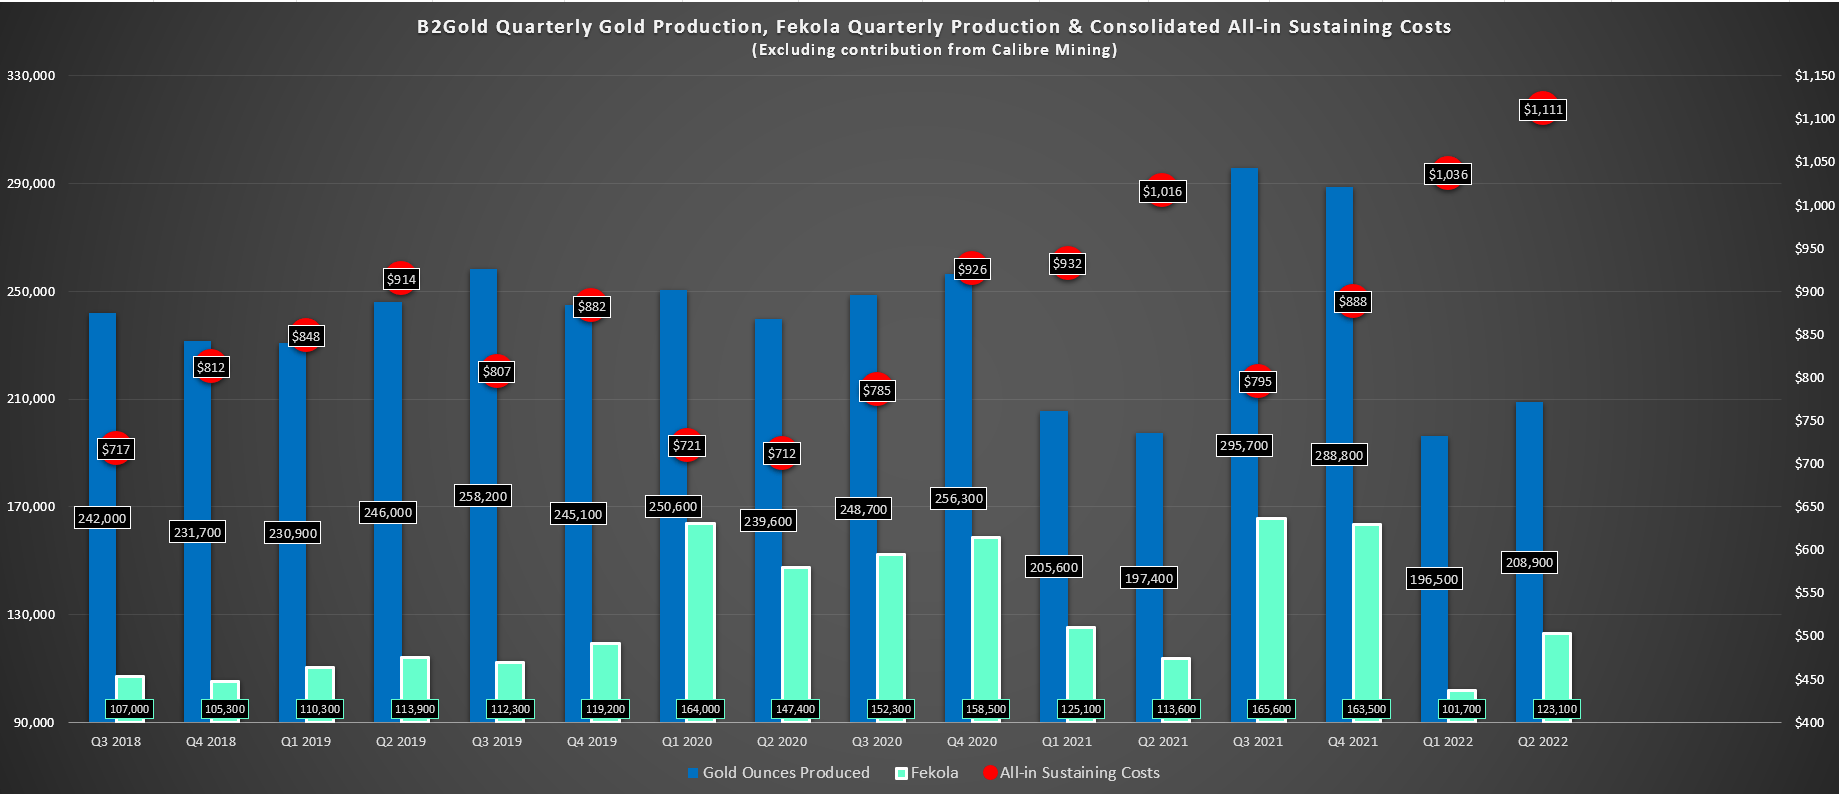
If we look at production in more detail, Fekola’s output may appear weak in the above chart at ~123,100 ounces, but this is because production is second-half weighted with stronger grades expected in H2. During Q2, the operation benefited from record throughput (2.42 million tonnes per annum) due to continued optimization of the grinding circuit. However, this was offset by lower than budgeted grades related to using lower-grade stockpiles. The major takeaway here is that the 9.0 million tonnes per annum estimate could end up being a tad conservative, with the Fekola mill operating at an annualized pace of ~9.7 million tonnes per annum in Q2, well above nameplate capacity.
Fekola Operations (Company Website)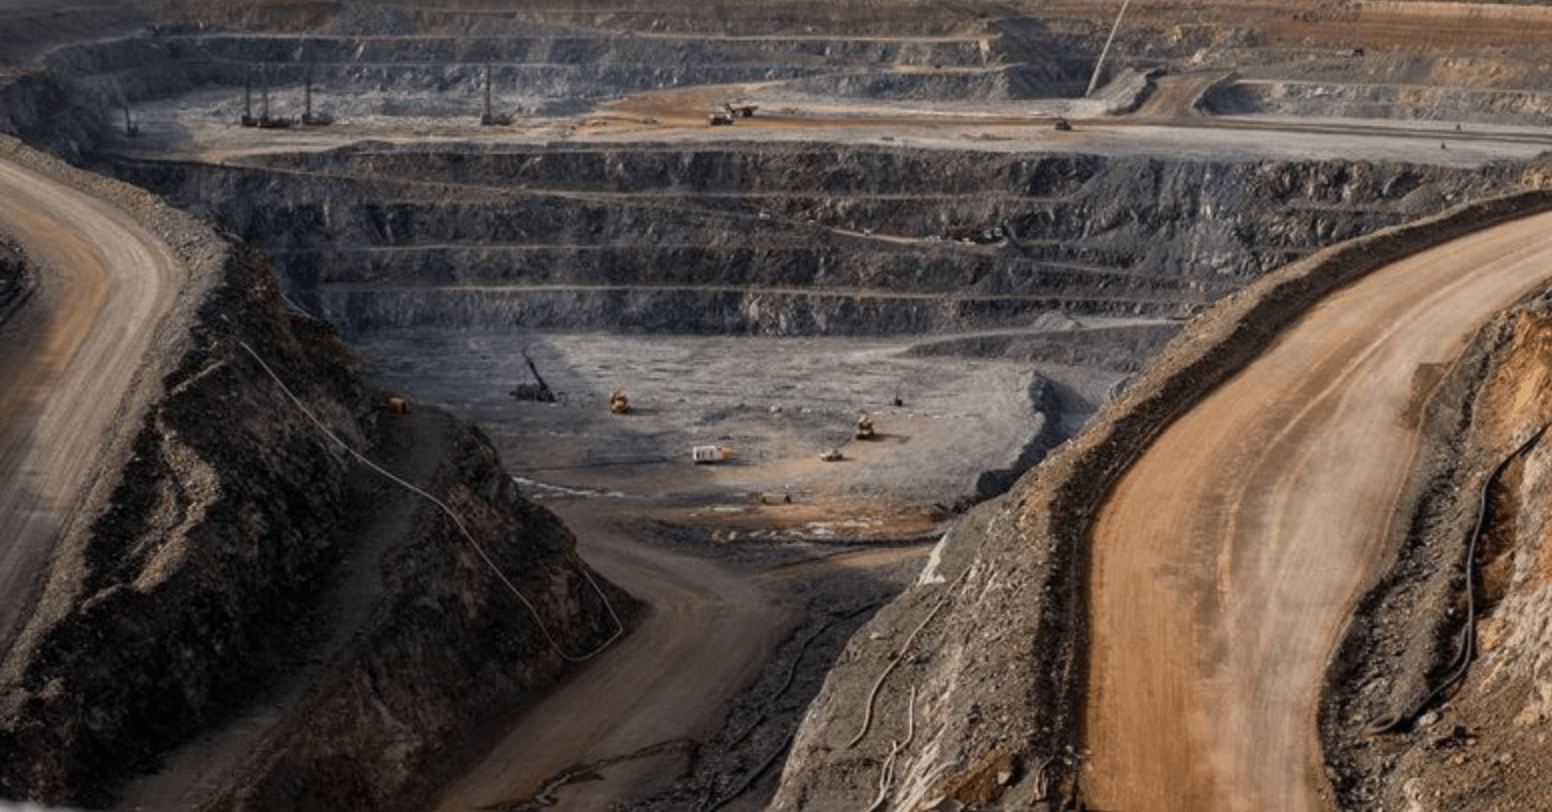
Despite the lower-than-budgeted grades, all-in sustaining costs [AISC] came in well below the industry average and below budget at $949/oz. This was partially related to the timing of sustaining capital expenditures and better than budgeted gains on the settlement of fuel derivatives. Still, this continues to be one of the best mines globally, capable of producing 550,000+ ounces per annum at costs below $900/oz (FY2022 guidance: $840/oz to $880/oz). It’s worth noting that gold recovery rates were slightly lower than planned (92.4%), which was a minor headwind due to the availability of lime. This issue has since been rectified, with all reagents now available.
B2Gold – Quarterly Production by Mine (Company Filings, Author’s Chart)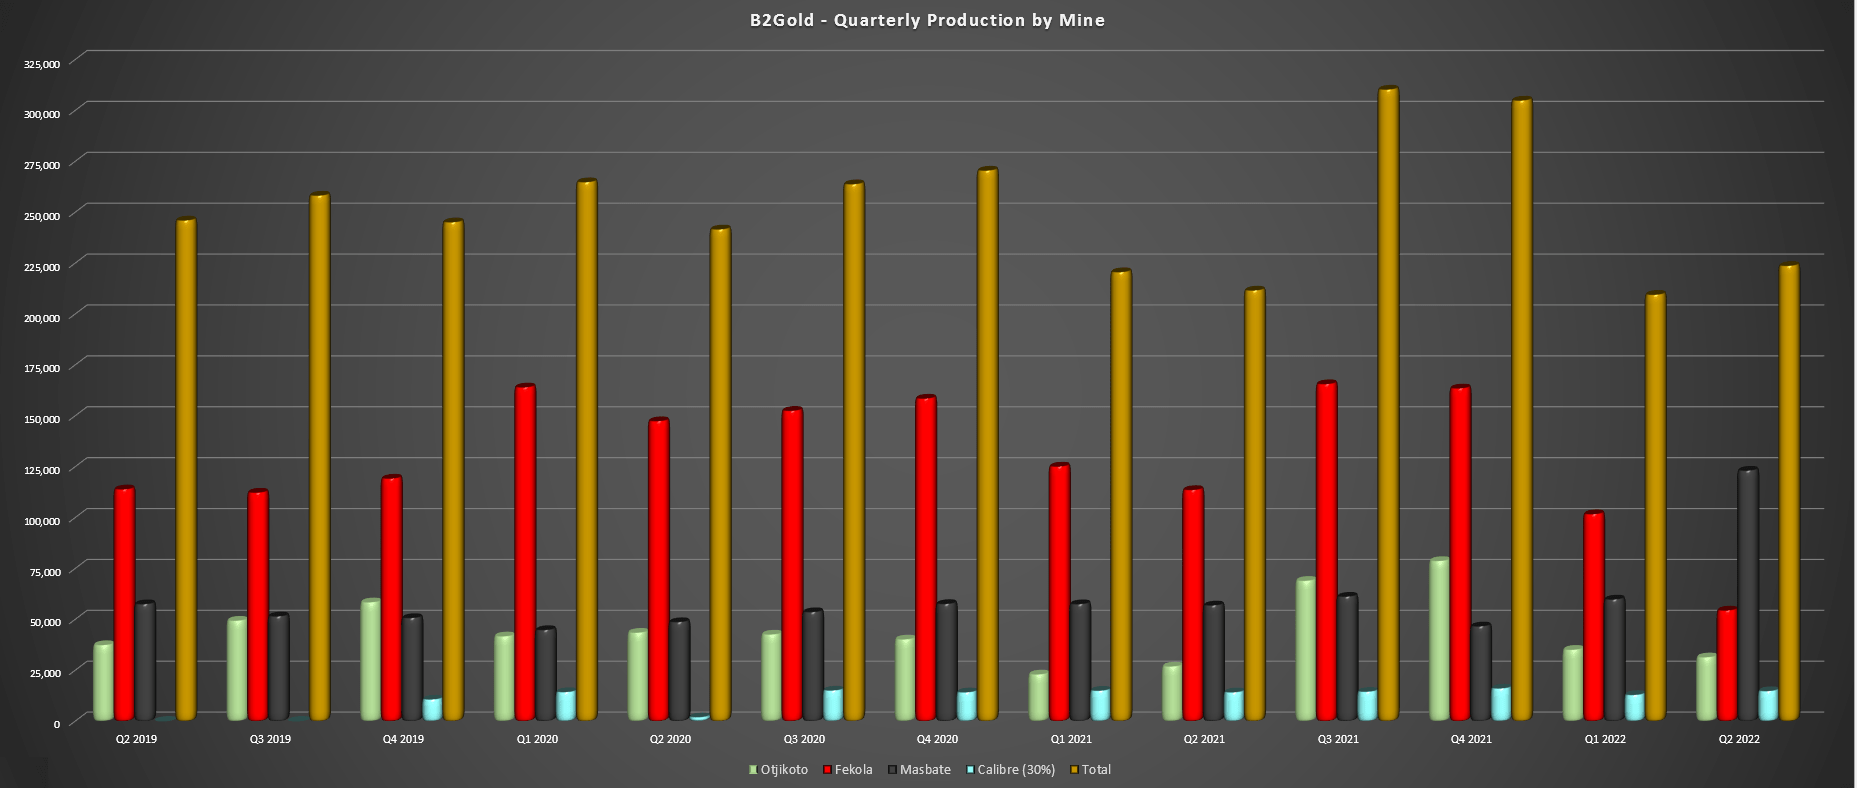
Moving over to the company’s Masbate Mine, it was a solid quarter. The operation produced ~54,400 ounces of gold at $1,082/oz, benefiting from higher throughput, which was partially offset by lower grades. Given the strong performance, production guidance for FY2022 has been raised by 10,000 ounces at the mid-point, with Masbate expected to produce 220,000 ounces. While this isn’t translating to better than expected costs due to fuel price increases, it is nice to see the stronger performance helped to mitigate any potential upwards revision to cost guidance.
Finally, Otjikoto was the one soft spot for the quarter, producing just ~31,400 ounces, which was up year-over-year but 6% below budgeted levels. The weaker results were related to a slower than planned ramp-up in development at Wolfshag Underground. B2Gold has since appointed a new mining contractor, development rates have improved, and stope ore is now expected in Q4. Due to the delay in accessing higher grades, production guidance was cut by 10,000 ounces at the mid-point to 170,000 ounces, but costs were unchanged. Finally, Calibre (OTCQX:CXBMF) contributed ~14,800 ounces on an attributable basis based on BTG’s interest, a number that’s set to grow materially given that it has one of the strongest growth profiles sector-wide.
While it might not seem like it at first glance, this was a solid quarter overall for B2Gold, especially on a relative basis. This is because Fekola continues to surprise on the upside from a throughput standpoint, and the company managed to maintain cost guidance. The latter is something that 70% of producers reporting to date have been unable to achieve. Lastly, the company noted that it does not plan to pursue Gramalote, which is not surprising and doesn’t degrade from the investment thesis. Instead, I think this is a bigger deal for AngloGold Ashanti (AU), which was in dire need of a high-margin operation to help its cost profile given its industry-lagging costs (not the case for B2Gold).
Costs & Margins
While B2Gold’s production results were solid, we did see some cost creep, with all-in sustaining costs coming in at $1,111/oz, up from $1,011/oz in the year-ago period. This is related to higher fuel prices which were not reflected in Q1 due to the delayed pricing due to prices set by the State. However, it’s important to note that these costs do not accurately reflect B2Gold’s business, and they were higher in Q2 due to much lower production than the annualized rate. In fact, unit costs are expected to decline sharply in H2 due to the benefit of higher production (better grades), with all-in sustaining costs likely to come in near $1,025/oz for the year, 8% below Q2 levels.
B2Gold – All-in Sustaining Costs & Forward Estimates (Company Filings, Author’s Chart)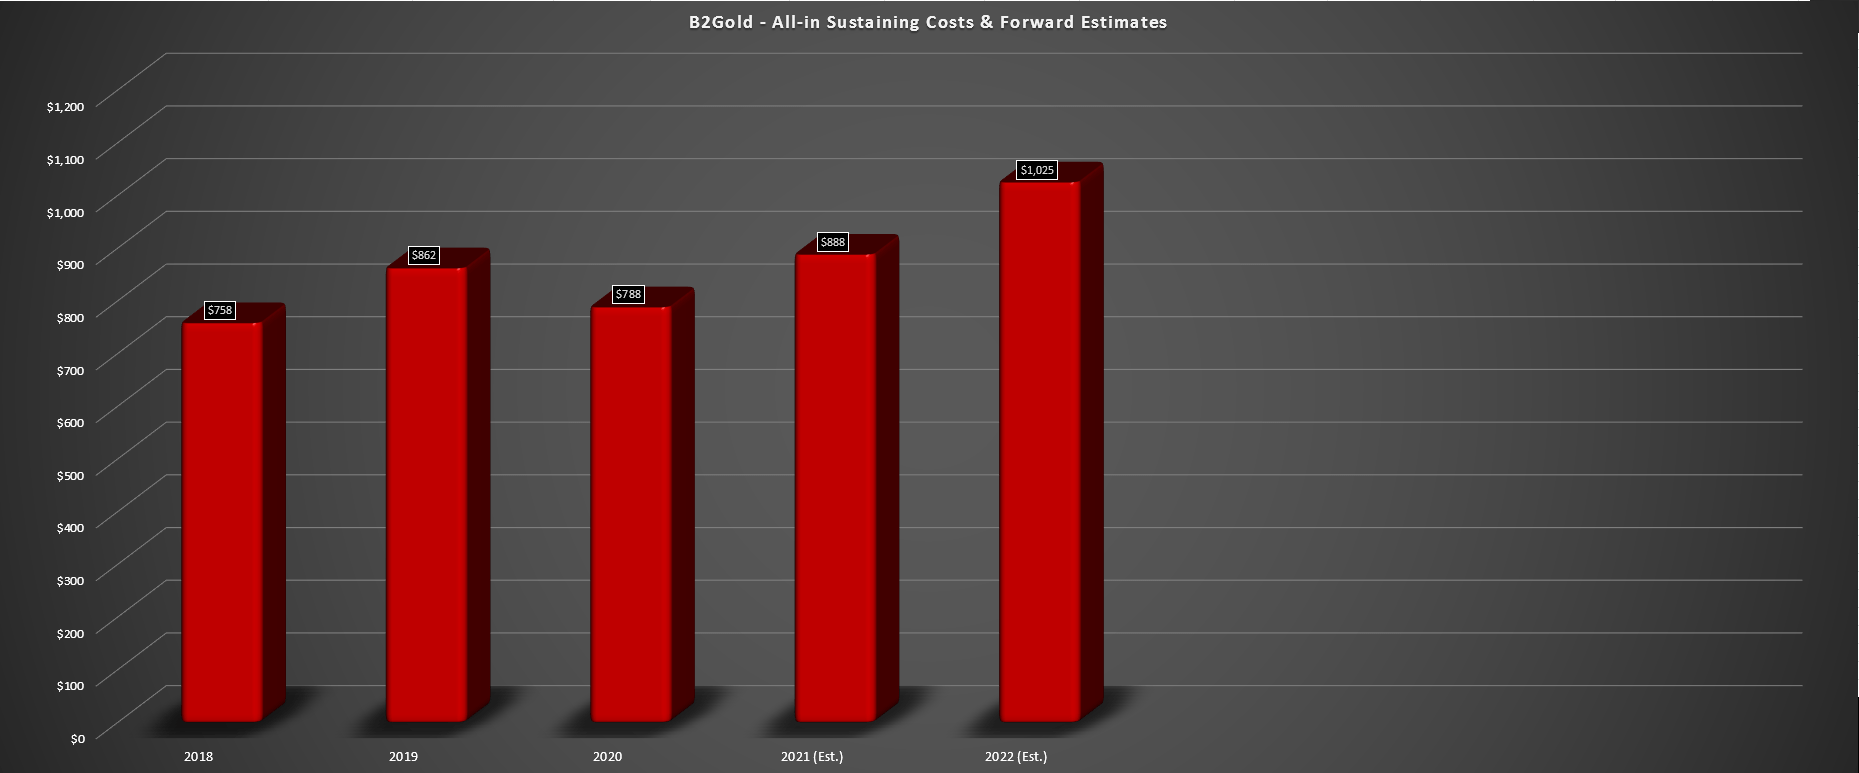
Looking at the chart above, we can see that this represents a sharp rise from previous levels. Still, these costs are well below the industry average, and they do not benefit (yet) from increased ore production from saprolite contribution at Anaconda. So, even if costs come in at $1,025/oz this year, this is a very high-margin business insulated from any gold price weakness. Finally, on margins, AISC margins declined to $750/oz (Q2 2021: $798/oz), offset by strength in the gold price. On a full-year basis, we should see AISC margins of $775/oz, a figure well above my estimates for the industry average of $575/oz.
B2Gold – Quarterly AISC Margins (Company Filings, Author’s Chart)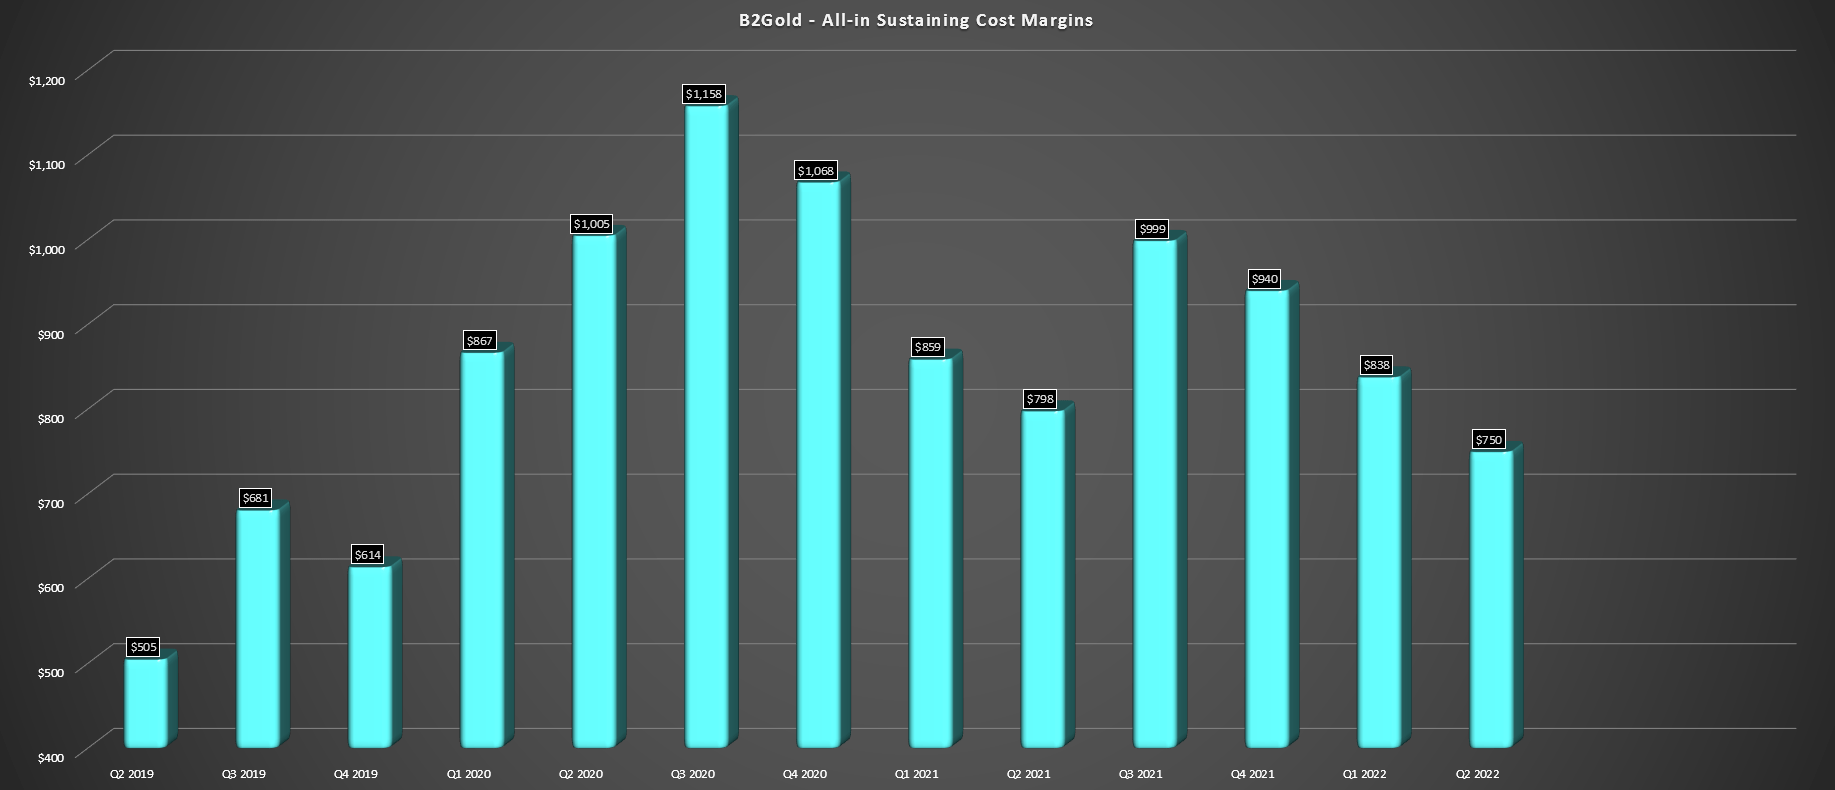
Financial Results
Moving over to the financial results, B2Gold reported a 5% increase in revenue year-over-year, helped by a higher gold price ($1,861/oz) and slightly higher sales volume. Year-to-date, revenue is sitting at $747.6 million, also up vs. the year-ago period. As for operating cash flow, it improved considerably to $124.9 million, up from (-) $8.3 million figure in the year-ago period. This was related to lower working capital outflows mostly due to lower income taxes paid in Q2 2022 vs. Q2 2021 (record year in 2020 translated to higher taxes).
B2Gold – Quarterly Revenue (Company Filings, Author’s Chart)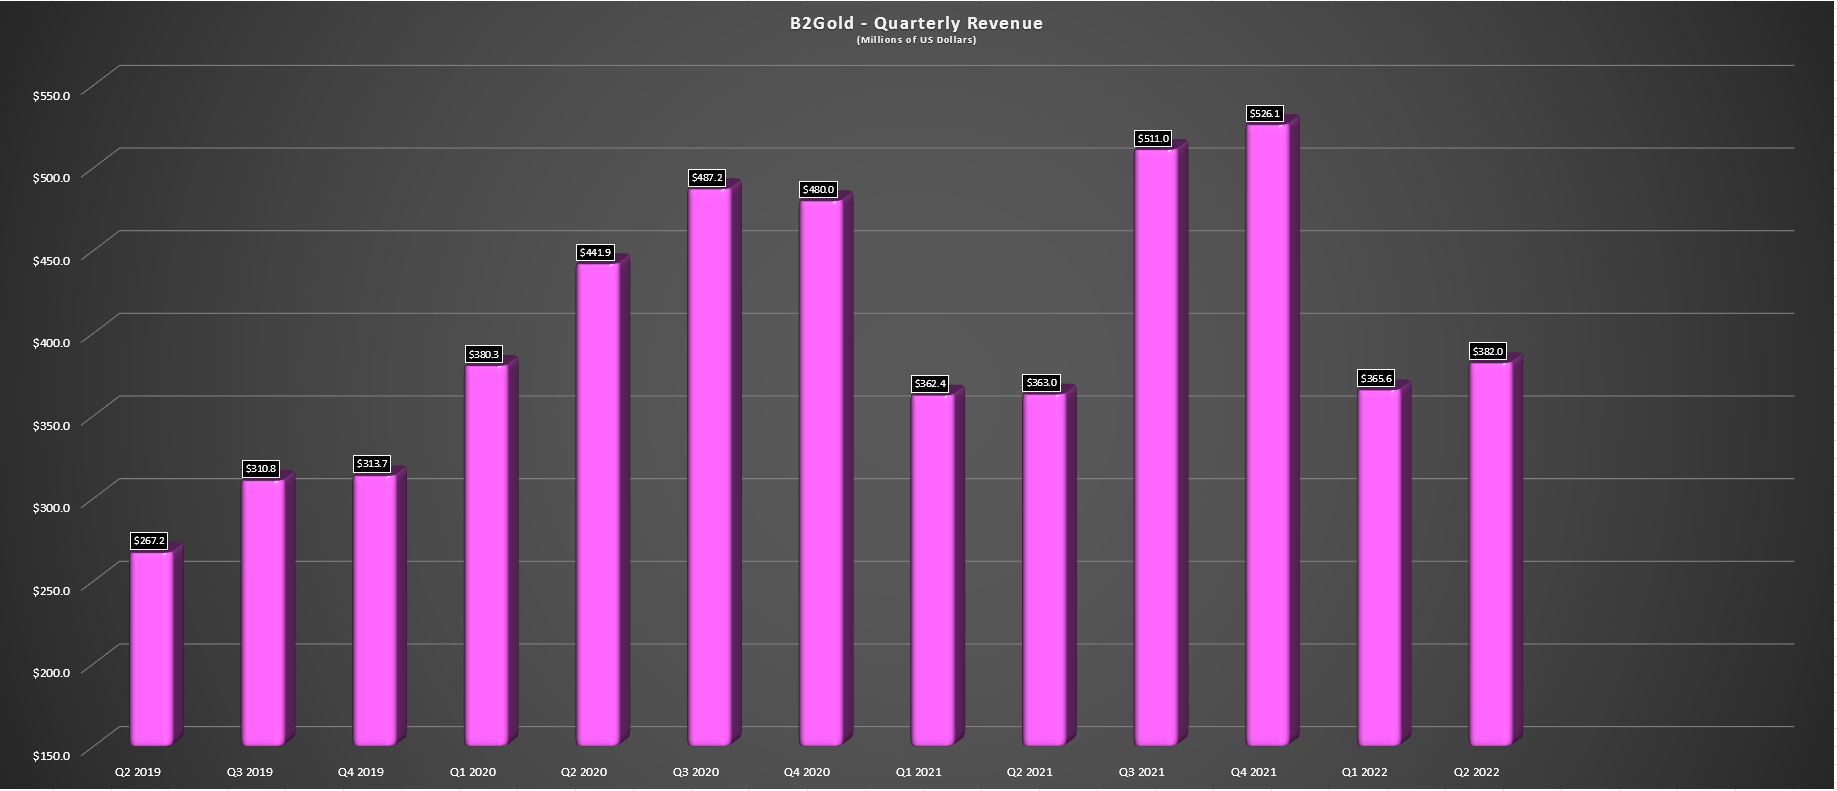
Given the weakness in the gold price, B2Gold has reeled in its cash flow estimate for this year from $625 million to $575 million, which might disappoint investors. This is entirely out of the company’s control due to the weakening gold price. From B2Gold’s standpoint, it has done everything possible to maximize profits (solid production, good cost controls), but obviously, it can’t do much regarding cooperation from the gold price. However, this estimate reflects an average gold price of $1,700/oz in H2 2022. I believe this is a conservative assumption with just three days spent below $1,700/oz thus far in H2, so a beat on this figure is certainly possible.
Valuation
Based on ~1.07 billion shares outstanding and a share price of $3.42, B2Gold trades at a market cap of ~$3.66 billion. This leaves B2Gold trading at a forward cash flow multiple of 6.0 based on an updated and more conservative cash flow outlook of $605 million ($0.57), given the recent weakness in the gold price. The current figure compares favorably to its historical cash flow multiple of ~7.7 over the past ten years and ~10.2 since 2008. I believe that a conservative multiple for the company is 8.25x cash flow given its strong track record, translating to a 39% upside in the stock from current levels to its conservative fair value ($4.70).
B2Gold – Historical Cash Flow Multiple (FASTGraphs.com)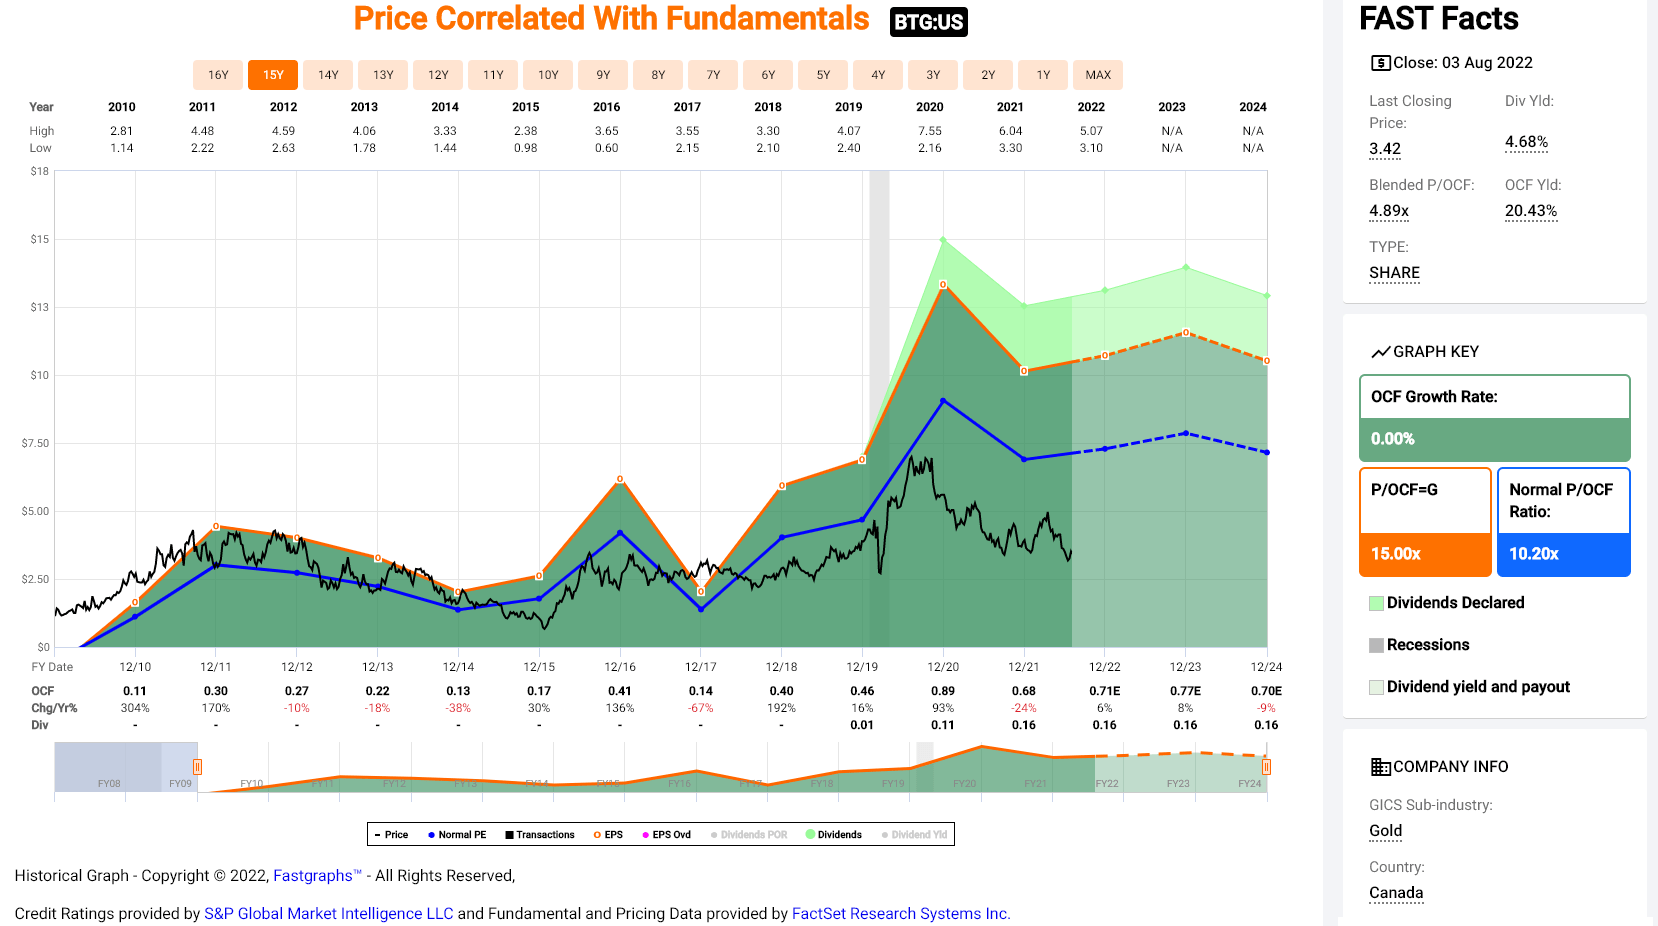
However, it’s important to note that this cash flow figure does not provide any upside to the potential to create a Malian Mining Complex, complementing its current operations at Fekola. In a stand-alone scenario, we could see 325,000+ ounces per annum from Anaconda and Dandoko, potentially generating over $175 million per annum in operating cash flow later this decade with synergies due to the company’s operating footprint in Mali. Finally, the company has ~$0.50 in net cash currently. Hence, when factoring in the upside not reflected in FY2022 cash flow estimates, I continue to see a fair value for the stock north of $5.00 per share.
Given the slight decline in the cash flow outlook due to the softer gold price, I have revised my low-risk buy zone to US$3.25 from US$3.40 previously. This simply reflects the potential for higher volatility in the stock with the gold price below its monthly moving averages but does not change my view of a $5.00+ price target.
Gold Futures Price (TC2000.com)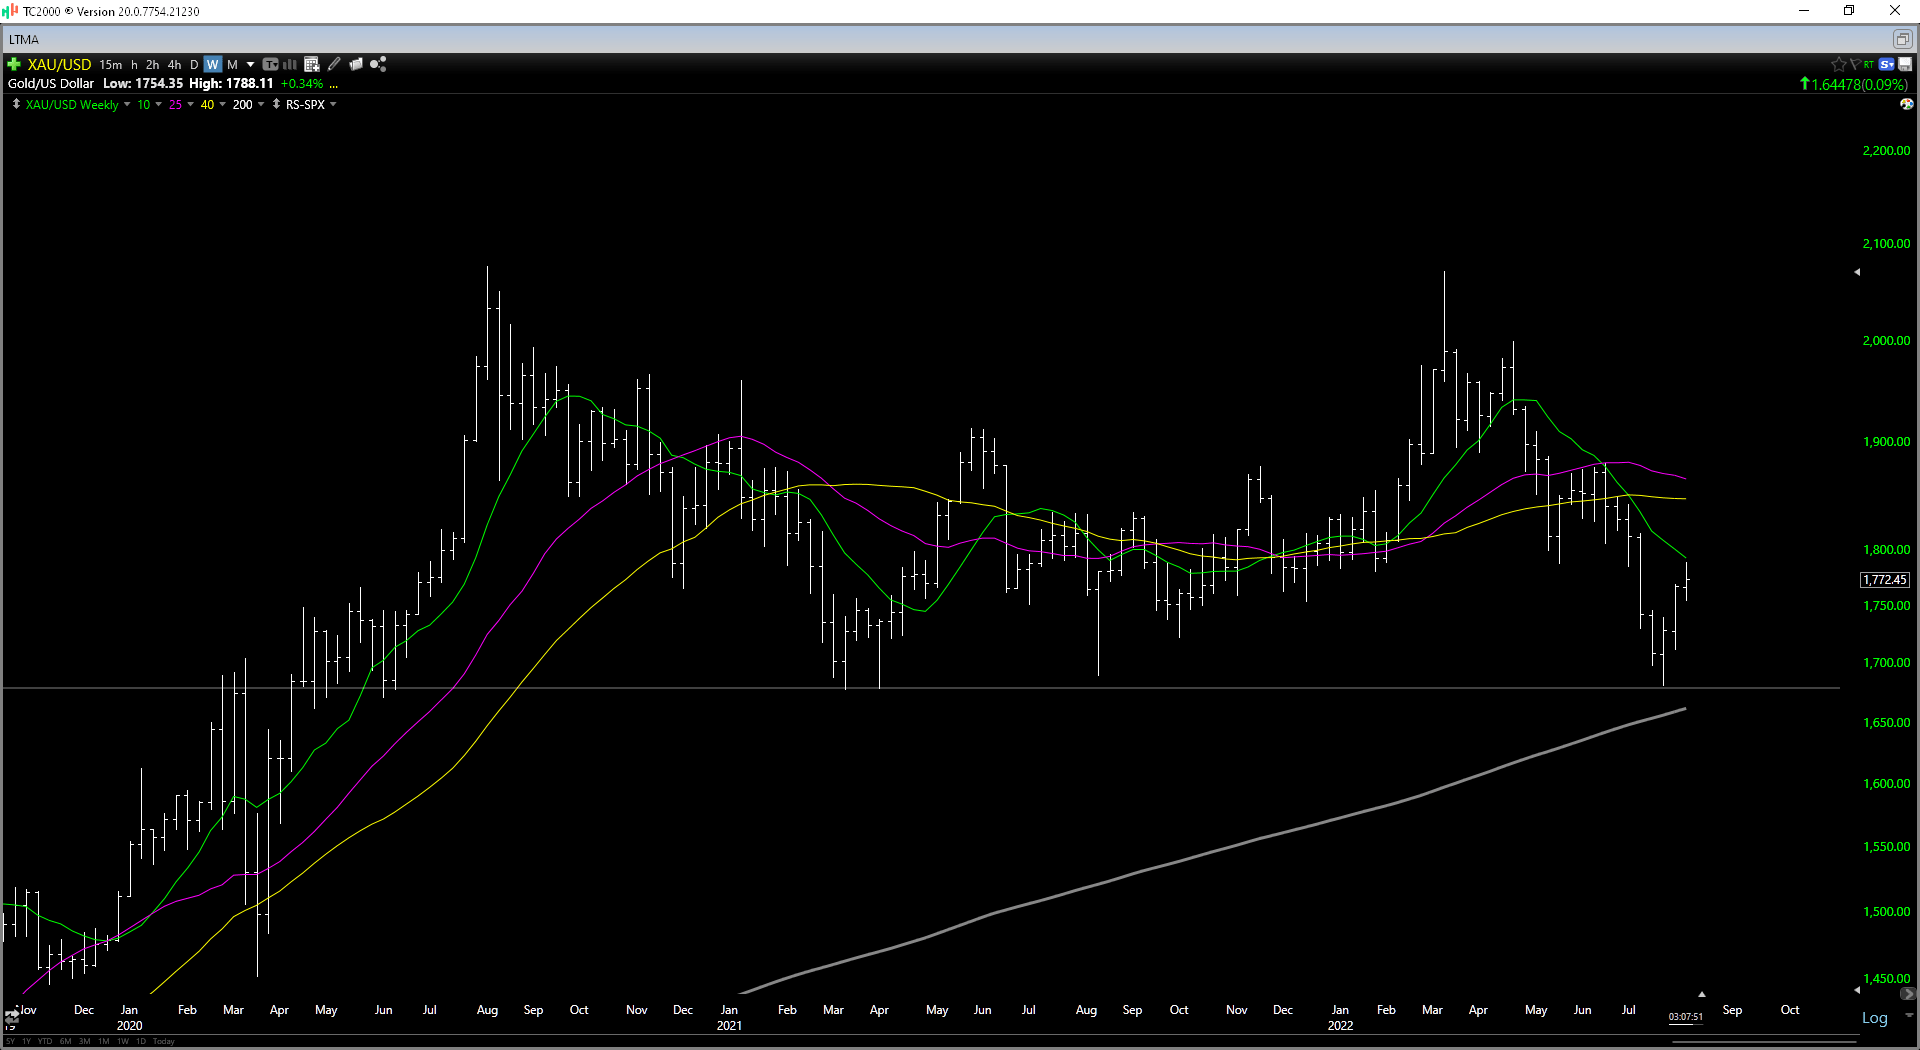
Summary
In a sector where several producers continue to disappoint by revising guidance and reporting capex blowouts, B2Gold put together a solid H1 ahead of what should be a much stronger second half due to higher grades. While it does not look like Gramalote will be developed, I do not see this as a negative. In fact, it highlights the team’s discipline to cut their losses if they do not see exceptional project economics vs. growing for the sake of growth and not wasting sunk costs like some other producers.
B2Gold – Historical Production Growth (Company Presentation)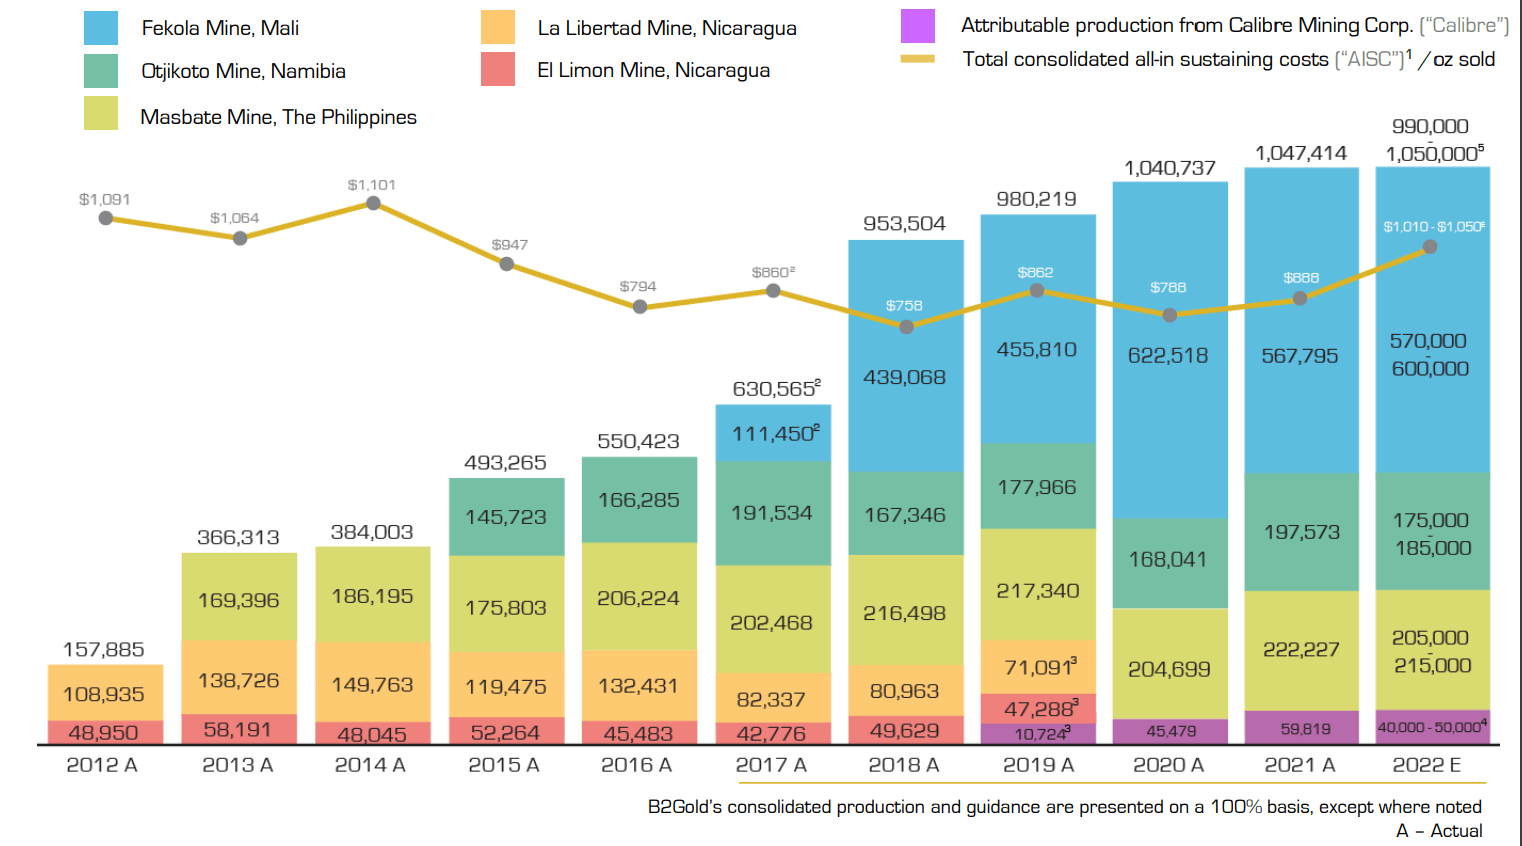
Meanwhile, the company’s flagship Fekola Mine continues to shine with record throughput, and its move away from Gramalote frees up capital to drill aggressively in Mali, which could be a major growth driver. With expected flat production from 2020-2024, some investors might pass over BTG, but this is a company sporting an industry-leading growth profile, and some pause to assess the landscape to explore the next phase of growth is expected. Long-term, I see the company’s future as bright with the potential for 1.30+ million ounces per annum, and its ability to meet targets places it in rare air. Hence, I would view any further weakness below US$3.25 as a buying opportunity.
Be the first to comment