

bodnarchuk/iStock via Getty Images
Introduction
Vancouver-based gold miner B2Gold Corp. (NYSE:BTG) released its first-quarter of 2022 gold production results on April 14, 2021.
1 – 1Q22 Gold production snapshot
B2Gold posted a weak gold production of 209,365 Au ounces (including 12,892 Au ounces for its 30% Calibre Mine) in the first quarter of 2022. The company also indicates full-year 2022 forecast gold production of between 990K Au Oz and 1,050K Au ounces.
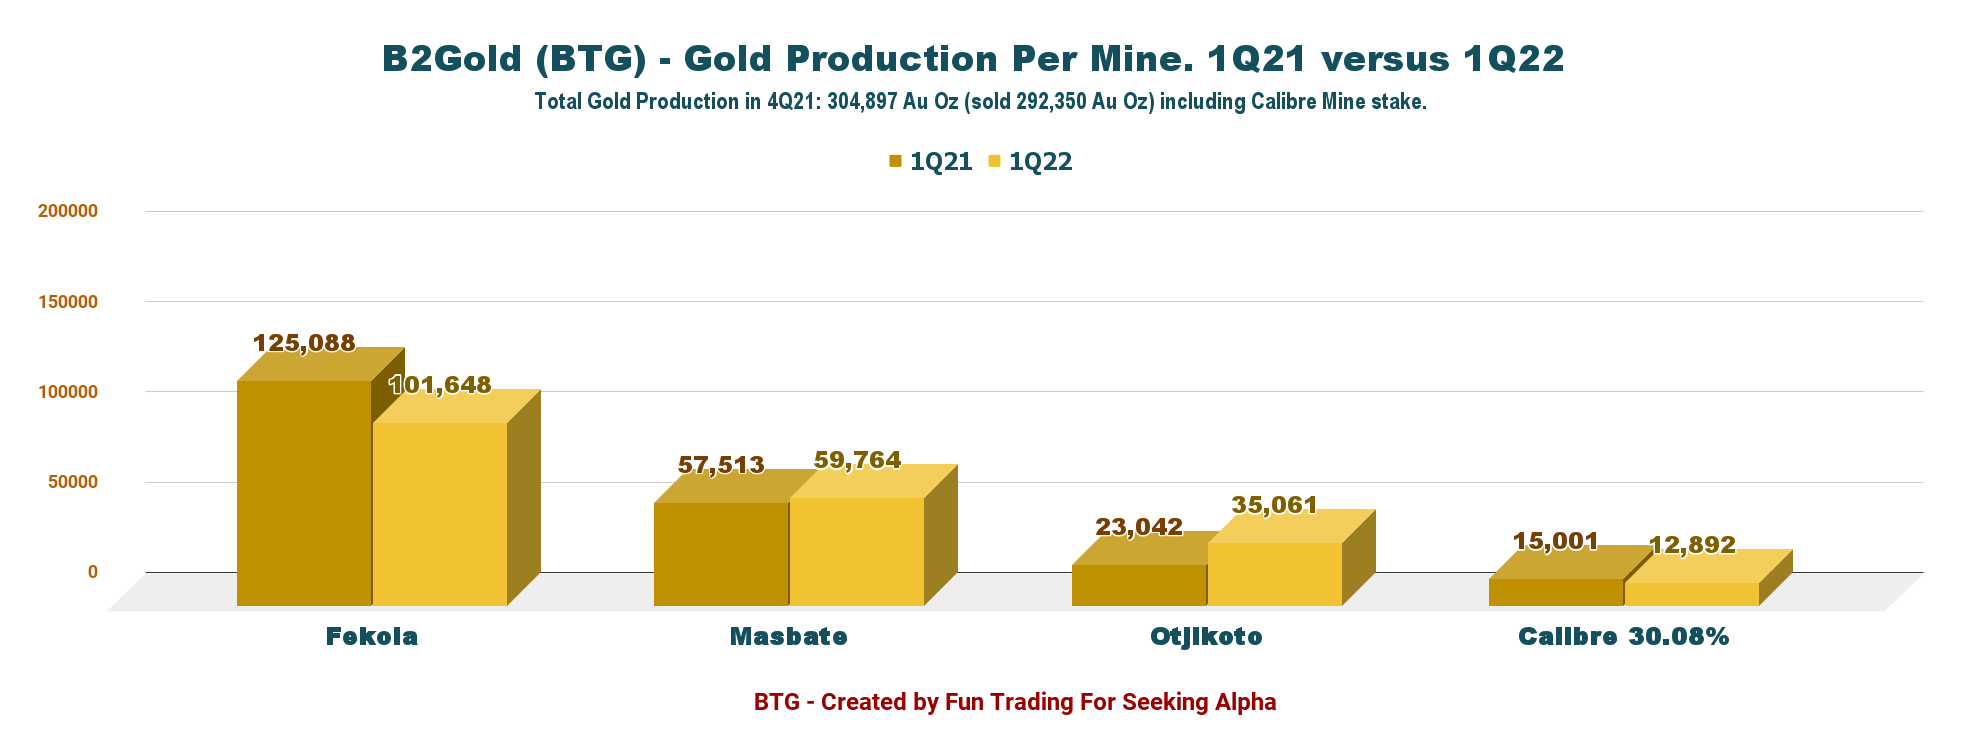
BTG: Guidance table 2022 (B2Gold) BTG: Quarterly gold production comparison 1Q21 1Q22 (Fun Trading)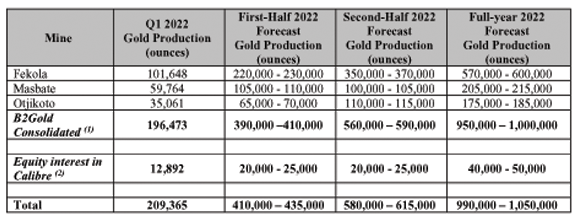
2 – Stock Performance
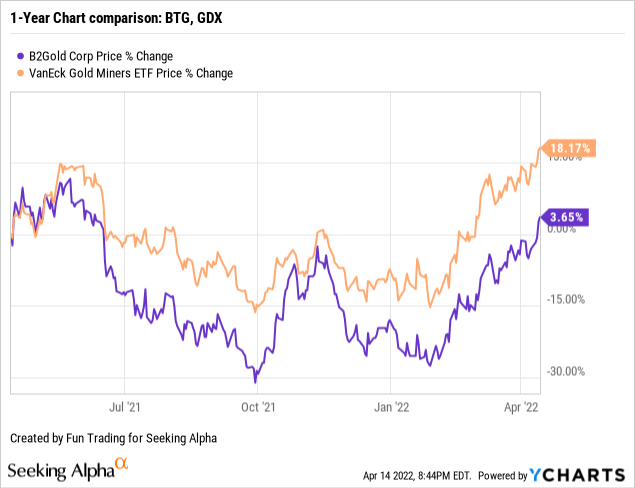
B2Gold is still underperforming the VanEck Vectors Gold Miners ETF (NYSEARCA: GDX), which is now up 18% on a one-year basis.
3 – Investment Thesis
BTG is an excellent gold producer with its three productive gold mines and its stakes in the Calibre Mine.
B2Gold’s balance sheet is solid and should not be shaken by this weak gold quarter sale. Thus, I consider the miner a long-term investment candidate with zero net debt and excellent growth potential (e.g., the Anaconda zone in Mali, a natural extension of the Fekola mine).
The only source of concern is the ongoing instability in Mali which seems to be worsening in 2022.
The good part is that the mine is located far from troubled regions and is not immediately suffering from acute problems. However, as I will show in my article below, new sanctions affect the mining at Fekola (e.g., saprolite ore issues), and it is essential to factor in this new component in your investing strategy.
A trade embargo placed on Mali by the majority of its neighbouring West African countries could affect its vital gold export sector in the coming months should a détente fail to be swiftly reached, analysts say.
On January 9, the Economic Community of West African States (Ecowas) imposed sweeping sanctions on Mali after the country’s military government postponed elections due to take place next month.
Tensions between the Ecowas regional bloc and Mali have been building since the military junta led by Colonel Assimi Goïta staged an initial coup in mid-2020.
One working strategy that I often recommend in this sector is trading LIFO about 50%-60% of your total position and keeping a core long-term position for a much higher payday. By doing so, you take advantage of the short-term volatility while positioning for a possible future uptrend.
B2Gold – 1Q22 Balance Sheet And Trend (Preliminary) – The Raw Numbers
| B2Gold | 1Q21 | 2Q21 | 3Q21 | 4Q21 | 1Q22 |
| Total Revenues in $ Million | 362.30 | 362.99 | 510.86 | 526.11 | 366 |
| Net Income in $ Million | 91.56 | 68.46 | 123.11 | 136.94 | – |
| EBITDA $ Million | 224.61 | 118.53 | 335.77 | 360.19 | – |
| EPS diluted in $/share | 0.09 | 0.06 | 0.12 | 0.13 | – |
| Cash from Operations in $ Million- | 145.85 | -8.32 | 320.28 | 266.29 | – |
| Capital Expenditure in $ Million | 46.30 | 40.59 | 63.56 | 112.50 | – |
| Free Cash Flow in $ Million | 99.55 | -48.91 | 256.73 | 153.79 | – |
| Total cash $ Million | 512.57 | 382.14 | 546.51 | 673.00 | – |
| Total Long-term Debt in $ Million | 68.68 | 35.25 | 29.58 | 75.10 | – |
| Dividend $/share | 0.04 | 0.04 | 0.04 | 0.04 | – |
| Shares outstanding (diluted) in Billion | 1.062 | 1.064 | 1.061 | 1.061 | – |
| Production | 1Q21 | 2Q21 | 3Q21 | 4Q21 | 1Q22 |
| Total Production gold | 220,644 | 211,612 | 310,261 | 304,897 | 209,365 |
| AISC from continuing operations/consolidated | 932 | 1,016 | 795 | 888 | Range 1,010-1,050 |
| Gold Price | 1,791 | 1,814 | 1,782 | 1,800 | 1,874 |
Data Source: Company press release
Analysis: Revenues, And Gold Production
1 – Quarterly Revenues were $366 Million For 1Q22
BTG: Chart Quarterly Revenue history (Fun Trading) The company announced consolidated gold revenues of $366 million in the first quarter of 2022, up slightly from the year-ago period and down 30.4% sequentially (see table above for details and history).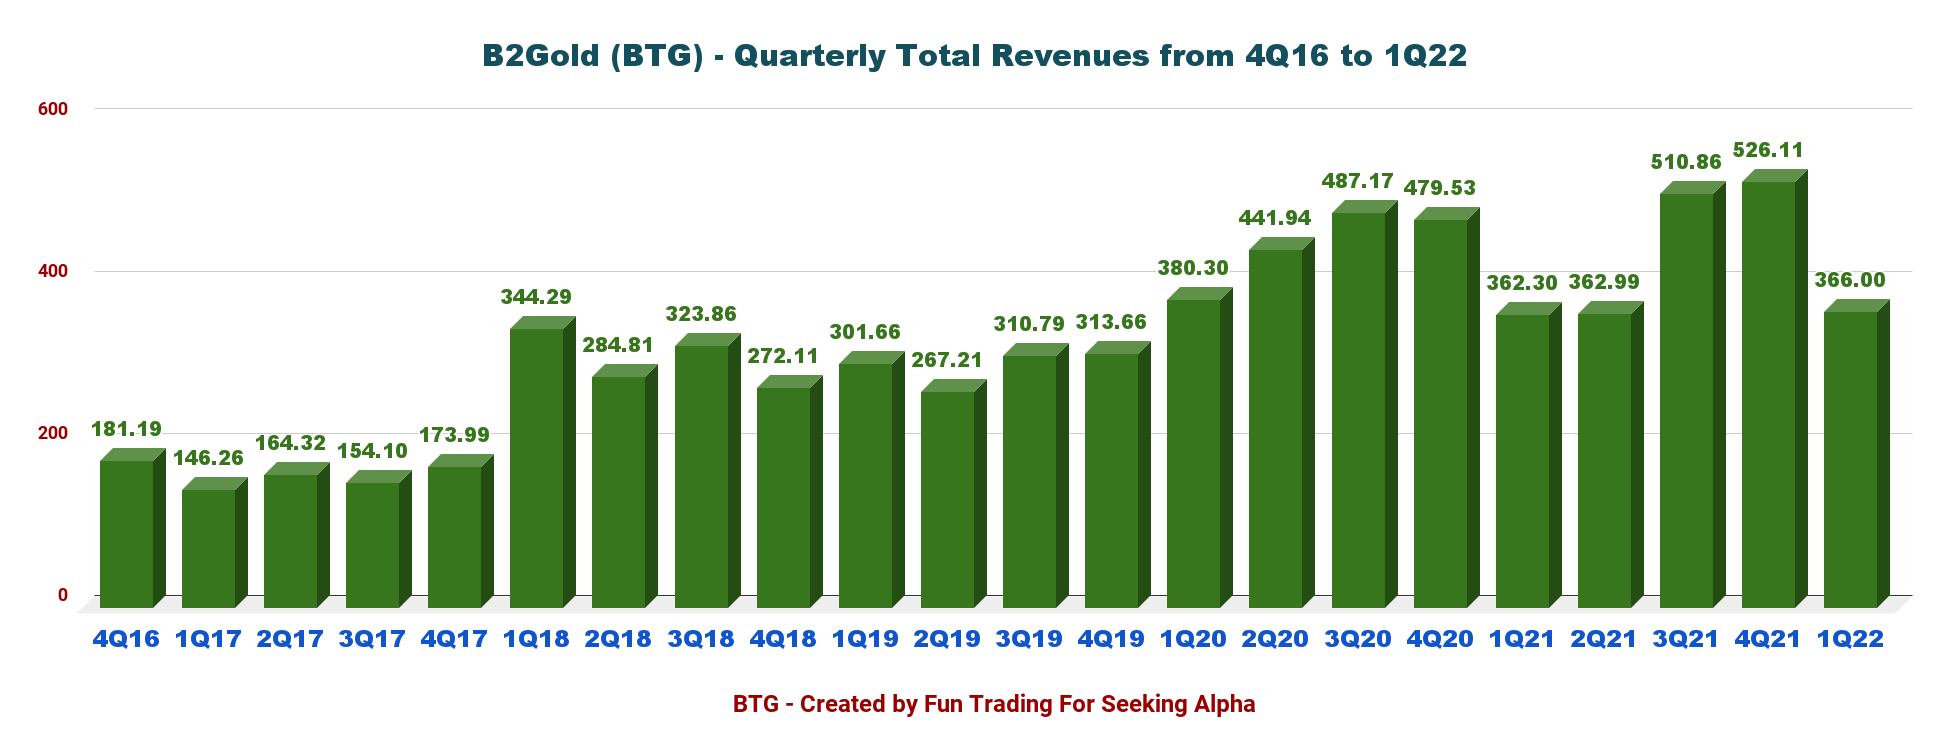
The gold price for 1Q22 averaged $1,879 per ounce, well above the $1,800 per ounce realized the previous quarter.
BTG: Chart Quarterly Revenue history (Fun Trading)
2 –Quarterly Production Analysis
Gold production for the first quarter of 2022 was 209,365 Au Oz (including 12,892 Au Oz at the Calibre Mine). The company sold 195,100 Au Oz in 1Q22.
BTG: Chart Quarterly Gold price history (Fun Trading) BTG: Chart Quarterly Gold production history (Fun Trading)

Production details – comparison quarter to quarter:
BTG: Chart Quarterly Production per mine comparison 4Q21 and 1Q22 (Fun Trading)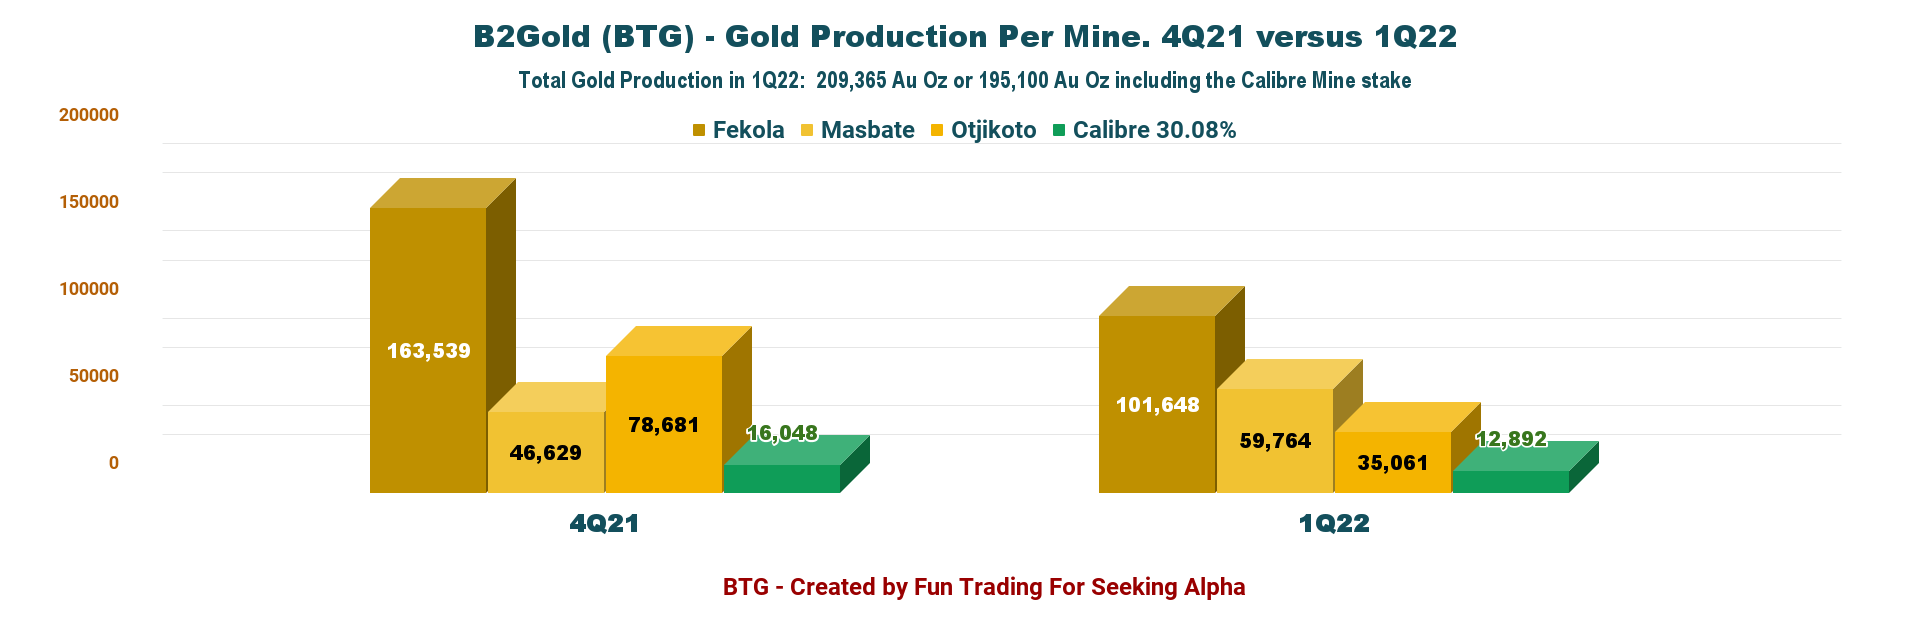
- The Fekola Mine in Mali: Produced 101,648 Au Oz. Compared to the first quarter of 2021, Fekola’s gold production was lower by 19% (23,440 ounces) due to planned significant waste stripping and lower mined ore tonnage, as Phase 6 of the Fekola Pit continues to be developed in the first half of 2022.
- Anaconda Area in Mali: On March 23, 2022, the Company announced an updated and significantly increased Mineral Resource estimate for the Anaconda area, comprised of the Menankoto permit and the Bantako North permit, located approximately 20 kilometers from the Fekola Mine. In 2022, the Company has budgeted $33 million to develop Phase I saprolite mining infrastructure in the Anaconda area, including road construction.
- The Masbate Mine in the Philippines: The Masbate Mine had a strong start in 2022, with the first quarter of 2022 gold production of 59,764 ounces, above guidance by 11% (5,711 ounces) and 4% (2,251 ounces) higher compared to the first quarter of 2021, mainly due to higher processed grade.
- The Otjikoto Mine in Namibia: The Mine performed well during the first quarter of 2022, producing 35,061 ounces of gold, 5% (1,803 ounces) above guidance, with processed tonnes, grade, and recoveries slightly better than guidance. As a result of the timing of higher-grade ore mining, Otjikoto’s gold production is expected to be significantly weighted to the second half of 2022, when mining is scheduled to reach the higher-grade portions of Phase 3 of the Otjikoto Pit.
2022 Guidance
For full-year 2022, the company’s total gold production is forecast to be between 990K-1,050K ounces (including 40K-50K attributable ounces projected from Calibre).
Total consolidated cash operating costs are between $620 and $660 per ounce, and AISC is forecast to be between $1,010 and $1,050 per ounce.
Technical Analysis And Commentary
BTG: TA Chart short-term (Fun Trading)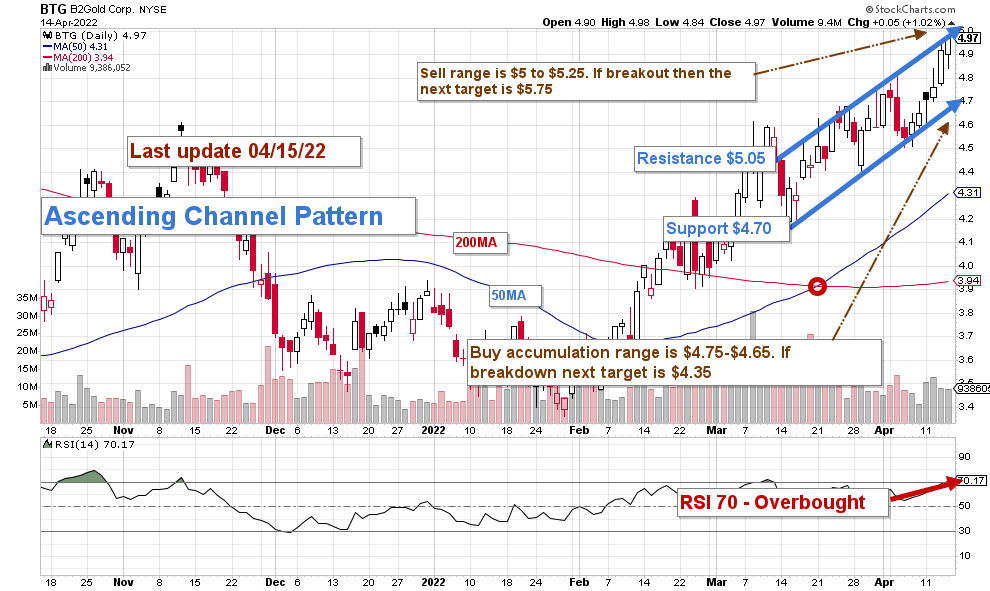
BTG forms an Ascending channel pattern with resistance at $5.05 and support at $4.70.
The short-term trading strategy is to trade LIFO about 50%-60% of your position. I suggest selling between $5 and $5.25 and waiting for a retracement below $4.70. If the gold price loses its strong momentum, BTG could experience a breakdown and still retest the lower support at $4.30.
Conversely, if the gold price can cross $2,000 per ounce, BTG could break out and retest $5.75-$6.50.
Warning: The TA chart must be updated frequently to be relevant. It is what I am doing in my stock tracker. The chart above has a possible validity of about a week. Remember, the TA chart is a tool only to help you adopt the right strategy. It is not a way to foresee the future. No one and nothing can.
Author’s note: If you find value in this article and would like to encourage such continued efforts, please click the “Like” button below as a vote of support. Thanks!
Be the first to comment