

Moussa81
Part I – Introduction
Vancouver-based gold miner B2Gold Corp. (NYSE:BTG) released its Second-quarter of 2022 results on August 03, 2022.
Note: I have followed BTG quarterly since July 2019 with 18 articles and counting. This new article is a quarterly update of my article published on July 15, 2022.
BTG Map location Presentation (B2Gold)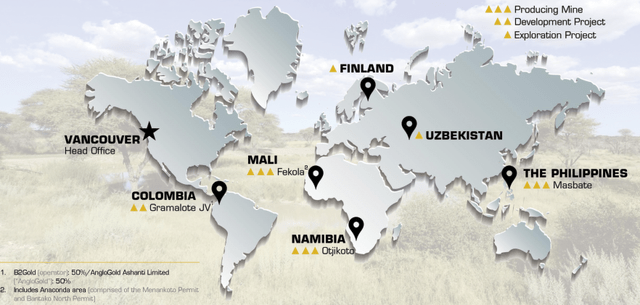
The main asset for the company is the Fekola Mine in Mali, West Africa.
1 – 2Q22 results snapshot
B2Gold posted a net income attributable to the shareholders of $37.80 million or $0.04 per share and an adjusted net income of $45 million or $0.04 per share.
Revenues for 2Q22 were $381.99 million, up 4.5% sequentially and up 5.2% compared to the same quarter a year ago. Cash flow provided by operating activities before changes in non-cash working capital was $124.88 million.
Total gold production in the second quarter of 2022 was 223,623 ounces (including 14,765 Au ounces for its 30.8% Calibre Mine). The company indicated that it was on track to meet annual guidance for 2022 with a total of 990K-1,050K. It was a solid performance from the Company’s three mines, with each mine exceeding guidance for the second quarter of 2022
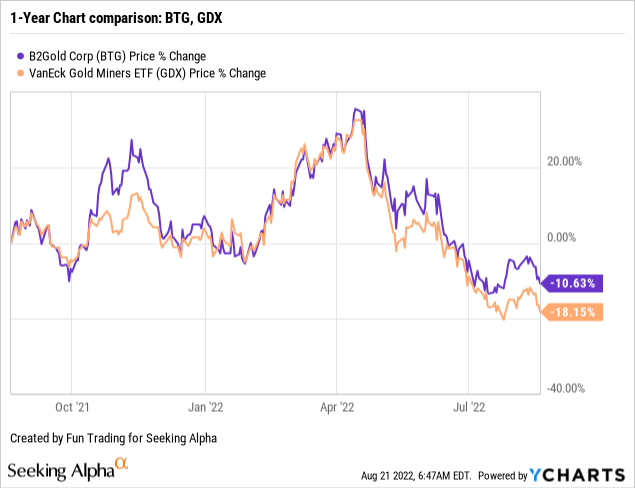
2 – Stock performance
B2Gold has slightly outperformed the VanEck Vectors Gold Miners ETF (GDX) and is down 11% on a one-year basis. BTG has dropped significantly since April-May this year in correlation with the FED’s actions against rampant inflation.
3 – Investment thesis
I consider BTG another strong gold miner with adequately diversified assets, even if the Fekola mine presents an additional risk due to the political instability in Mali.
The recent withdrawal of the French military and the Takuba Task Force without Mali’s agreement created additional threats to internal stability. Despite the Economic Community of West African States (“ECOWAS”) removal of the financial and diplomatic sanctions imposed on Mali earlier in 2022, the risk of mining gold in the country remains very high and should not be discounted.
Thus, one winning strategy that I often recommend in the gold sector in my marketplace, “The Gold and Oil Corner,” is trading about 50%-60% LIFO of your whole BTG position and keeping a core long-term position for an eventual higher stock price.
The best strategy (the centerpiece of my marketplace) will protect you from “surprises.” However, only US investors can trade LIFO. Please read the note at the end of the article.
Note: The Company recently announced the acquisition of Oklo Resources Limited, which will provide B2Gold with an additional landholding of 1,405 km2 covering highly prospective greenstone belts in Mali, including Oklo’s flagship Dandoko project (550 km2), located approximately 25 kilometers from each of the Fekola Mine and the Anaconda area. The transaction is expected to be completed in mid-September 2022. The cost was $65 million, including a cash payment of $19.6 million and the rest in BTG shares.
Part II – B2Gold – 2Q22 Balance Sheet – The Raw Numbers
| B2Gold | 2Q21 | 3Q21 | 4Q21 | 1Q22 | 2Q22 |
| Total Revenues in $ Million | 362.99 | 510.86 | 526.11 | 365.58 | 381.99 |
| Net Income in $ Million | 68.46 | 123.11 | 136.94 | 80.72 | 37.80 |
| EBITDA $ Million | 118.53 | 335.77 | 360.19 | 222.42 | 188.78 |
| EPS Diluted in $/share | 0.06 | 0.12 | 0.13 | 0.09 | 0.04 |
| Cash from Operations in $ Million | -8.32 | 320.28 | 266.29 | 107.31 | 124.88 |
| Capital Expenditure in $ Million | 40.59 | 63.56 | 112.50 | 67.93 | 132.49 |
| Free Cash Flow in $ Million | -48.91 | 256.73 | 153.79 | 39.39 | -7.62 |
| Total Cash $ Million | 382.14 | 546.51 | 673.0 | 648.76 | 586.699 |
| Total Long-term Debt in $ Million (including current) | 93.92 | 83.75 | 75.13 | 72.66 | 66.64 |
| Dividend $/share | 0.04 | 0.04 | 0.04 | 0.04 | 0.04 |
| Shares Outstanding (diluted) in Billion | 1.064 | 1,061 | 1,061 | 1,062 | 1,068 |
| Production | 2Q21 | 3Q21 | 4Q21 | 1Q22 | 2Q22 |
| Total production gold | 211,612 | 310,261 | 304,897 | 209,365 | 223,623 |
| AISC from continuing operations/consolidated | 1,016 | 795 | 888 | 1,036 | 1,111 |
| Gold Price | 1,814 | 1,782 | 1,800 | 1,874 | 1,861 |
Data Source: Company press release
Analysis: Revenues, And Gold Production
1 – Quarterly revenues were $381.99 million for 2Q22
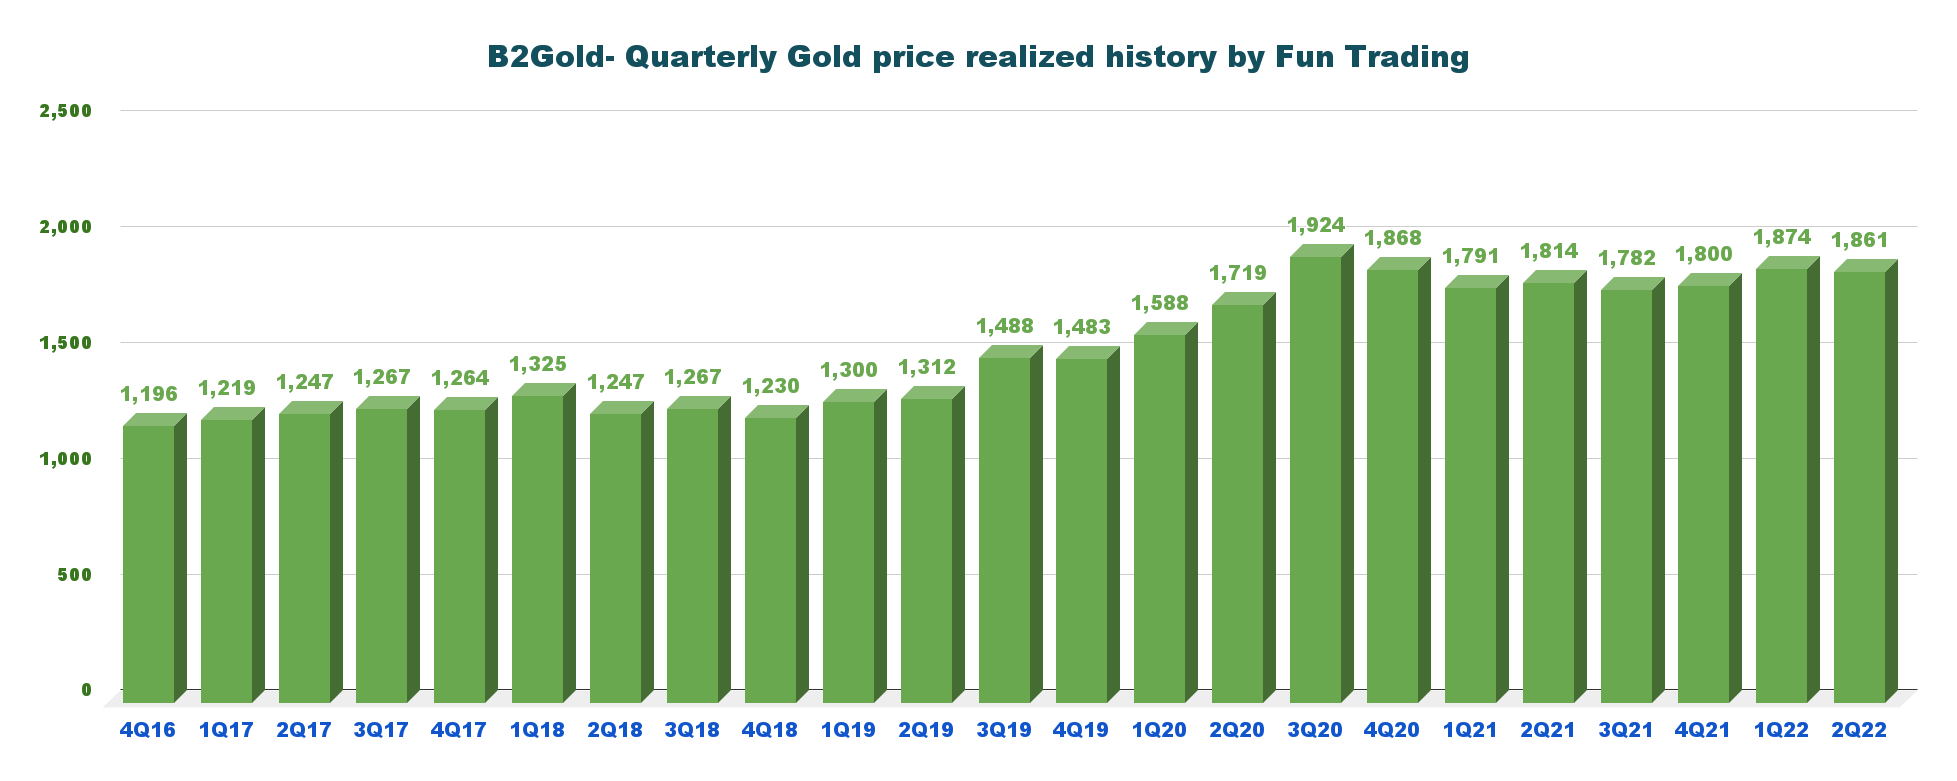
BTG Quarterly revenues history (Fun Trading) The company announced consolidated gold revenues of $381.99 million in the second quarter of 2022, up from the year-ago period and up 4.5% sequentially (see table above for details and history). The company sold its gold at $1,861 per ounce this quarter. BTG Quarterly Gold price history (Fun Trading) The gold price progression since 2019 has been excellent, but we are reaching a plateau between $1,800 and $1,900. CEO Clive Johnson said in the conference call: As you can see from the news lease we put out, we had another very strong quarter. We beat our budgets in a number of areas. And very importantly, we’re able to maintain our guidance for 2022 even in this current environment of inflation, what we’re seeing in the world. So a very good first half. We have guided that we’re going to see some higher cost due to inflation primarily in the second half of the year.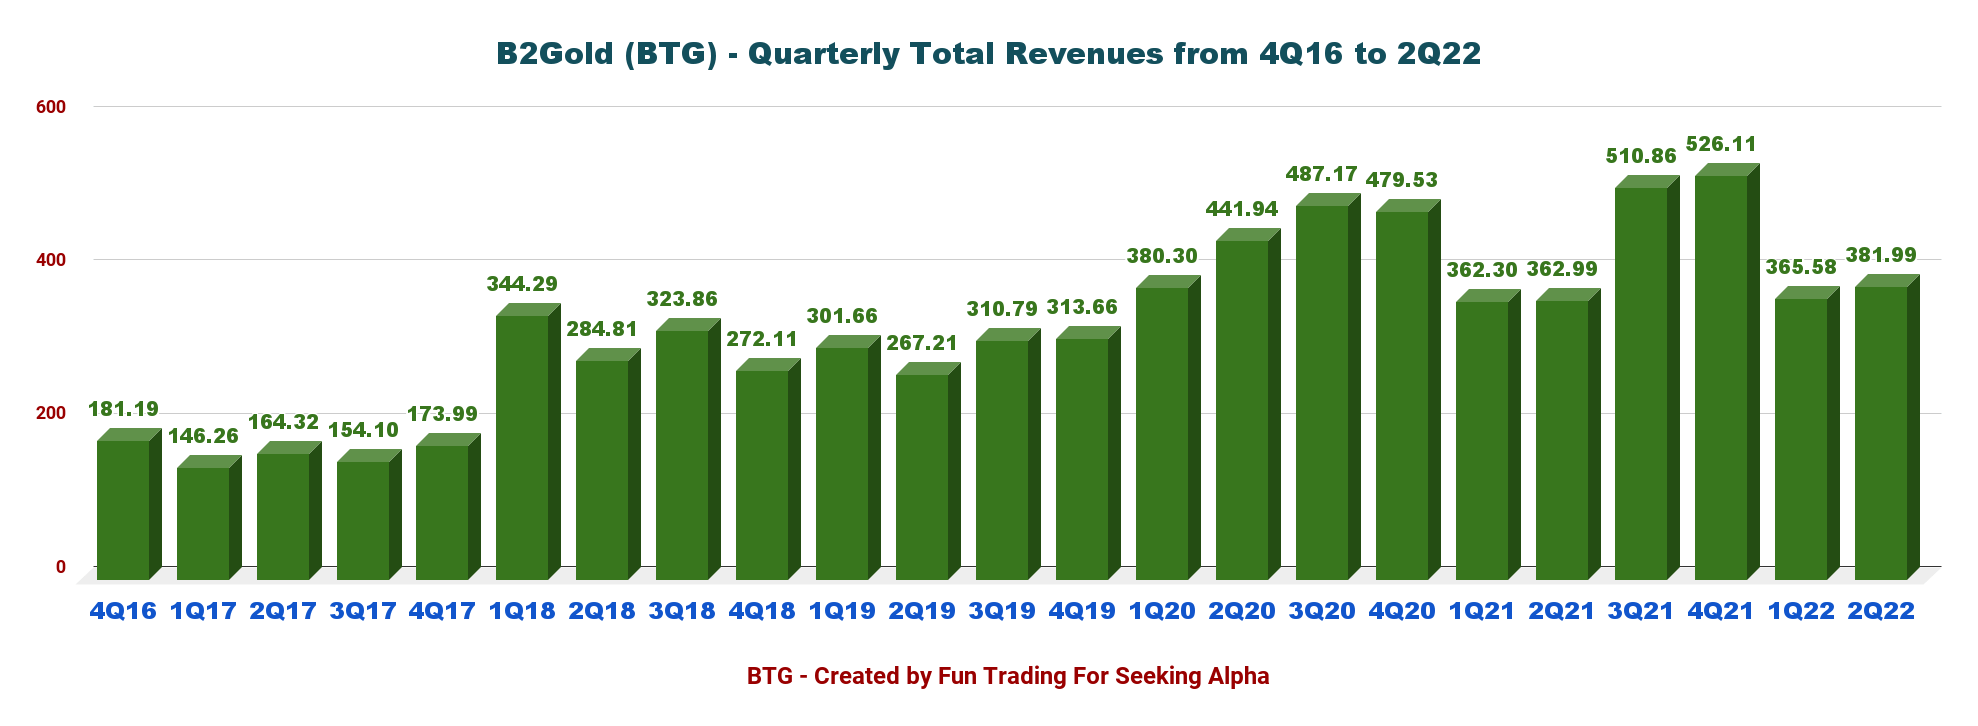
2 – The second quarter’s free cash flow was a loss of $7.62 million
BTG Quarterly Free cash flow history (Fun Trading)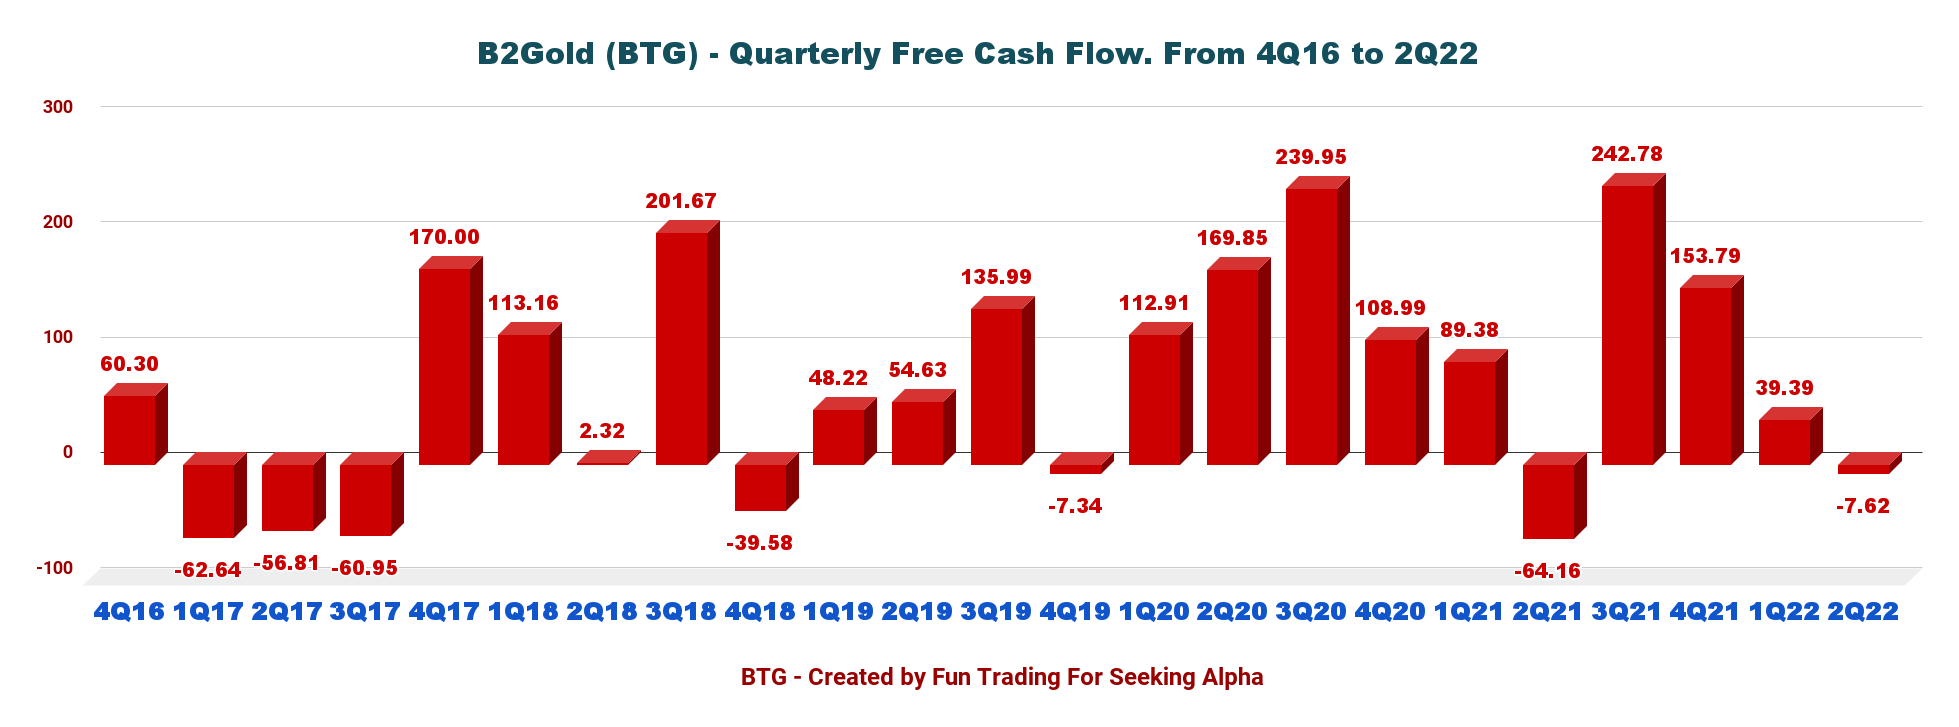
Note: Generic free cash flow is cash from operating activities minus CapEx.
B2Gold had a quarterly free cash flow loss of $7.62 million in 2Q22, and a trailing 12-month FCF is $428.34 million.
B2Gold’s board pays a quarterly dividend of $0.04 per share, or a yield of 4.88%.
Note about the dividend payment: Remember that non-Canadian investors receive only 85% of the dividend of $0.034 per share.
3 – B2Gold is net debt-free and has $586.69 million in total cash at the end of June
BTG Quarterly Cash versus Debt history (Fun Trading) B2Gold continues to maintain a strong financial position and liquidity. As shown in the chart above, the company has a long-term debt (including current) of $66.64 million.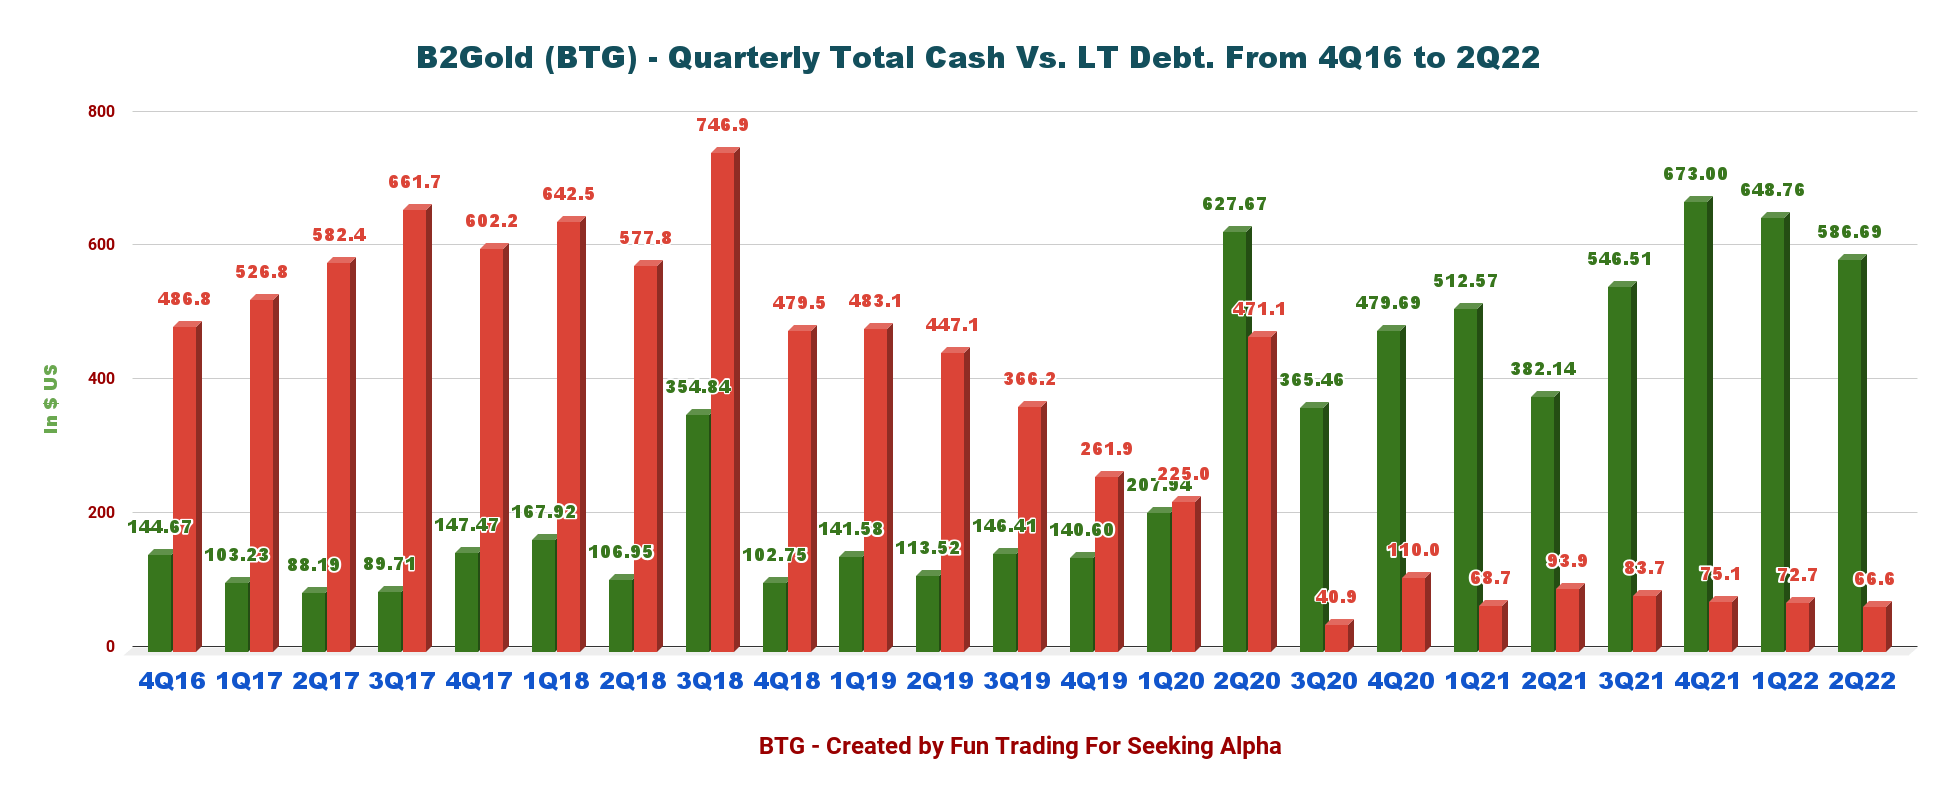
On June 30, 2022, the Company had cash and cash equivalents of $586.69 million (June 30, 2021 – $382.14 million) and working capital of $775 million (December 31, 2021 – $802 million).
In addition, the Company’s $600 Million Revolving Credit Facility (“RCF”) remains fully undrawn and available. The Liquidity is $1,187 million in 2Q22.
4 – Quarterly Production Analysis
Note: The production segment has been covered recently in my article published on July 15, 2022.
Gold production for the second quarter of 2022 was 223,623 Au Oz (including 14,765 Au Oz at the Calibre Mine). The company sold 205,300 Au Oz in 2Q22.
BTG Quarterly gold production history (Fun Trading) 4.1 – Production detail: Production comparison 1Q22 versus 2Q22 per mine. BTG Quarterly production per mine 1Q22 versus 2Q22 (Fun Trading)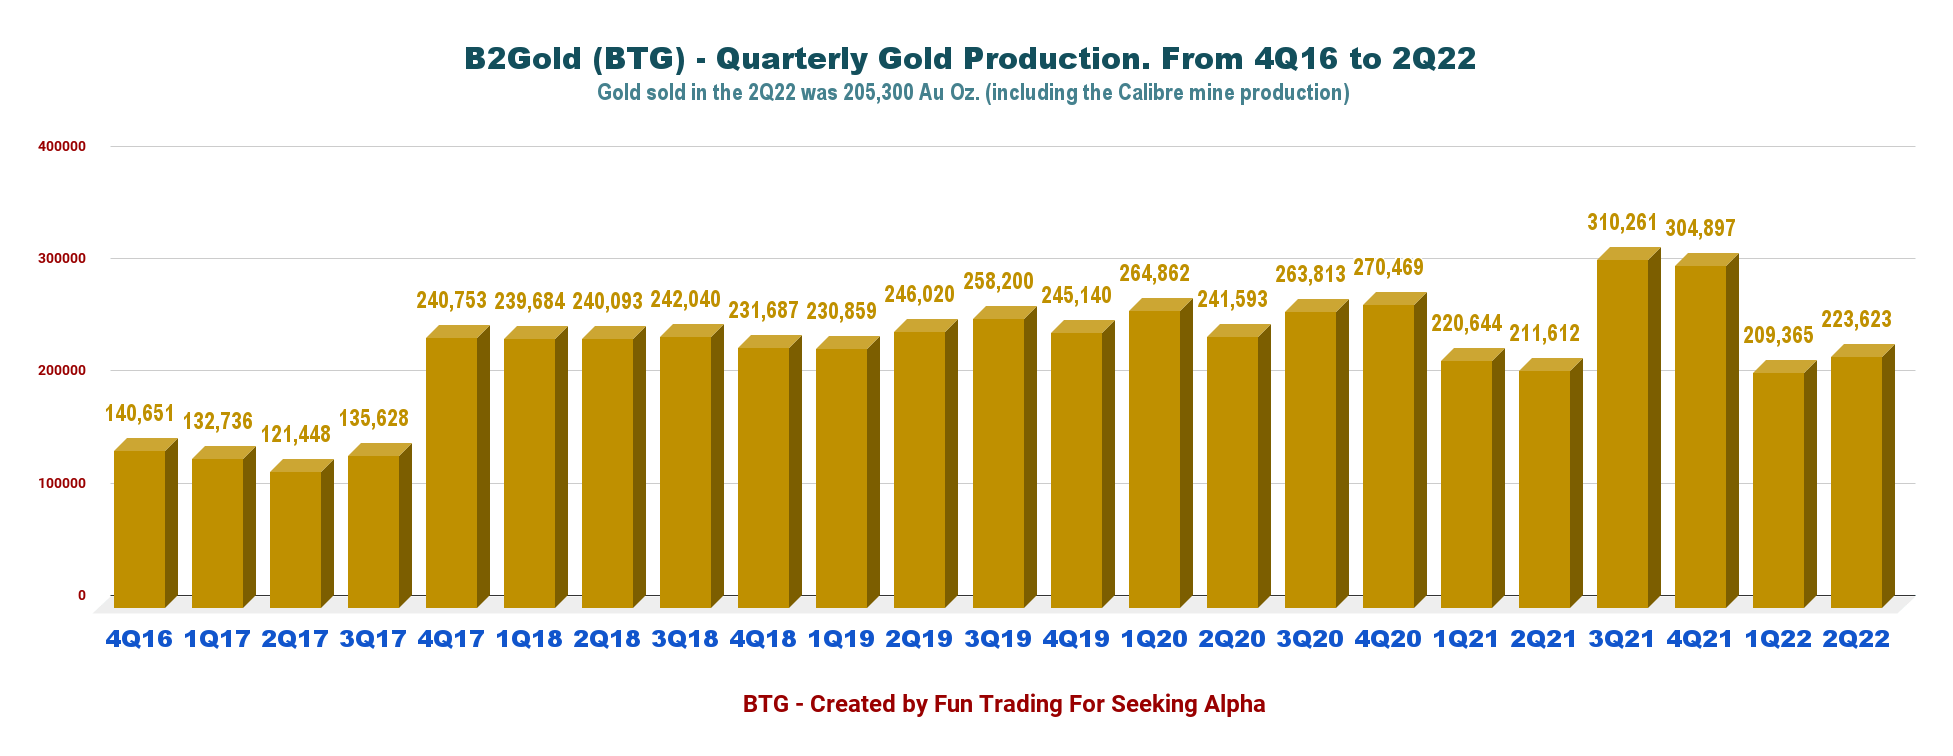

- The Fekola Mine In Mali: Produced 123,066 Au Oz. Compared to 113,611 ounces in the first quarter of 2021. The Fekola Mine continued its strong operational performance through the second quarter of 2022. Fekola’s processing facilities achieved a quarterly throughput of 2.42 million tonnes, 8% above expectations and 6% higher than the second quarter of 2021, due to better ore characteristics and continuous grinding circuit optimization. The company also indicated that Fekola’s gold production is expected to be “significantly weighted to the second half of 2022 when mining reaches the higher-grade portion of Phase 6 of the Fekola Pit.” Fekola Mine is expected to produce between 570K and 600K Au ounces of gold in 2022 at cash operating costs of between $510 and $550 per ounce and AISC of between $840 and $880 per ounce.
- The Masbate Mine In The Philippines: The Masbate Mine had a strong start in 2022, with the second quarter of 2022 gold production of 54,375 ounces, above guidance by 2% higher than the second quarter of 2021, mainly due to higher processed grade and recoveries this quarter. Masbate Mine’s positive production performance to date is now expected to produce between 215K and 225K ounces of gold in 2022 (the original guidance range was between 205K and 215K ounces of gold), with cash operating costs of between $740 and $780 per ounce and AISC of between $1,070 and $1,110 per ounce.
- The Otjikoto Mine In Namibia: The Mine performed well during the first quarter of 2022, producing 31,417 ounces of gold, 6% below guidance. The company said that the lower than budgeted gold production in the second quarter of 2022 was due to a slower than planned ramp-up in development of the Wolfshag Underground mine, resulting in lower than budgeted mined grade. The company has changed its underground mining contractor. With this change in ore production timing, the 2022 annual production guidance range has been revised to between 165K and 175K ounces of gold (the original guidance range was between 175K and 185K ounces of gold) and AISC of between $1,120 and $1,160 per ounce.
- The Gramalote gold project in Colombia has been put on hold.
4.2 – AISC History – Increased Inflationary pressures are a concern.
AISC was $1,111 per ounce in 2Q22, rising significantly quarter over quarter.
BTG Quarterly AISC and gold price realized History (Fun Trading)
4.3 – 2022 Guidance unchanged
For full-year 2022, the company’s total gold production is expected to be between 990K-1,050K ounces (including 40K-50K attributable ounces projected from Calibre).
The total consolidated cash operating costs are between $620 and $660 per ounce, and AISC is forecast to be between $1,010 and $1,050 per ounce.
The company expects a gold revenue of $1.76 billion in 2022.
BTG 2022 Guidance (B2Gold presentation)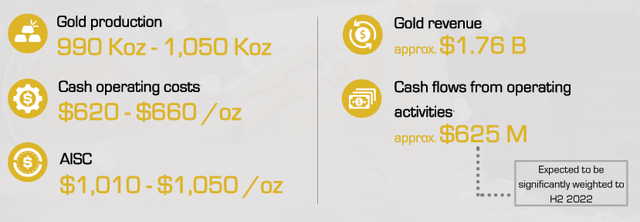
Technical Analysis And Commentary
BTG TA chart short-term (Fun Trading) Note: The chart is adjusted for the dividend.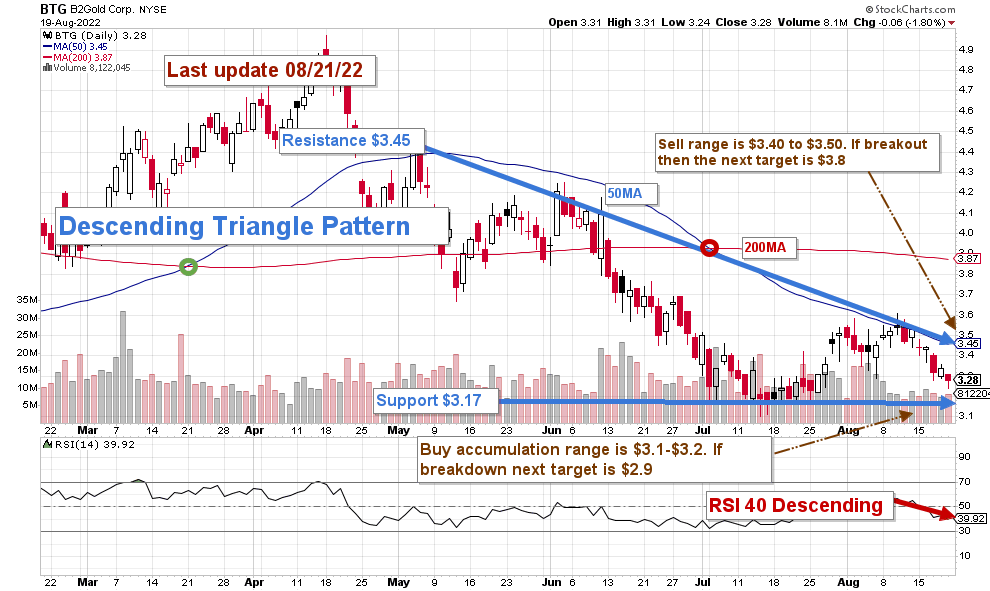
BTG forms a descending Triangle pattern with resistance at $3.45 and support at $3.17. Warning: A descending triangle is a bearish chart pattern.
The dominant strategy that I usually promote in my marketplace, “The Gold and Oil Corner,” is to keep a core long-term position and use about 50%-60% to trade LIFO while waiting for a higher final price target to sell your core position at or above $6-$7.
Trading LIFO lets you keep your oldest shares in the game while allowing you to trade the waves and accumulate significant gains without jeopardizing your investment.
I recommend selling partially between $3.40 and $3.50 and potentially waiting for a test at $3.80-$3.90 (200MA) in case of substantial momentum, which seems improbable in 2022 with the Fed continuously hiking aggressively with a potential 75-point for the third time soon. Conversely, it is reasonable to buy back on any weakness below $3.20 with possible lower support at $2.90.
I think it is now the time to accumulate BTG, which presents a great value long-term.
Note: The LIFO method is prohibited under International Financial Reporting Standards (IFRS), though it is permitted in the United States to generally accepted accounting principles (GAAP). Therefore, only US traders can apply this method. Those who cannot trade LIFO can use an alternative by setting two different accounts for the same stock, one for the long term and one for short-term trading.
Warning: The TA chart must be updated frequently to be relevant. It is what I am doing in my stock tracker. The chart above has a possible validity of about a week. Remember, the TA chart is a tool only to help you adopt the right strategy. It is not a way to foresee the future. No one and nothing can.
Author’s note: If you find value in this article and would like to encourage such continued efforts, please click the “Like” button below as a vote of support. Thanks.
Be the first to comment