

jewhyte/iStock via Getty Images
This exchange-traded fund (“ETF”) review series aims at evaluating products regarding the relative past performance of their strategies and quality metrics of their current portfolios. Holdings and their weights change over time: reviews are updated when necessary.
AVDV strategy and portfolio
The Avantis International Small Cap Value ETF (NYSEARCA:AVDV) was launched on 09/24/2019. As of writing, it has about 1300 holdings, a distribution yield of 3.64%, and a total expense ratio of 0.36%. Distributions are paid semi-annually. AVDV invests in small caps with higher profitability and value characteristics without tracking a specific index.
As described in the prospectus by Avantis Investors,
The portfolio managers define “value characteristics” mainly as adjusted book/price ratio (though other price to fundamental ratios may be considered). The portfolio managers define “profitability” mainly as adjusted cash from operations to book value ratio (though other ratios may be considered). The portfolio managers may also consider other factors when selecting a security, including industry classification, the past performance of the security relative to other securities, its liquidity, its float, and tax, governance or cost considerations.
Hereafter I will use the Vanguard FTSE All-World ex-US Small-Cap Index Fund (VSS) as a benchmark.
AVDV is stricter than VSS in avoiding large companies.
AVDV size segments (Chart: author with Fidelity data)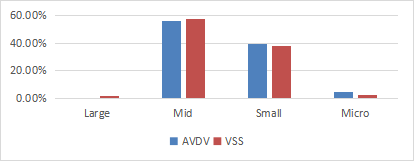
Japan is by far the heaviest country with almost 28% of asset value, followed by the U.K. (15.3%). Other countries are below 10%. Compared to VSS, AVDV overweights the top 2 countries, and also Australia, Europe, and Israel. It underweights Canada and ignores Asia. There is no exposure to China and Taiwan, which is a good point for investors who want to limit geopolitical and regulatory risks.
AVDV countries (Chart: author with Fidelity data)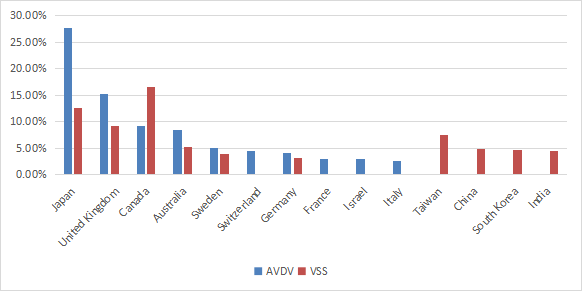
The portfolio has three major sectors: industrials (18.2%), materials (15.9%) and financials (15.5%). Consumer discretionary and energy are at about 10%, then other sectors are below 4%. Compared to VSS, AVDV overweights the top 5 sectors listed above. It underweight real estate, technology, and to a lesser extent healthcare and utilities.
AVDV sectors weights (Chart: author with Fidelity data)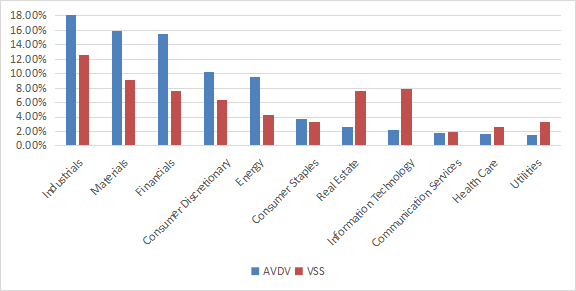
As expected for a value ETF, AVDV is significantly cheaper than VSS. The next table compares the usual valuation ratios. The difference in price/sales and price/cash flow is especially impressive.
|
AVDV |
VSS |
|
|
Price / Earnings TTM |
7.06 |
10.89 |
|
Price / Book |
0.91 |
1.36 |
|
Price / Sales |
0.51 |
0.95 |
|
Price / Cash Flow |
4.3 |
8.16 |
(data source: Fidelity)
The top 10 holdings listed below represent 6% of asset value. The heaviest one weights about 0.7%, so the risk related to individual stocks is very low.
|
COMPANY |
TICKER |
SECTOR |
WEIGHT |
|
Crescent Point Energy Corp |
CPG.TO |
Energy |
0.68% |
|
Rheinmetall AG |
RHMG.DE |
Industrials |
0.65% |
|
Tate & Lyle PLC |
TATE.L |
Consumer Staples |
0.63% |
|
Cosmo Energy Holdings Co Ltd |
5021.T |
Energy |
0.63% |
|
Howden Joinery Group PLC |
HWDN.L |
Industrials |
0.60% |
|
Vermilion Energy Inc |
VET.TO |
Energy |
0.57% |
|
Banca Popolare di Sondrio SPA |
BPSI.MI |
Financials |
0.56% |
|
ASR Nederland NV |
ASRNL.AS |
Financials |
0.56% |
|
Cembra Money Bank AG |
CMBN.S |
Financials |
0.56% |
|
Johnson Matthey PLC |
JMAT.L |
Materials |
0.55% |
Past performance
Since inception, AVDV beats the ex-U.S. small cap benchmark (VSS), but lags the U.S small cap index Russell 2000 (IWM). However, this is a very short period of time: we can’t assess the strategy with 2.5 years of historical data.
|
since 1/10/2019 |
Total Return |
Annual.Return |
Drawdown |
Sharpe ratio |
Volatility |
|
AVDV |
12.75% |
4.43% |
-42.98% |
0.22 |
25.56% |
|
VSS |
8.32% |
2.93% |
-39.89% |
0.16 |
23.17% |
|
IWM |
19.19% |
6.55% |
-41.47% |
0.27 |
26.29% |
Data calculated with Portfolio123
In the same time, the U.S. large cap benchmark S&P 500 (SPY) has returned 36.53% (11.9% annualized).
Since Inception, AVDV has gained about 7% in share price (excluding dividends).
AVDV share price (TradingView on Seeking Alpha)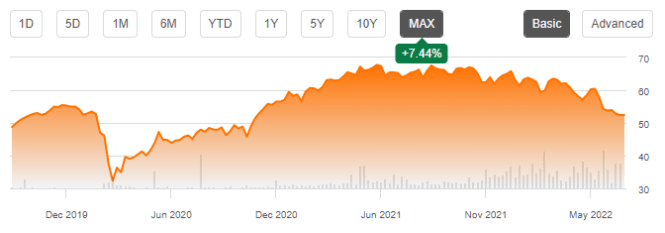
Takeaway
AVDV is designed as a value-oriented international small cap fund, but it is also a dividend ETF with a yield above 3.5%. As expected, valuation looks attractive compared to a benchmark in the same universe.
Profitability is also a criterion of component selection, so we can expect AVDV to avoid the most obvious value traps. It has no exposure to Russia, China and Taiwan, which cuts geopolitical and regulatory risks compared to other ex-US ETFs.
Almost 50% of asset value is in 3 sectors: industrials, materials and financials. The fund is well diversified: no sector weights more than 20% and no holding weights more than 1%. However, Japan represent almost 28% of asset value. Price history is too short to evaluate the strategy, but it looks promising: AVDV beats a benchmark in the same universe by 1.5 percentage point in annualized return.
In conclusion, AVDV is an attractive fund for investors oriented to dividend and value who are looking for international diversification. For transparency, a part of my equity investments is split between a passive ETF allocation (AVDV is not part of it) and my actively managed Stability portfolio (14 stocks), disclosed and updated in Quantitative Risk & Value.
Be the first to comment