

HelpingHandPhotos/iStock via Getty Images
Overview
Most of my Seeking Alpha articles have focused on growth companies. However, I believe in allocating a portion of my portfolio to lower risk positions that will deliver steady long-term returns with below market volatility (beta) i.e., investments that I can depend on to hold their value relatively well in bear markets and liquidate for bottom fishing expeditions.
I believe Automatic Data Processing Inc (NASDAQ:ADP) has many characteristics that make it potential candidate for this purpose.
Stock price and beta
Since 2015, ADP stock has delivered a 3x+ return (figure 1, blue line), slightly behind its main human capital management competitor Paychex (PAYX) (orange line) but higher than TriNet (TNET), Workday (WDAY) and the S&P 500 index (red, purple, and green lines respectively)
Figure 1: ADP stock price vs comparables (indexed)
Created by author using publicly available stock prices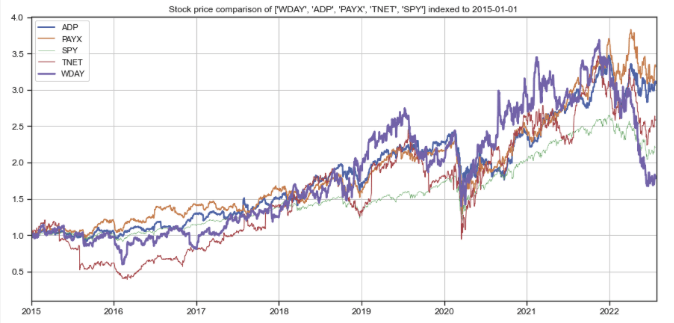
ADP has also exhibited the lowest volatility amongst its peers (figure 2, blue line) with a 5-year, below-market beta of about 0.83. Paychex (orange line) has a beta of around 1.0, while TriNet and Workday have betas of 1.2 and 1.4 respectively (red and green lines).
Figure 2: ADP stock beta vs comparables (indexed)
Created by author using publicly available financial data and stock prices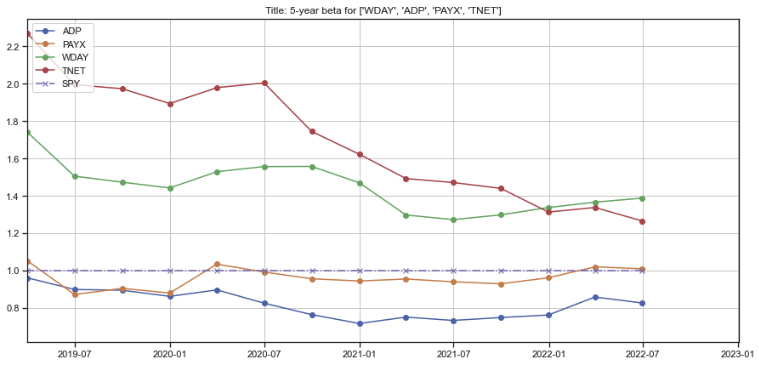
Business lines and client exposure
Overview
ADP was founded in 1949 to help free businesses from payroll and other non-core tasks so that managers can focus on core competencies that create value for both their customers and shareholders. Today, it is one of the leading and largest global providers of cloud-based human capital management solutions. The company operates in 140 countries and territories (figure 3), serves 990,000 clients, and pays over 38 million workers, including 1 out of 6 workers in the United States and 14 million outside the US.
Figure 3: ADP global coverage
ADP investor presentation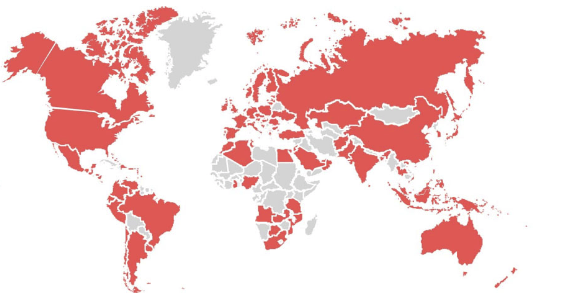
ADP provides human resource (HR) outsourcing solutions, which includes HR administration, payroll, employee benefits, employer liability, and human capital management (HCM) to assist employers in managing the entire worker spectrum and employment cycle. The company has innovated over the years, developing smartphone apps to enhance the productivity of HR managers, artificial intelligence / machine learning tools that provide companies with insights into compensation practices and help screen potential candidates for job openings, as well as organizational benchmarks that enable clients to compare headcount, labor costs, turnover, and diversity against other their peers. ADP has also developed tools to help ensure clients comply with new regulations (e.g., leave laws) and facial recognition for employee time tracking and manage safe levels of occupancy.
The company operates two reportable segments:
(1) Employer Services (ES) offers clients technology-based human capital management solutions, including payroll, benefits administration, compliance, insurance services, and retirement services, and
(2) Professional Employer Organization (PEO) provides clients with comprehensive employment solutions under a contractual arrangement in which the clients’ employees are co-employed by ADP and the client. The client company continues to direct its operational and employees’ day-to-day activities, while the PEO becomes the employer of record for tax purposes, filing payroll taxes under its own tax identification numbers and taking responsible for withholding proper taxes, paying unemployment insurance taxes and providing workers’ compensation coverage. A PEO reduces costs for clients by leveraging its scale to negotiate for insurance coverage and frees the client from the responsibility of many non-core administrative tasks.
ADP’s revenues come primarily from the fees it charges clients for services (figure 4). In addition, it holds client funds for tax and payroll payments, which it invests primarily in AAA and AA rated debt and earns interest income. In 2021, the funds generated $422 million–less than 3% of total FY 2021 revenue but about 11% of EBITDA.
Figure 4: Composition of ADP revenues
ADP 10-K filing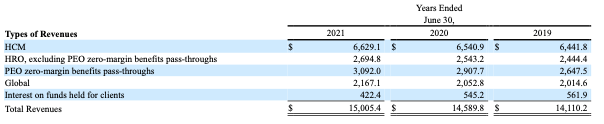
Customer segmentation
ADP is pre-dominantly a US-centric company, with 85% of revenues coming from the US. The client base is well diversified, with one-third of revenues coming from more than 750,000 US small businesses (< 50 employees) and 75,000 major accounts (50 to 1,000 employees), and one-third of revenues from PEOs. Just 7% of revenues are derived from large businesses (>1,000 employees) (figure 5).
Figure 5: ADP’s customer segments
ADP investor presentation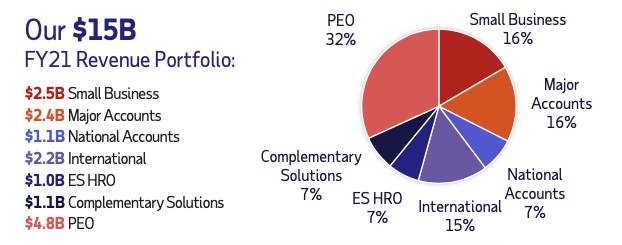
Drivers of long-term growth
ADP operates in a large and growing market. The company estimates the total addressable market at $150 billion (compared to the company’s revenues of $15 billion) and is expected to grow 5-6% per year going forward. Growth drivers include:
Increasing complexity of regulations and reporting requirements
Employers have a lot to navigate through–the large number of every-changing employment and human resource-related rules and regulations, many of them specific to local regions, makes it very difficult for in-house human resource managers and mom-and-pop accountants or bookkeepers to keep up with and implement accurately (figure 6). Furthermore, non-compliance can be costly and exposes companies to potentially onerous fines and litigation. Complex rules and excessive regulation benefit ADP.
Figure 6: Ever-changing rules and regulations
ADP investor presentation
Ongoing trend towards more outsourcing
Human resource, payroll, benefit, and retirement administration, talent management, and employee liability management are mission critical but non-core functions that do not contribute directly to a company’s sales, customer satisfaction, or shareholder value. As these functions get more complex, outsourcing becomes an increasingly attractive option for companies that need to focus on their core competencies and operations. This has driven many firms to outsource their back-office administration to professional employer organizations, which accounts for the higher growth in ADP’s PEO segment, which will be described below.
Growth in the number of small businesses
A large majority of ADP’s clients are small businesses with less than 50 employees. The number of businesses applications has accelerated in recent years (figure 7), further expanding the company’s pool of potential clients.
Figure 7: Growth in the number of business applications
St. Louis Federal Reserve (FRED) data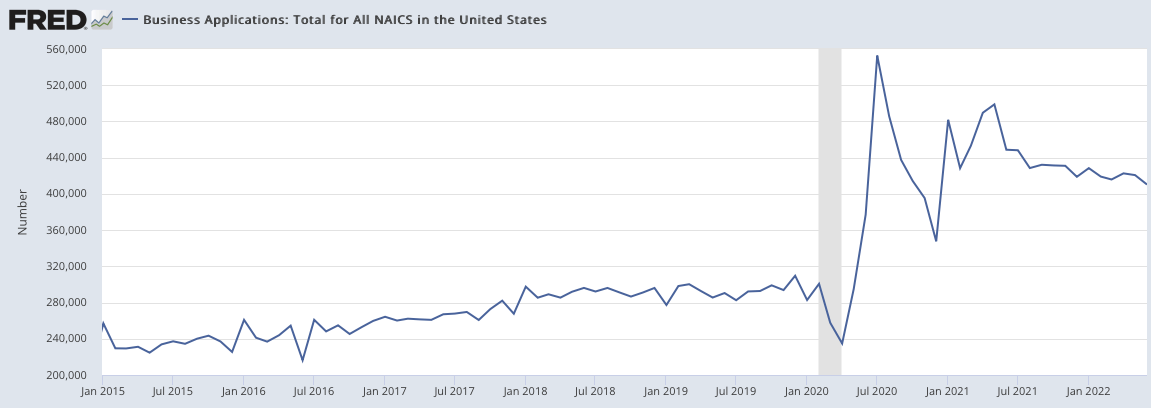
Market share gains
Over the last 4 years, ADP has grown at a rate of 200 basis points more than the HR outsourcing market (figure 8), which I attribute to its brand, reputation, technological innovation, and customer satisfaction. Noteworthy is the fact that ADP’s implementation net promoter score has increased by 40 points since 2017.
Figure 8: ADP’s market share gain
ADP investor presentation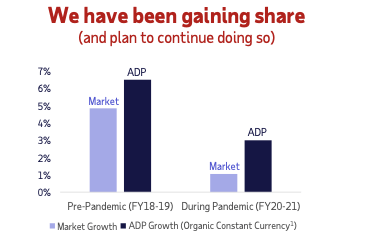
Financials and operational metrics
I analyze how revenues, operational metrics, and margins contribute to shareholder value.
Revenue growth
Over the past five years, HR outsourcing and PEO companies have outgrowth both GDP and employment by a wide margin, but ADP’s revenue growth lags its 2 main competitors (figure 9, blue line)
Figure 9: ADP revenues vs competitors, indexed
Created by author using publicly available financial data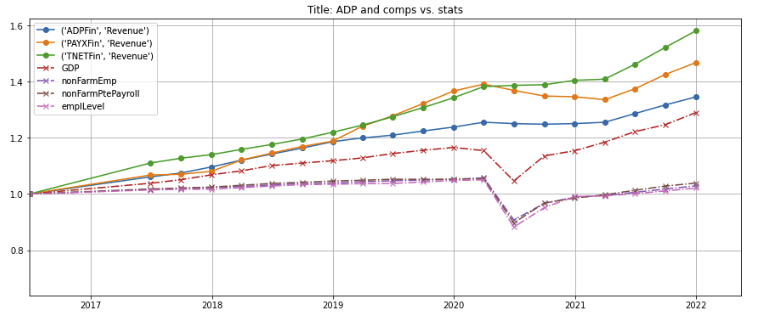
ADP’s per-share revenue increased by almost 50% over the last 5 years (figure 10, blue line) due to its more aggressive share buyback program (figure 11, blue line). Even though Paychex’s delivered stronger revenue growth, its per-share revenues increased relatively less because of its more limited buyback program (figures 10 and 11, orange line).
Figure 10: ADP’s per-share revenues vs competitors, indexed
Created by author using publicly available financial data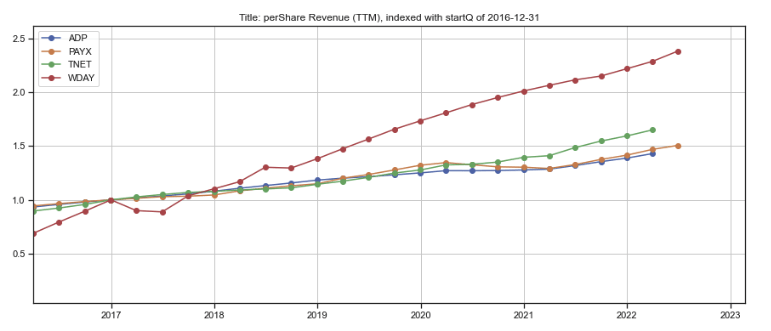
Figure 11: ADP’s share count, indexed
Created by author using publicly available financial data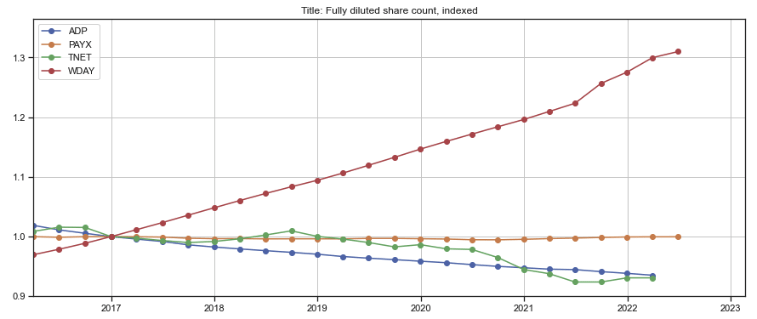
Growth stability
As the COVID-19 outbreak swept through the US, revenues for ADP, Paychex and TriNet have held up better than GDP and employment levels (Figure 12, purple, brown, and pink dashed lines) but ADP and Paychex’s recoveries have fallen a little behind GDP (red dashed line).
Figure 12: Revenue growth of ADP vs competitors through the COVID-19 pandemic
Created by author using publicly available financial data, St. Louis Federal Reserve (FRED) data
ADP’s year-over-year per-share quarterly revenue growth decelerated as COVID-19 lockdowns were instituted in the first half of 2020. However, it continued to grow through the pandemic (figure 13, purple bars in Q2 and Q3) despite soaring unemployment and rebounded strongly beginning in the fourth quarter of 2020 (purple bar in Q4), demonstrating the resilience of ADP’s business model.
Figure 13: Quarterly per-share revenue, grouped by quarter
Created by author using publicly available financial data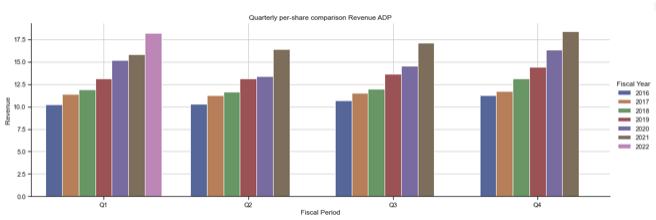
Operational metrics
Revenue breakdown by segment
ADP’s employer services segment (figure 14, green line) comprised almost about two-thirds of total revenues, while its PEO segment accounted for one-third of revenues (orange line). Interest on funds held for clients (blue line) made up the remainder of revenues.
Figure 14: ADP revenues by segment
Created by author using publicly available financial data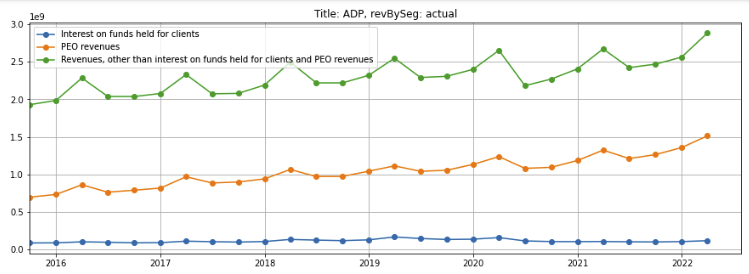
While just half the revenues of employer services, the PEO segment (figure 15, orange line) has grown 50% faster than employer services (green line).
Figure 15: ADP revenues by segment, indexed
Created by author using publicly available financial data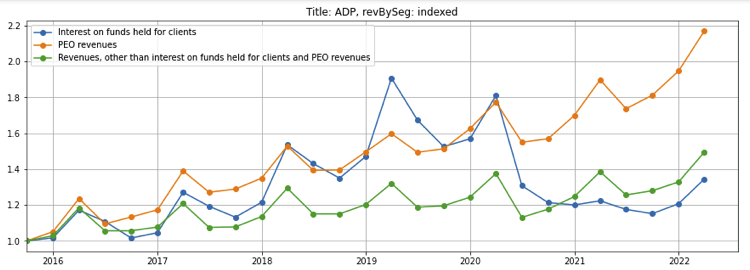
Employer Services revenue vs Paychex
ADP’s employer services revenue (figure 16, blue line) has grown at the same rate as GDP (dotted green line). However, it has grown less than Paychex (orange dashed line), which I note generates about one-third of its revenues from the faster growing PEO segment.
Figure 16: ADP employer services revenue vs Paychex
Created by author using publicly available financial data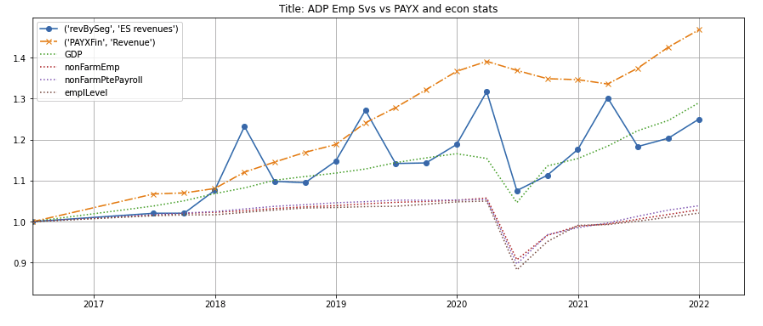
PEO revenue vs TriNet
ADP’s PEO revenue (figure 17, blue line) has grown faster than the overall revenue of TriNet (dashed orange line), which is predominantly a PEO provider. Barring unforeseen regulatory changes, I expect PEO revenues to continue outgrowing the employment services segment for the foreseeable future.
Figure 17: ADP PEO revenue vs TriNet
Created by author using publicly available financial data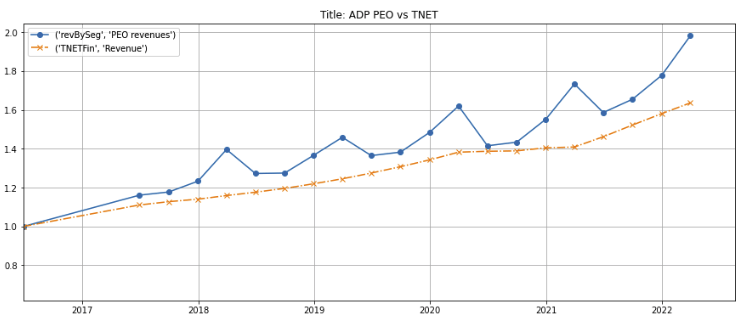
Interest on funds held for clients
Interest on funds held for clients is a function of two factors: the amount of client funds held, which is directly correlated to the size of the employer services segment; and the yield on client funds, which is in turn driven by interest rates.
(1) The amount of client funds held increased by about 30% over the last 6 years as ADP’s client base grew (figure 18, solid red line)
(2) The yield on client funds declined to below 1.5% in 2021 (dotted red line) after the Federal Reserve dropped the Federal Funds rate following the outbreak of the COVID-19 pandemic, which caused the 3-month and 10-year treasuries yields to plummet (dotted blue and green lines). Interestingly, ADP’s yield on client funds has been less volatile than treasury yields due to ADP’s conservative cash management practices. (For the sake of comparison, Charles Schwab (SCHW) and Company’s average gross yield on its client cash balance was 1.4% in 2021).
I expect revenues from interest on funds held for clients to increase as the Fed raises rates to combat rising inflation. Assuming ADP’s yields tick up to 2.2% level in 2019, interest revenue could potentially rise by over 40%.
Even though interest revenue constitutes a small proportion of ADP’s overall revenues, the impact of rising rates will be meaningful as the incremental margin on interest earned is very high and much of the increase should flow directly to the bottom line.
Figure 18: ADP average client cash balances and yield on cash balances
Created by author using publicly available financial data, St. Louis Federal Reserve (FRED) Data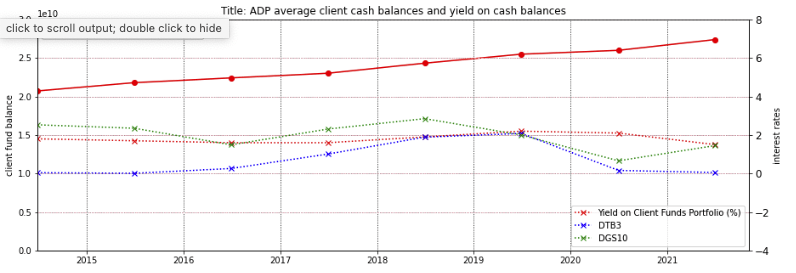
Leading indicators
-
Client retention ticked up from 90.5% in 2020 to 92.2% (solid red line, left axis).
-
New bookings to revenue for the employer services segment (dotted blue line, right axis) ticked down beginning in 2020 following the COVID-19 outbreak but has recovered as new business bookings increased 15% to $1.7 billion for the fiscal year ended June 2022, up from $1.5 billion the year-ago period. This brings the new bookings to revenue ratio up to 15.5%.
-
Pays per control (dotted red line, right scale), which represents the number of employees on sample of ADP US clients’ payrolls as measured on a same-store-sales basis, similarly dropped in 2020 and 2021, but turned positive for the quarter ended June 2021, and was back up to 7% for the quarter and fiscal year ended June 2022.
Figure 19: Client retention, pays per control, and new booking metrics
Created by author using publicly available financial data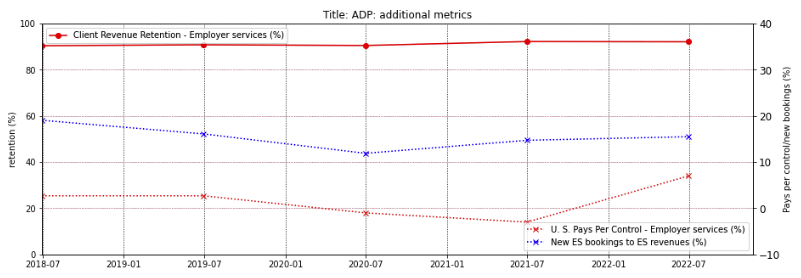
The pays per control increase of 7% and new bookings to revenues of 15% are indications of a recovery in employment and ADP’s business and is sufficient to generate an attractive revenue growth over the 8% client attrition.
Margins
Since 2017, Paychex’s revenue has grown faster than ADP’s. However, ADP’s per-share EBITDA growth has exceeded Paychex’s (figure 20, blue and orange lines) because of expanding EBITDA margins due to its stable gross margins (which indicates some degree of pricing power) and operating leverage (figure 21, blue and orange lines).
Figure 20: ADP per-share EBITDA vs competitors
Created by author using publicly available financial data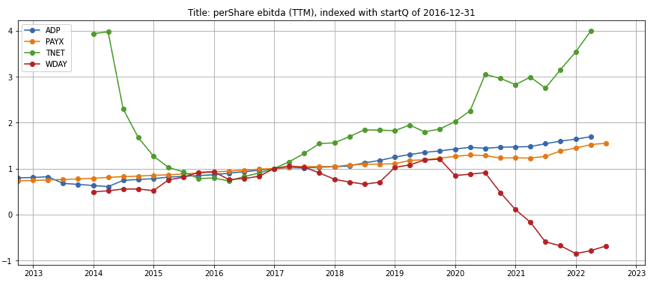
Figure 21: ADP EBITDA margin vs competitors
Created by author using publicly available financial data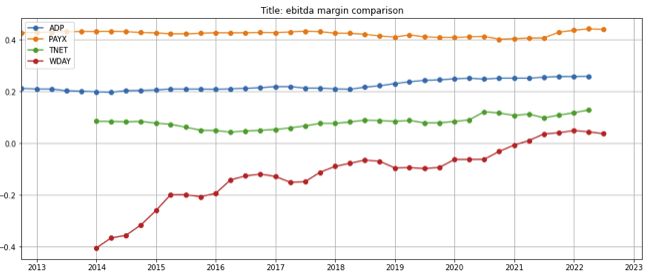
However, I note that ADP and Paychex’s per-share free cash flow have grown at roughly at the same rate over the last 10 years.
Figure 22: ADP’s per-share free cash flow vs competitors
Created by author using publicly available financial data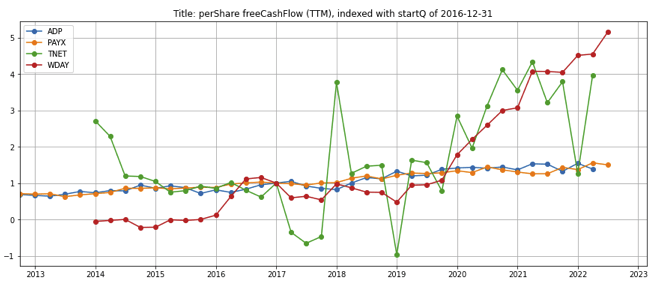
Valuation
ADP’s valuation has expanded steadily over the last decade, causing its free cash flow and earning yields to decline steadily (figure 23, blue and orange lines). The free cash flow yield remains below 10-year treasury rates (green dotted line)
Figure 23: ADP valuation metrics
Created by author using publicly available financial data and stock prices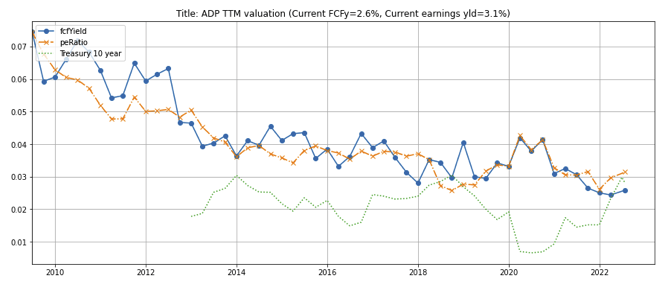
ADP’s valuation has moved roughly in tandem with Paychex, but both companies’ yields spread over 10-year treasuries are very narrow at this time (figure 24, orange and green lines), implying a thin margin of safety and increased risk of a stock price pullback should near-term earnings fall short of expectations.
However, given ADP’s stability and steady compounding characteristics, I believe ADP’s consistent long-term growth may offset the near-term valuation risk and deliver an attractive risk adjusted return for patient investors.
Figure 24: ADP valuations vs competitors
Created by author using publicly available financial data and stock prices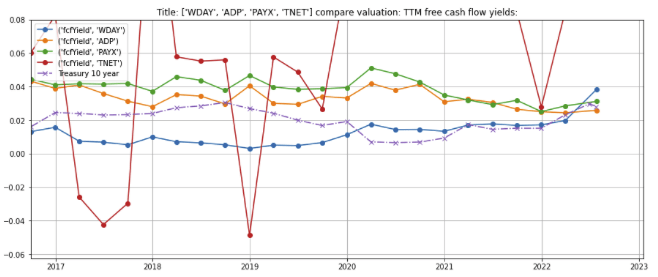
Concerns
1. Recession risk: if the aggressive Federal Reserve rate hikes tip the economy into a recession, the ensuing job losses could negatively impact ADP’s growth and value.
Instead of analyzing the situation with a theoretical “thought experiment”, I examined ADP’s historical revenues from 2008-11 as the world went through the Global Financial Crisis (GFC). For the fiscal year ended June 30, 2010–the worst year of the GFC, the company’s employer services segment experienced a di minimus contraction of $1.9 million, which was more than offset by a $131 million growth in the PEO services segment (figure 25). Operating income for the employer services segment dipped by 2%, but the 8% increase in the PEO services segment was insufficient to offset the decrease (figure 26).
(The Dealer Services segment, which provided auto, truck, motorcycle, recreational vehicle, and other dealership management systems was divested in 2014 and is not relevant for purposes of our analyses).
Figure 25: ADP’s revenues for 2008-2011
ADP Form 10-K: 2008-11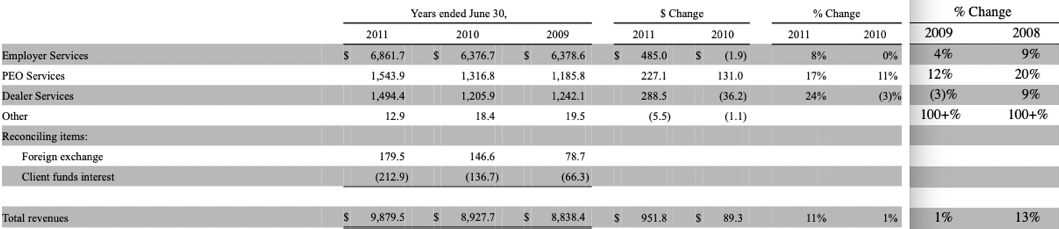
Figure 26: ADP’s earnings from continuing operations before income taxes for 2008-11
ADP Form 10-K: 2008-11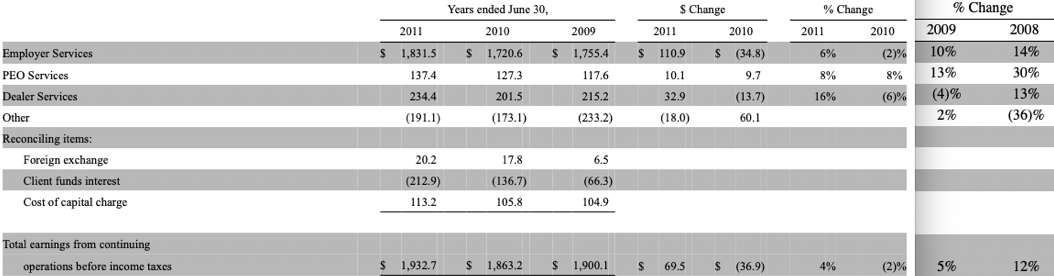
2. Valuation: Discussed above.
3. Unexpected changes to or the simplification of the US employment laws or tax code could reduce the value of ADP’s services: Even though this is currently a low probability risk, I plan to keep a watch as the potential consequences could be severe.
In summary
-
Automatic Data Processing Inc. has many characteristics that make it a safe holding that can delivery consistent returns with below market volatility over the long term.
-
Over the last five years, it has delivered a 3x+ return by benefiting from a continuation of the trend towards outsourcing, increasingly complex labor and employment regulations, growth in the number of small businesses, and market share gains.
-
The company’s growth decelerated with the outbreak of the COVID-19 pandemic, but a number of its key operational metrics for client retention, new business, and payrolls per client have bottomed out and trending upwards.
-
My outlook for ADP’s key metrics is as follows:
|
Metric |
Historical |
Outlook |
|
New bookings, pays per control, and client retention |
All 3 metrics have been ticking down over the last 5 years |
Bottomed out after the COVID-19 pandemic and have started to move up |
|
Per-Share revenue growth |
ca. 8-10% p.a. |
Likely to continue as the key drivers of long-term growth remain intact |
|
EBITDA margins |
Grown faster than revenues, stemming from ADP’s ability to maintain its gross margins due to pricing power as well as operating leverage |
Likely to continue; in addition, the increase in interest rates will provide a boost to interest income on client cash balances |
|
Valuation |
Valuation multiple has expanded over the last decade |
Risk of near-term multiple compression due to rising interest rates. However, I expect ADP’s long-term growth to offset the near-term valuation risk |
-
The stock has pulled back less than the overall market and is not a steal at a free cash flow and earnings yield of 2.6% and 3.1%. However, I believe ADP’s consistent long-term growth will offset the near-term valuation risk and deliver an attractive risk adjusted return for patient investors.
Be the first to comment