

AUD/USD PRICE ANALYSIS
AUD/USD FUNDAMENTAL BACKDROP
This week has bolstered the Australian Dollar against the greenback largely due to a recent surge in commodity prices particularly iron ore prices (Australia’s biggest commodity export), after Chinese investors re-entered markets. Commodity prices are expected to continue the surge as long as the global recovery unfolds as expected. This could be a strong sign for further optimism around the Aussie Dollar however, a worrying sign for the RBA as a strengthening AUD could hinder exports.
Yesterday, Australian economic data showed that the unemployment level is falling which supported AUD/USD upside. A weakening U.S. Dollar is adding to their worries as many analysts do not expect much more in terms of rising U.S. yields which could limit the recent strength in the Dollar. The $1.9 trillion U.S. stimulus package, if passed at that figure, could theoretically stretch Dollar weakness which could support the AUD/USD uptrend.
Rising yields on Australian 10-year bonds (see chart below) provide yet another fundamental support structure for the Aussie Dollar. A sustained rise in bond yields across maturities may likely prolong the positive correlation between AUD/USD and rising yields.
AUSTRALIAN 10Y BENCHMARK GOVERNMENT BOND VS AUD/USD
Chart prepared by Warren Venketas, Refinitiv
Later today U.S. PMI data (14:45GMT) will be released which could cause some price volatility leading up to the announcement. A notable deviation from forecasts (58.5) may further this volatility so ensuring sound risk management technique is essential.

AUD/USD TECHNICAL ANALYSIS
Starts in:
Live now:
Dec 21
( 18:12 GMT )

Keep up to date with price action setups!
Trading Price Action
AUD/USD DAILY CHART:
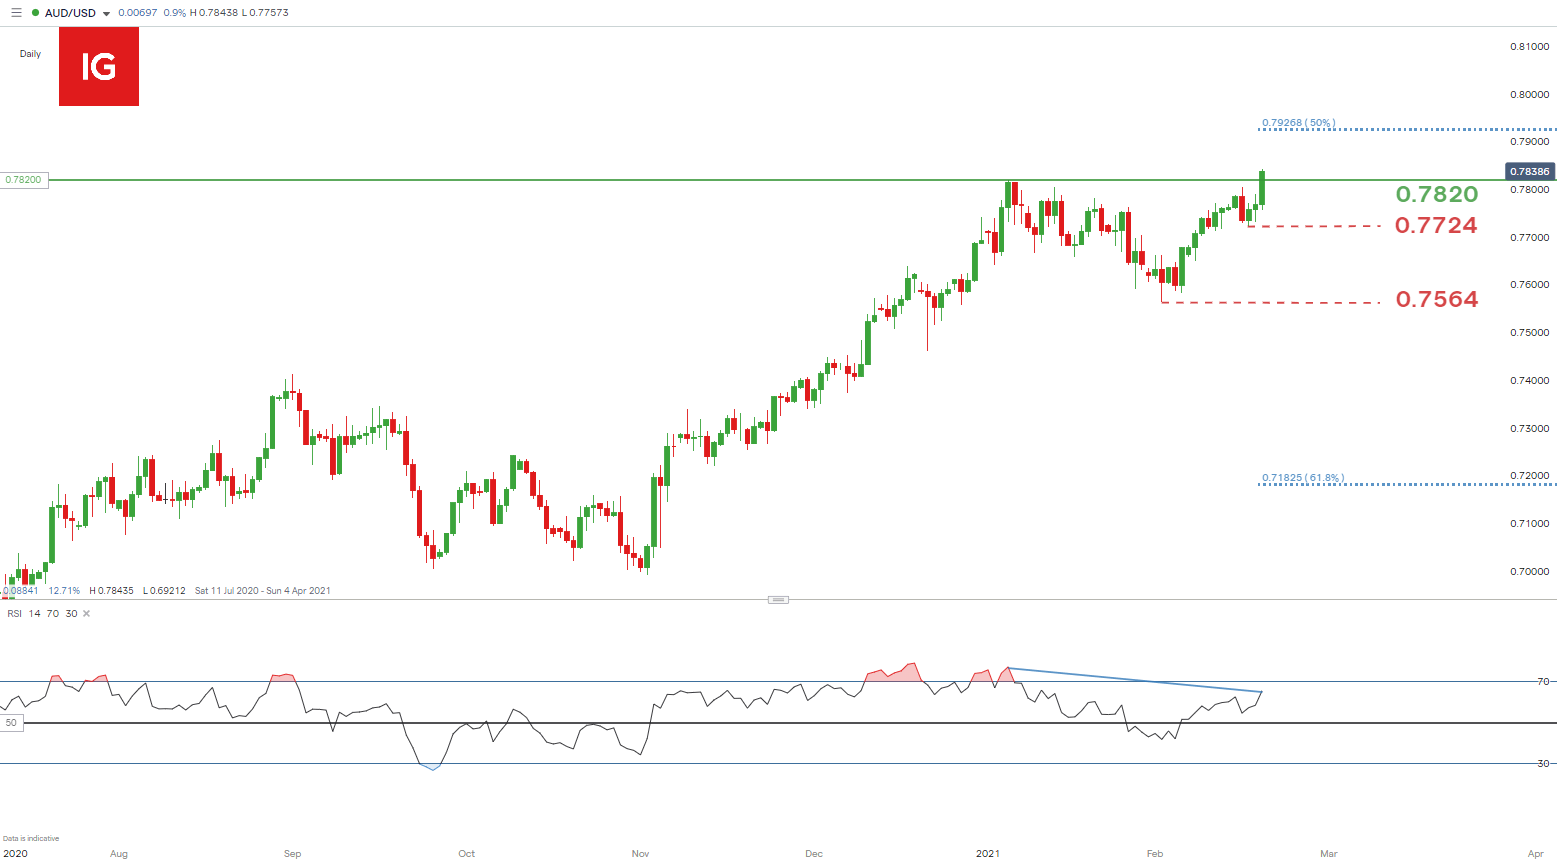
Chart prepared by Warren Venketas, IG
AUD/USD has extended above the February swing high at 0.7805 and now seeks out the 2021 January high at 0.7820. The 0.7820 level could be a level of exhaustion for the pair with profit taking possible around this resistance zone.
The Relative Strength Index (RSI) suggests that the bullish momentum is slowing (blue), as similar price levels in January printed far higher RSI values. This is known as divergence, but more specifically bearish divergence in this case. That is, price rejection at the resistance zone could lead to a possible trend reversal toward the 0.7724 swing low which will be succeeded by the 0.7564 support zone if breached.
From the bullish perspective, a confirmation candle close above the 0.7820 will bring into focus the 0.7927 resistance target ( 50% Fibonacci retracement level).
Key technical points to consider:
- Key levels – 0.7820 resistance
- Technical indicators – RSI divergence
- Economic announcements next week
- IGCS data
IG CLIENT SENTIMENT DATA SUGGESTIVE OF FURTHER UPSIDE
| Change in | Longs | Shorts | OI |
| Daily | -23% | 1% | -8% |
| Weekly | -25% | 0% | -10% |
IGCS shows retail traders are net short on AUD/USD, with 65% of traders currently holding short positions (as of this writing). At DailyFX we typically take a contrarian view to crowd sentiment, and the fact traders are net-short is suggestive of a bullish bias.
— Written by Warren Venketas for DailyFX.com
Contact and follow Warren on Twitter: @WVenketas
Be the first to comment