

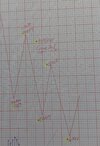
I have prepared two Curves indicating the possible direction of the AUDUSD .
Curve No 1 : Indicates the possibility of price moving down into the 21st September for Low then up till 20th October for Main Top and down till 4th November for Low.
Curve No 2 : Indicates the same pattern of direction with trend up till 20th October where Main Top is indicated .
Out of the two potential Low dates the * 4th October looks like s stronger possibility due to the convergence of two Cycles into this date so my strategy would be to wait and see if we trade below the 21st September point and if that date can not hold as Low we should then continue to move down into the 4th October so I will be watching the next few sessions closely to see how it plays out . There is also another Minor swing point indicated for the 12th October which could either turn out to be Minor high or low but it appears the prevailing direction out from the projected Lows is up till the 20th October then we could be lower into the 4th November which should be another significant turning point
Be the first to comment