

AUD/USD started a fresh decline from well above 0.7250. NZD/USD is also declining, and it might accelerate lower below the 0.6800 level.
Important Takeaways for AUD/USD and NZD/USD
· The Aussie Dollar started a major decline from the 0.7300 resistance against the US Dollar.
· There was a break below a connecting support trend line at 0.7170 on the hourly chart of AUD/USD.
· NZD/USD also started a major decline from well above the 0.7000 level.
· There is a key bearish trend line forming with resistance near 0.6855 on the hourly chart of NZD/USD.
AUD/USD Technical Analysis
The Aussie Dollar started a major decline after it failed to clear 0.7300 against the US Dollar. The AUD/USD pair traded below the 0.7250 and 0.7200 support levels to move into a bearish zone.
The pair even broke the 0.7150 support and the 50 hourly simple moving average. Besides, there was a break below a connecting support trend line at 0.7170 on the hourly chart of AUD/USD. The pair is now accelerating lower below the 0.7150 level.
An initial support on the downside is near the 0.7120 level. The next major support is near the 0.7100 level. If there is a downside break below the 0.7100 support, the pair could extend its decline towards the 0.7050 level.
On the upside, an immediate resistance is near the 0.7150 level. It is near the 23.6% Fib retracement level of the recent decline from the 0.7208 swing high (formed on FXOpen) to 0.7136 low.
The next major resistance is near the 0.7175 level. It is near the 50% Fib retracement level of the recent decline from the 0.7208 swing high to 0.7136 low. A close above the 0.7175 level could start a steady increase in the near term. The next major resistance could be 0.7250.
NZD/USD Technical Analysis
The New Zealand Dollar also followed a similar path from the 0.7050 zone against the US Dollar. The NZD/USD pair traded below the 0.7000 and 0.6920 support levels to move into a bearish zone.
The pair even broke the 0.6880 support and the 50 hourly simple moving average. The pair is now showing bearish signs below the 0.6830 level. An initial support on the downside is near the 0.6820 level.
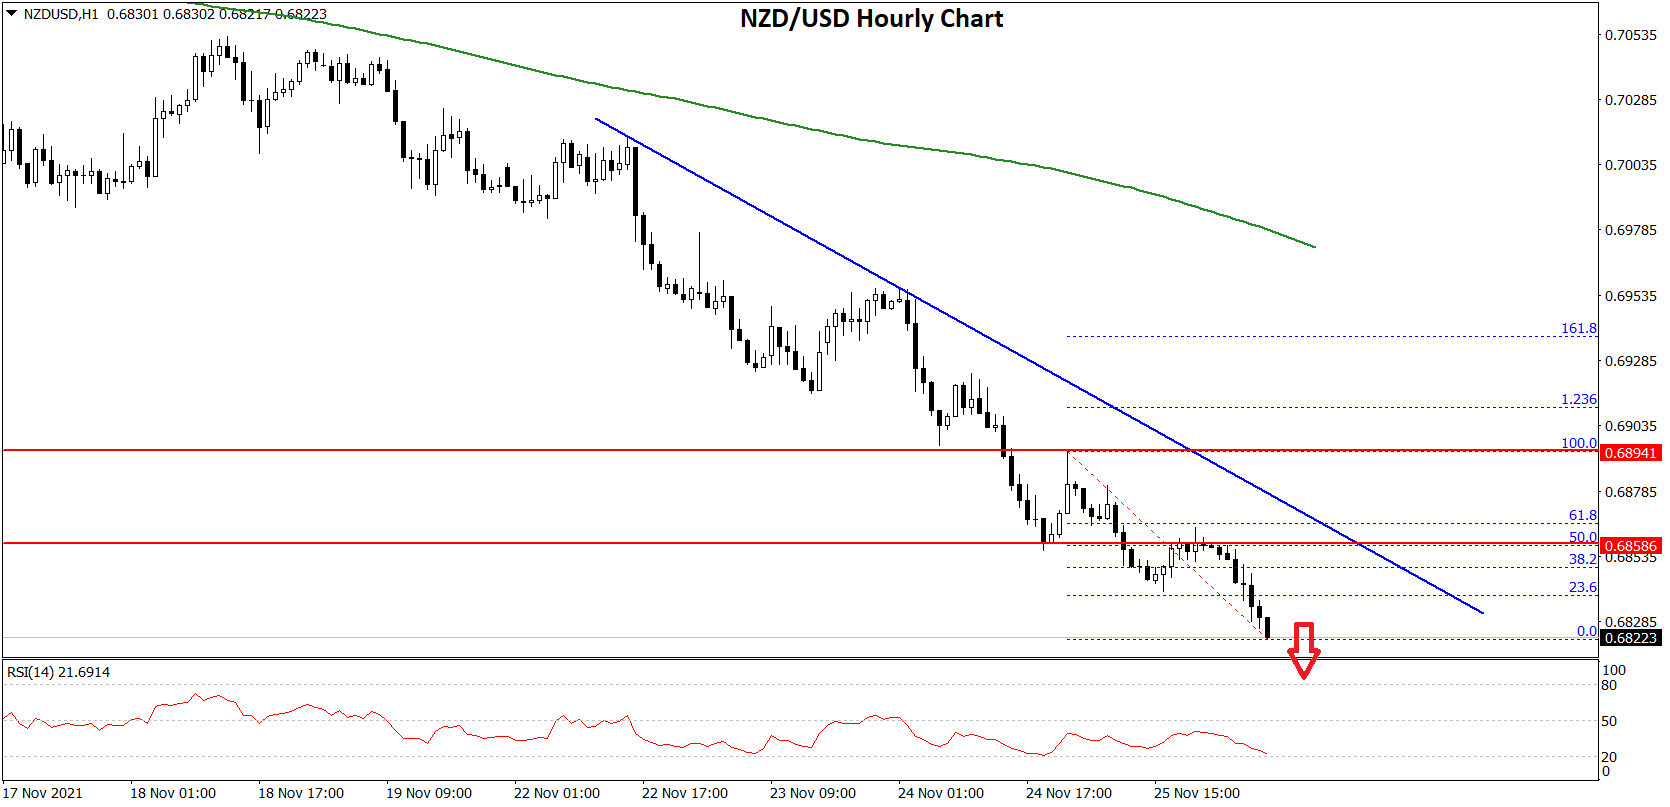
The next major support is near the 0.6800 level. If there is a downside break below the 0.6800 support, the pair could extend its decline towards the 0.6750 level.
On the upside, an immediate resistance is near the 0.6835 level. It is near the 23.6% Fib retracement level of the recent decline from the 0.6894 swing high to 0.6817 low. The next major resistance is near the 0.6850 level.
There is also a key bearish trend line forming with resistance near 0.6855 on the hourly chart of NZD/USD. The trend line is close to the 50% Fib retracement level of the recent decline from the 0.6894 swing high to 0.6817 low.
A close above the 0.6850 level could start a steady increase in the near term. The next major resistance could be 0.6900, above which the pair could rise steadily towards the 0.6950 level in the near term.
This forecast represents FXOpen Markets Limited opinion only, it should not be construed as an offer, invitation or recommendation in respect to FXOpen Markets Limited products and services or as financial advice.

Be the first to comment