

AUD/USD started a fresh increase above the 0.7300 zone. NZD/USD is also showing positive signs and there was a clear move above the 0.6850 resistance.
Important Takeaways for AUD/USD and NZD/USD
· The Aussie Dollar started a fresh increase after it cleared 0.7250 against the US Dollar.
· There was a break above a key bearish trend line with resistance near 0.7235 on the hourly chart of AUD/USD.
· NZD/USD also climbed higher after forming a base above the 0.6720 level.
· There was a move above a major bearish trend line with resistance near 0.6775 on the hourly chart of NZD/USD.
AUD/USD Technical Analysis
The Aussie Dollar found support near the 0.7180 zone against the US Dollar. The AUD/USD pair traded as low as 0.71654 on FXOpen before it started a fresh increase.
There was a clear move above the 0.7220 and 0.7250 resistance levels. The pair surged above the 0.7320 level and the 50 hourly simple moving average. Besides, there was a break above a key bearish trend line with resistance near 0.7235 on the hourly chart of AUD/USD.
The pair even broke the 0.7380 resistance zone and traded as high as 0.7393. It is now consolidating gains below 0.7350. On the downside, an initial support is near the 0.7345 level. The 23.6% Fib retracement level of the upward move from the 0.7205 swing low to 0.7393 high is also near the 0.7245 level.
The next support could be the 50 hourly simple moving average or 0.7300. It is near the 50% Fib retracement level of the upward move from the 0.7205 swing low to 0.7393 high.
If there is a downside break below the 0.7300 support, the pair could extend its decline towards the 0.7250 level. Any more downsides might send the pair toward the 0.7200 level.
On the upside, the AUD/USD pair is facing resistance near the 0.7395 level. The next major resistance is near the 0.7400 level. A close above the 0.7400 level could start a steady increase in the near term. The next major resistance could be 0.7450.
NZD/USD Technical Analysis
The New Zealand Dollar also followed a similar path from the 0.6740 zone against the US Dollar. The NZD/USD pair gained pace above the 0.6780 resistance zone to move into a positive zone.
The pair traded above the 0.6820 level and the 50 hourly simple moving average. Besides, there was a move above a major bearish trend line with resistance near 0.6775 on the hourly chart of NZD/USD. It even spiked above the 0.6880 and traded as high as 0.6900.
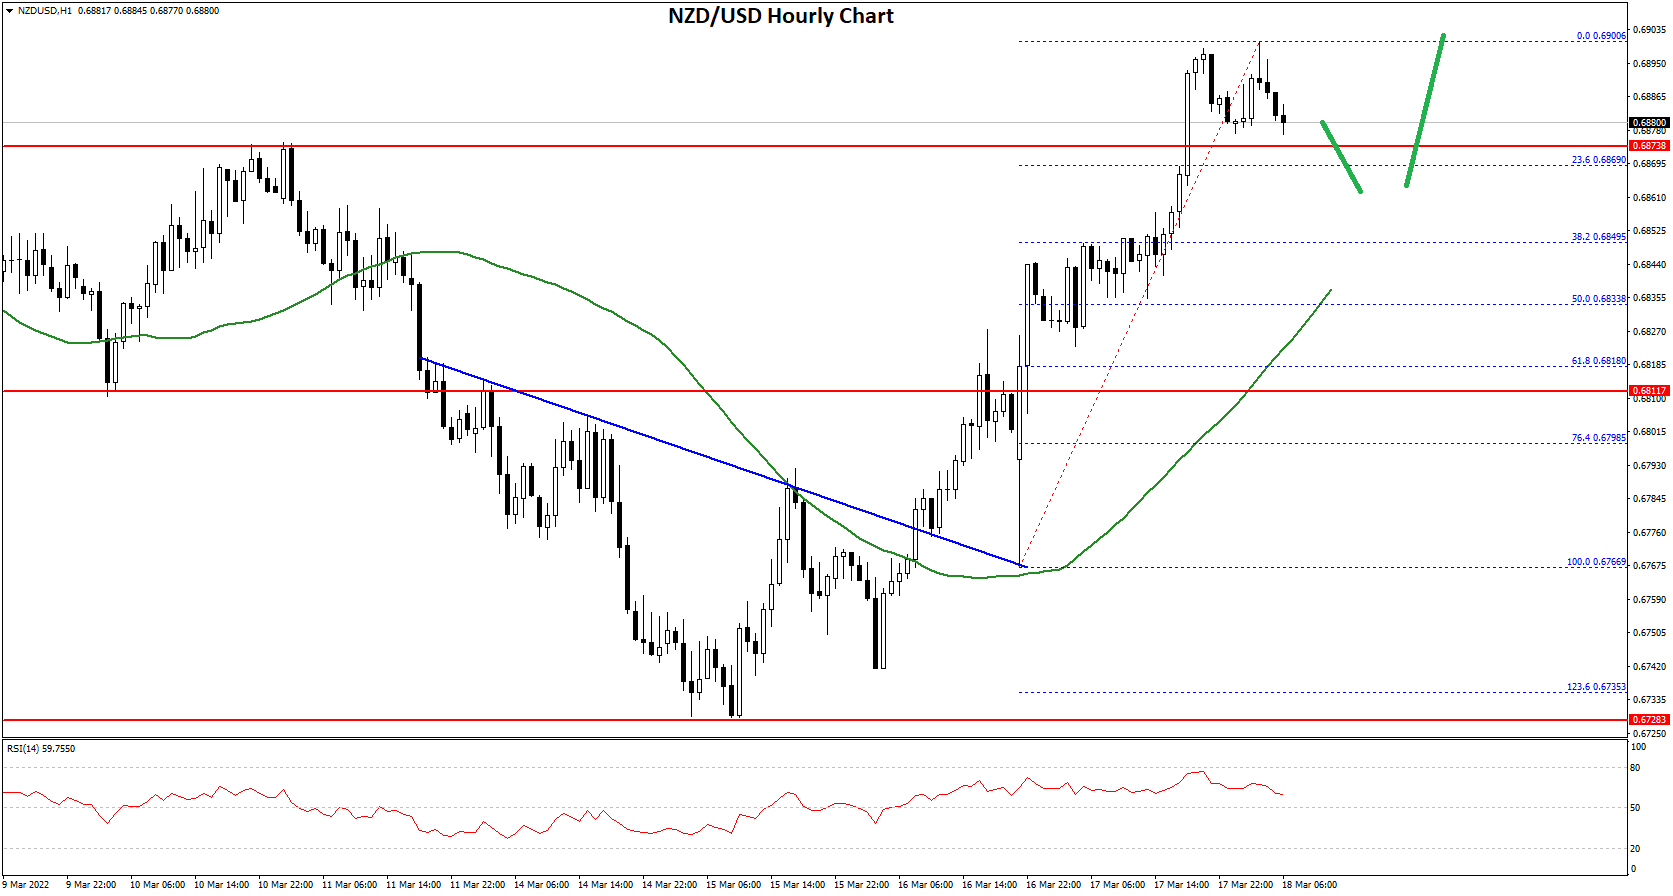
It is now consolidating gains below 0.6900. On the downside, an initial support is near the 0.6870 level. It is close to the 23.6% Fib retracement level of the upward move from the 0.6766 swing low to 0.6900 high.
The next support could be the 0.6930 zone or the 50 hourly simple moving average. It is near the 50% Fib retracement level of the upward move from the 0.6766 swing low to 0.6900 high. If there is a downside break below the 0.6830 support, the pair could extend its decline towards the 0.6780 level.
An immediate resistance on the upside is near the 0.6890 level. The first key resistance is near the 0.6900 level. The next major resistance is near the 0.6925 level. A clear move above the 0.6925 level might even push the pair towards the 0.7000 level.
This forecast represents FXOpen Markets Limited opinion only, it should not be construed as an offer, invitation or recommendation in respect to FXOpen Markets Limited products and services or as financial advice.

Be the first to comment