

AUD/USD is forming a base above 0.7345 and it could start a fresh increase. NZD/USD might also start a steady increase above the 0.7135 resistance zone.
Important Takeaways for AUD/USD and NZD/USD
· The Aussie Dollar is forming a decent support base near the 0.7350 zone against the US Dollar.
· There was a break above a key bearish trend line with resistance near 0.7375 on the hourly chart of AUD/USD.
· NZD/USD is also forming a base above the 0.7075 pivot level.
· There was a break above a major bearish trend line with resistance near 0.7100 on the hourly chart of NZD/USD.
AUD/USD Technical Analysis
After struggling to clear the 0.7470 resistance, the Aussie Dollar started a downside correction against the US Dollar. The AUD/USD pair broke the 0.7400 and 0.7375 support levels to move into a short-term bearish zone.
The pair even broke the 0.7360 support and the 50 hourly simple moving average. A low was formed near 0.7345 on FXOpen before the pair started a recovery wave. There was a break above the 0.7375 zone and the 50 hourly simple moving average.
There was also a break above a key bearish trend line with resistance near 0.7375 on the hourly chart of AUD/USD. The pair cleared the 23.6% Fib retracement level of the recent decline from the 0.7468 swing high to 0.7345 low.
An immediate resistance is near the 0.7390 level. The next major resistance is near the 0.7400 level. It is close to the 50% Fib retracement level of the recent decline from the 0.7468 swing high to 0.7345 low.
A close above the 0.7400 level could start a steady increase in the near term. The next major resistance could be 0.7450. An initial support on the downside is near the 0.7370 level. The next major support is near the 0.7345 level. If there is a downside break below the 0.7345 support, the pair could extend its decline towards the 0.7300 level.
NZD/USD Technical Analysis
The New Zealand Dollar also followed a similar path after it topped near the 0.7170 level against the US Dollar. The NZD/USD pair broke the 0.7120 support zone to move into a short-term bearish zone.
The pair even traded below the 0.7100 level and the 50 hourly simple moving average. However, the bulls defended the 0.7075 zone. A low was formed near 0.7076 and the pair is now rising slowly.
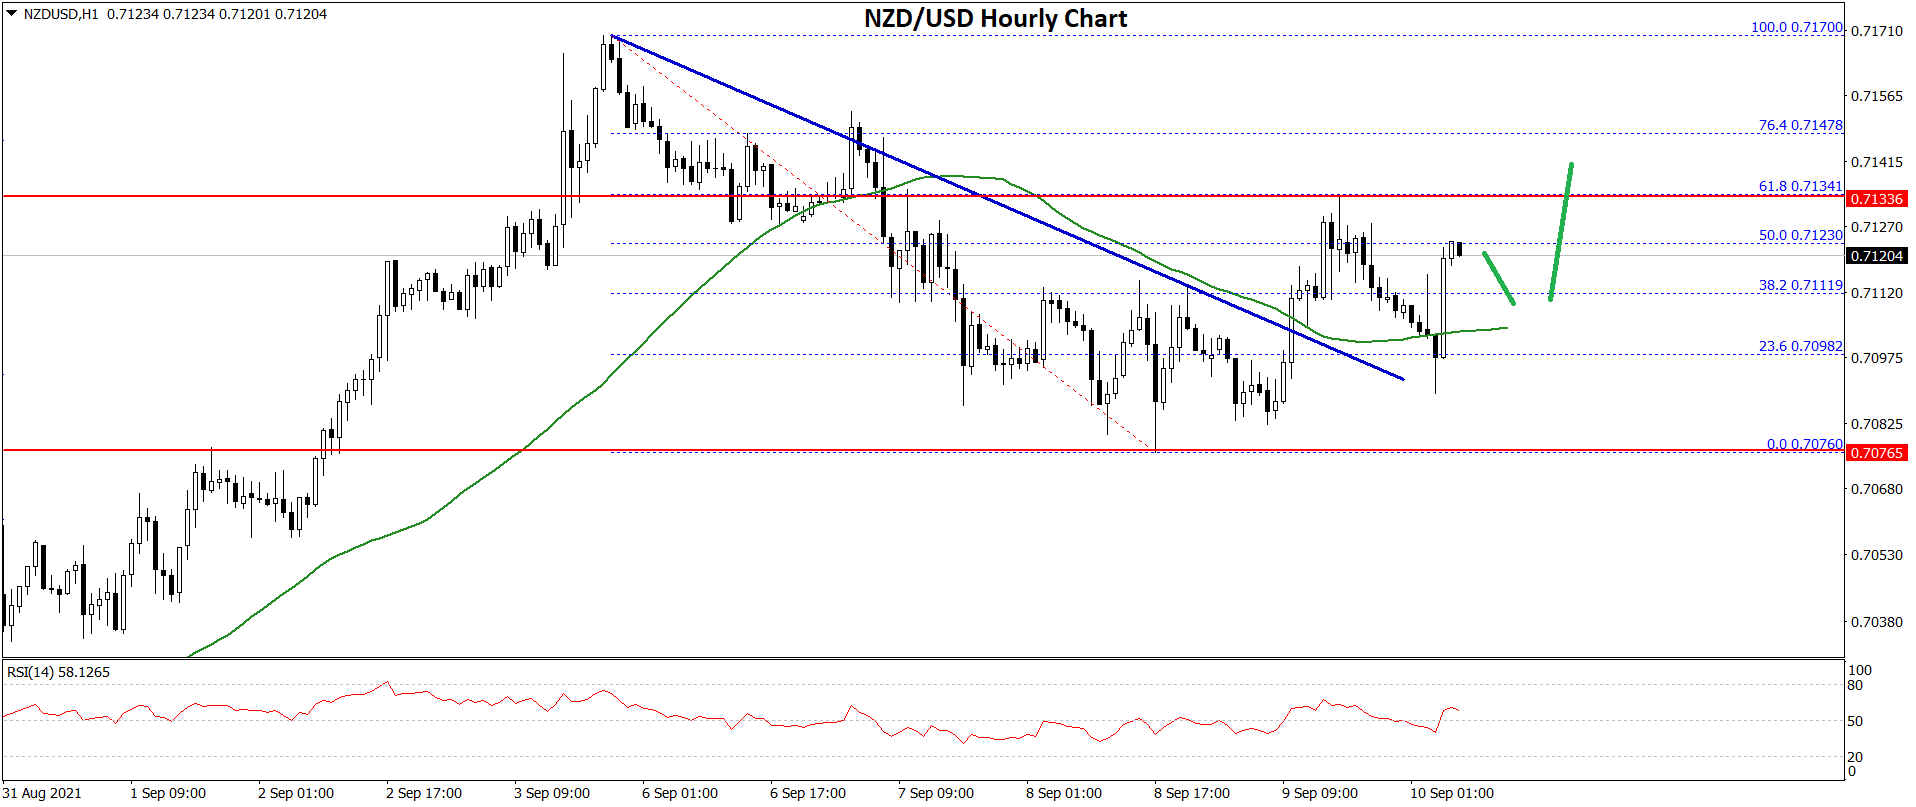
There was a break above the 0.7100 resistance and the 50 hourly simple moving average. Besides, there was a break above a major bearish trend line with resistance near 0.7100 on the hourly chart of NZD/USD.
The pair spiked above the 50% Fib retracement level of the downward move from the 0.7170 high to 0.7076 swing low. It is now facing resistance near the 0.7135 level.
The 61.8% Fib retracement level of the downward move from the 0.7170 high to 0.7076 swing low is also acting as a resistance. To move into a positive zone, the pair must settle above 0.7135 and 0.7140. In the stated case, the pair is likely to revisit the 0.7170 resistance zone in the near term.
An initial support on the downside is near the 0.7100 level. The next major support is near the 0.7075 level. If there is a downside break below the 0.7075 support, the NZD/USD pair could extend its decline towards the 0.7000 level.
This forecast represents FXOpen Markets Limited opinion only, it should not be construed as an offer, invitation or recommendation in respect to FXOpen Markets Limited products and services or as financial advice.

Be the first to comment