

AUD/USD is gaining pace above the 0.6950 resistance. NZD/USD is struggling to clear a key barrier near the 0.6250 resistance.
Important Takeaways for AUD/USD and NZD/USD
· The Aussie Dollar started a fresh increase above the 0.6950 resistance zone against the US Dollar.
· There is a short-term contracting triangle forming with support near 0.6955 on the hourly chart of AUD/USD.
· NZD/USD started an upside correction from the 0.6160 support zone.
· There is a connecting bearish trend line forming with resistance near 0.6230 on the hourly chart of NZD/USD.
AUD/USD Technical Analysis
The Aussie Dollar formed a base above the 0.6850 and 0.6860 levels against the US Dollar. The AUD/USD pair started a steady increase after it cleared the 0.6900 resistance zone.
There was a clear move above the 0.6920 resistance and the 50 hourly simple moving average. The pair even broke the 0.6950 hurdle and traded as high as 0.6991 on FXOpen. Recently, there was a minor downside correction below the 0.6980 level.
The pair dipped below the 23.6% Fib retracement level of the upward move from the 0.6879 swing low to 0.6991 high. However, the pair stayed above the 0.6950 level and the 50 hourly simple moving average.
There is also a short-term contracting triangle forming with support near 0.6955 on the hourly chart of AUD/USD. On the downside, an initial support is near the 0.6955 level.
The next support could be the 0.6935 level. It is near the 50% Fib retracement level of the upward move from the 0.6879 swing low to 0.6991 high. If there is a downside break below the 0.6935 support, the pair could extend its decline towards the 0.6850 level.
On the upside, the AUD/USD pair is facing resistance near the 0.6975 level. The next major resistance is near the 0.7000 level. A close above the 0.7000 level could start a steady increase in the near term. The next major resistance could be 0.7080.
NZD/USD Technical Analysis
The New Zealand Dollar failed to follow a similar path against the US Dollar. The NZD/USD pair formed a base above the 0.6160 level and recently started an upside correction.
There was a clear move above the 0.6200 resistance and the 50 hourly simple moving average. The pair even cleared the 0.6220 resistance and traded as high as 0.6250. Recently, there was a downside correction below the 0.6220 level.
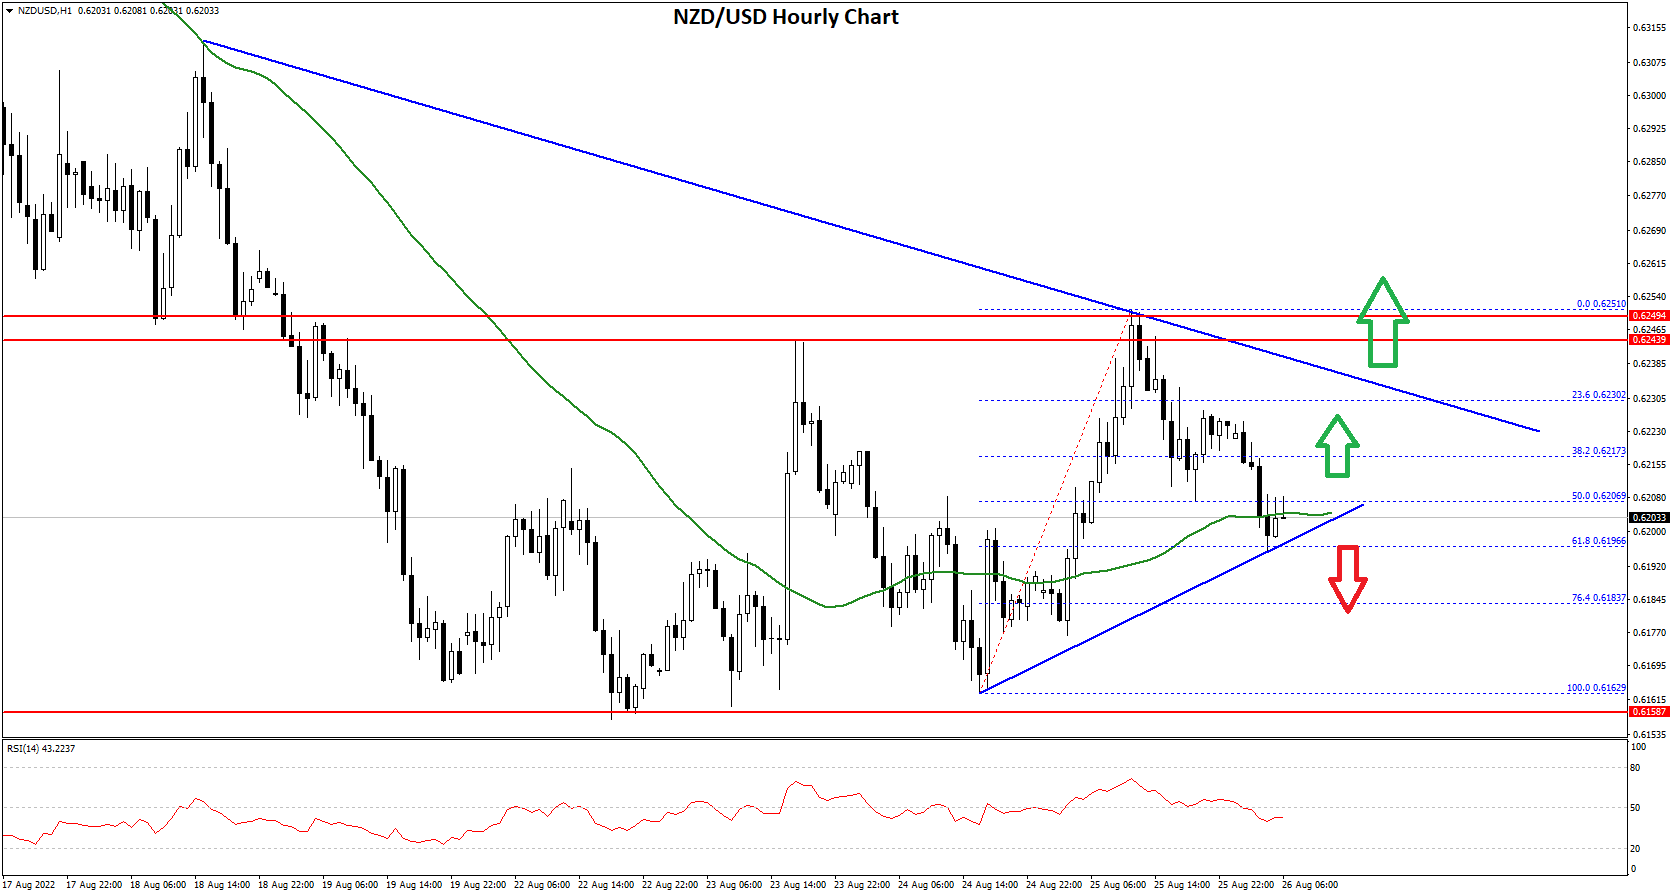
The pair dipped below the 50% Fib retracement level of the upward move from the 0.6162 swing low to 0.6250 high. However, the pair stayed above the 0.6200 level and the 50 hourly simple moving average.
The pair stayed above the 61.8% Fib retracement level of the upward move from the 0.6162 swing low to 0.6250 high. On the upside, an initial resistance is near the 0.6230 level. There is also a connecting bearish trend line forming with resistance near 0.6230 on the hourly chart of NZD/USD.
The next major resistance is near the 0.6250 level. A clear move above the 0.6250 level might even push the pair towards the 0.6300 level.
If not, the pair might continue lower below 0.6200. The next support could be the 0.6160 zone. If there is a downside break below the 0.6160 support, the pair could extend its decline towards the 0.6100 level.
This forecast represents FXOpen Markets Limited opinion only, it should not be construed as an offer, invitation or recommendation in respect to FXOpen Markets Limited products and services or as financial advice.
Trade global forex with the best ECN broker of 2021*.
Choose from 50+ forex markets 24/5.
Open your FXOpen account now or learn more about making your money go further with FXOpen.
* FXOpen International, best ECN broker of 2021, according to the IAFT

Be the first to comment