

Justin Sullivan/Getty Images News
Price Action Thesis
We present our detailed price action analysis on AT&T (NYSE:T) stock. We recently observed a series of bull and bear traps in its price action as T attempted to shake off its bearish bias.
Our analysis indicates that T stock is likely at a near-term bottom, with a validated bear trap. However, May’s bull trap at its near-term resistance could continue to offer stiff selling pressure, impeding its recovery. Notwithstanding, the price action signals suggest that its June bear trap could hold in the near term. However, the stock could be mired in its bearish flow unless it retakes its near-term resistance convincingly.
Our reverse cash flow model indicates that the market expects T stock to continue underperforming the market. Therefore, we believe investors should wait for a deeper retracement before considering adding T stock.
As such, we rate T stock as a Hold for now.
AT&T Stock – Retaking The $22 Level Is Critical
T price chart (monthly) (TradingView)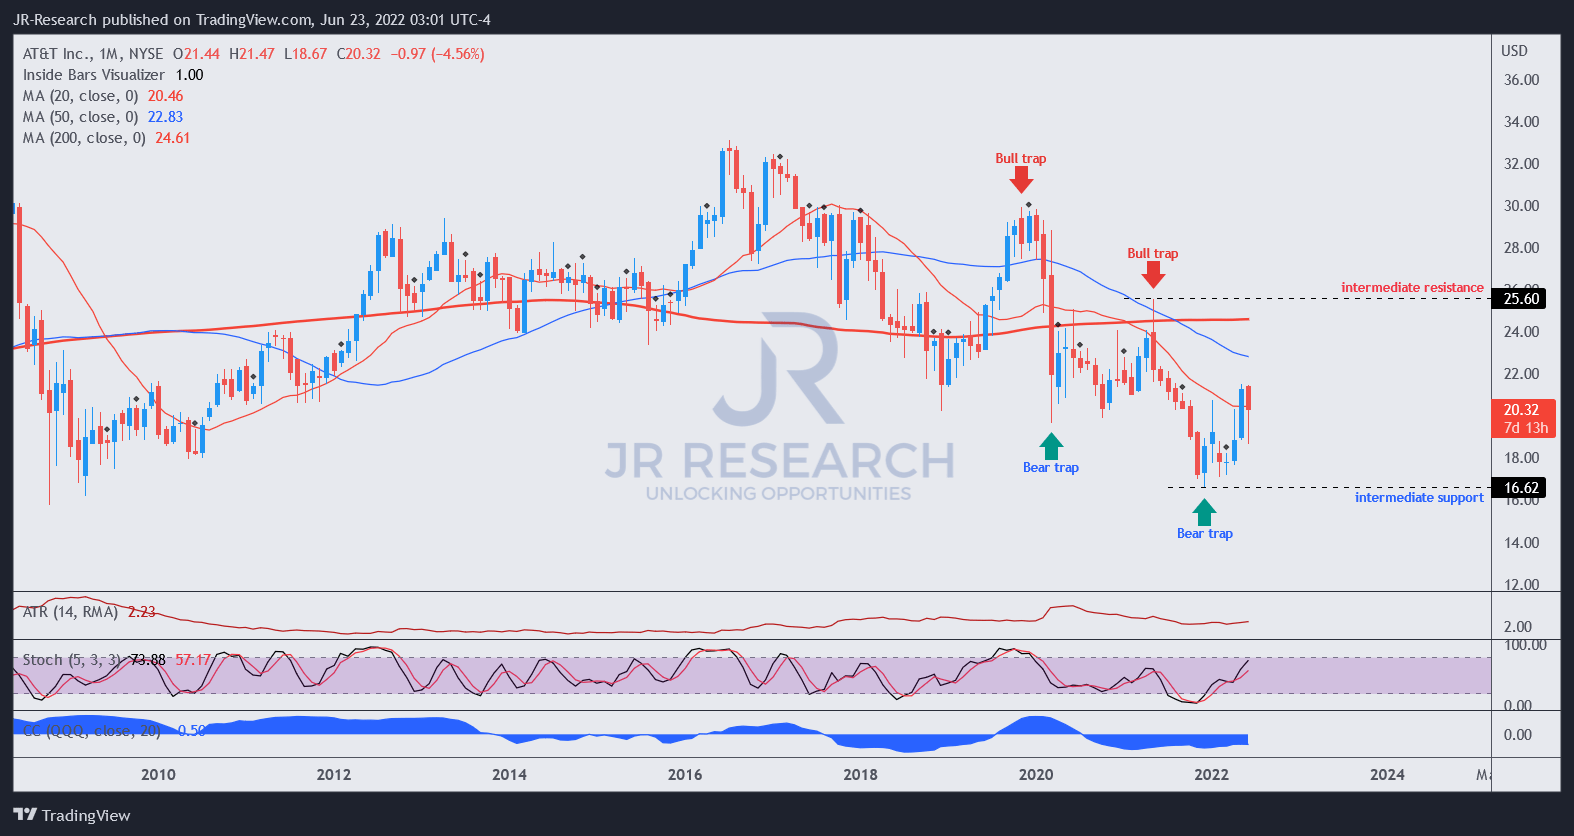
We believe it’s critical for investors to appreciate that the dominant long-term trend in T stock remains bearish until proven otherwise. The market has been using the positive news from its recent spin-off to draw in dip buyers, as it formed its near-term resistance in May. Therefore, we believe that progress from its bear trap in February 2022 has been resolved.
T price chart (weekly) (TradingView)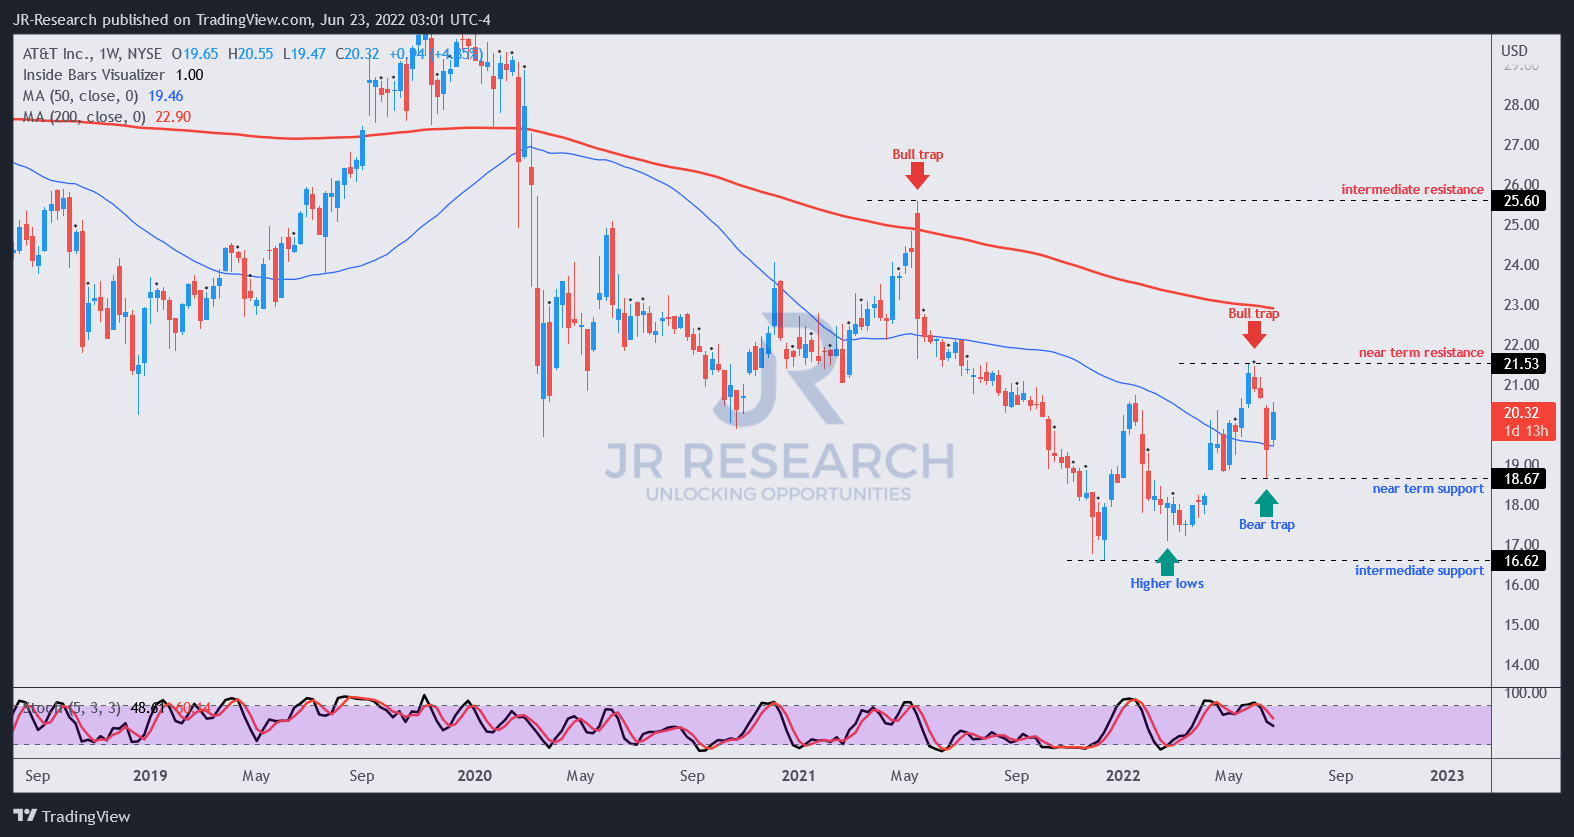
Moving into its weekly chart, we can clearly glean the May 2022’s bull trap of $21.50. As a result, it also formed the near-term resistance in T stock, markedly below its previous May 2021 bull trap (intermediate resistance). Therefore, investors should note that T remains in bearish flow unless it can retake its near-term resistance convincingly.
Notwithstanding, T stock also formed a bear trap at its June bottom, as the market rejected further selling. We believe it has been resolved, given the steep decline from its May 2022 bull trap.
The price action signals are tilted towards a near-term bullish bias. However, given the proximity to its near-term resistance, we don’t observe a reasonable risk/reward profile for now.
The Market Is Not Convinced With T Stock Valuation
T valuation metrics (TIKR)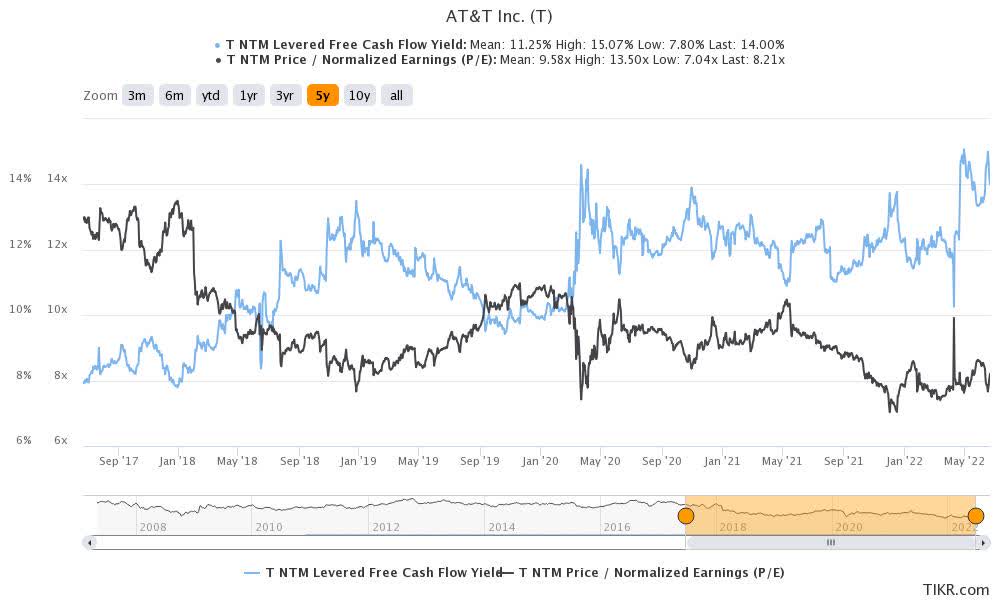
T stock last traded at an NTM FCF yield of 14%. Notably, the market set up its May bull trap at about the 13% yield mark, rejecting its buying momentum. However, the recent bear trap in June (14.5% yield) indicated that the market considered that cheap enough, as it stymied further selling pressure.
Therefore, we believe using a blended FCF yield of 13.8% is appropriate to model the market’s current valuation of T stock.
| Stock | T |
| Current market cap | $145.47B |
| Hurdle rate (CAGR) | 9% |
| Projection through | CQ2’26 |
| Required FCF yield in CQ2’26 | 13.75% |
| Assumed TTM FCF margin in CQ2’26 | 15.2% |
| Implied TTM revenue by CQ2’26 | $185.76B |
T reverse cash flow valuation model A. Data source: S&P Cap IQ, author
We used a hurdle rate equivalent to the SPDR S&P 500 ETF’s (SPY) 5Y CAGR of 9%. As a result, T could underperform the market at the current valuation.
Our model implies a TTM revenue target of $185.76B by CQ2’26, which is highly unlikely. Therefore, we believe the market is justified in asking for higher FCF yields to compensate for potential underperformance.
| Stock | T |
| Assumed entry price | $17 |
| Hurdle rate (CAGR) | 9% |
| Projection through | CQ2’26 |
| Required FCF yield in CQ2’26 | 11% |
| Assumed TTM FCF margin in CQ2’26 | 15.2% |
| Implied TTM revenue by CQ2’26 | $124.32B |
T reverse cash flow valuation model B. Data source: S&P Cap IQ, author
However, we also noted that T stock formed a significant bear trap in February 2022 at the $17.10 level. Therefore, it informed us that the market considered that level highly attractive. It also supported a higher low against the December 2021 bottom, which is constructive.
Notably, the FCF yield at the February 2022 bear trap was about 12%. Therefore, the market considered 12% as cheap at that level. As a result, we revised our assumed entry price to $17 and attempt to market the market’s expectations of T’s implied valuation.
We also used a lower FCF yield of 11% to reflect an appropriate yield given the market’s rejection of requiring 12% at that level.
Consequently, we derived an implied TTM revenue of $124.32B by CQ2’26, based on a hurdle rate of 9%. Therefore, it makes sense that the market requires a lower FCF yield at that level, as T stock could potentially perform in line with the market.
Therefore, we urge investors to be patient in T stock and wait for a deeper retracement before considering adding exposure.
Is T Stock A Buy, Sell, Or Hold?
We rate T stock as a Hold for now. The price action in T is leaning on the bullish side, but we expect stiff selling pressure at its near-term resistance. T must convincingly retake its May 2022 bull trap to regain its bullish bias. Otherwise, the long-term bearish flow remains intact.
Our valuation analysis suggests that investors could underperform the market at the current levels. It’s also in line with the market expectations of requiring higher FCF yields to hold T stock at the current levels.
Therefore, we urge investors to be patient and wait for a much deeper retracement before adding exposure.
Be the first to comment